

Integrating single-cell and spatial transcriptomics reveals endoplasmic reticulum stress-related CAF subpopulations associated with chordoma progression
- PMID: 37772937
- PMCID: PMC10836767
- DOI: 10.1093/neuonc/noad173
Integrating single-cell and spatial transcriptomics reveals endoplasmic reticulum stress-related CAF subpopulations associated with chordoma progression
Erratum in
-
Corrigendum to: Integrating single-cell and spatial transcriptomics reveals endoplasmic reticulum stress-related CAF subpopulations associated with chordoma progression.Neuro Oncol. 2025 Jul 28:noaf159. doi: 10.1093/neuonc/noaf159. Online ahead of print. Neuro Oncol. 2025. PMID: 40719554 No abstract available.
Abstract
Background: With cancer-associated fibroblasts (CAFs) as the main cell type, the rich myxoid stromal components in chordoma tissues may likely contribute to its development and progression.
Methods: Single-cell RNA sequencing (scRNA-seq), spatial transcriptomics, bulk RNA-seq, and multiplexed quantitative immunofluorescence (QIF) were used to dissect the heterogeneity, spatial distribution, and clinical implication of CAFs in chordoma.
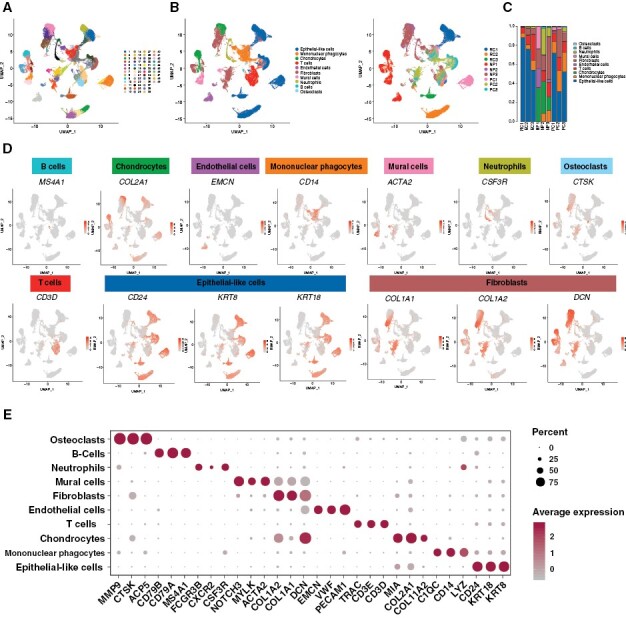
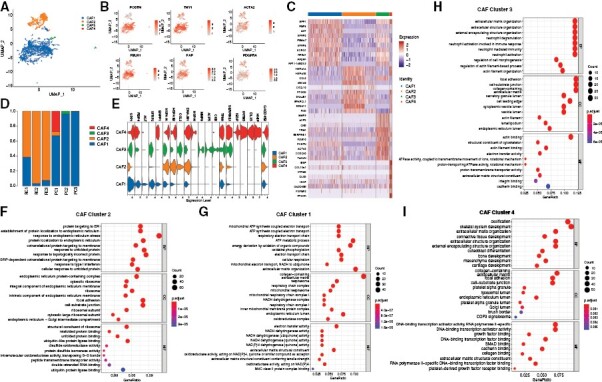
Results: We sequenced here 72 097 single cells from 3 primary and 3 recurrent tumor samples, as well as 3 nucleus pulposus samples as controls using scRNA-seq. We identified a unique cluster of CAF in recurrent tumors that highly expressed hypoxic genes and was functionally enriched in endoplasmic reticulum stress (ERS). Pseudotime trajectory and cell communication analyses showed that this ERS-CAF subpopulation originated from normal fibroblasts and widely interacted with tumoral and immune cells. Analyzing the bulk RNA-seq data from 126 patients, we found that the ERS-CAF signature score was associated with the invasion and poor prognosis of chordoma. By integrating the results of scRNA-seq with spatial transcriptomics, we demonstrated the existence of ERS-CAF in chordoma tissues and revealed that this CAF subtype displayed the most proximity to its surrounding tumor cells. In subsequent QIF validation involving 105 additional patients, we confirmed that ERS-CAF was abundant in the chordoma microenvironment and located close to tumor cells. Furthermore, both ERS-CAF density and its distance to tumor cells were correlated with tumor malignant phenotype and adverse patient outcomes.
Conclusions: These findings depict the CAF landscape for chordoma and may provide insights into the development of novel treatment approaches.
Keywords: cancer-associated fibroblasts; chordoma progression; endoplasmic reticulum stress; scRNA-seq; spatial transcriptomics.
© The Author(s) 2023. Published by Oxford University Press on behalf of the Society for Neuro-Oncology. All rights reserved. For permissions, please e-mail: journals.permissions@oup.com.
Conflict of interest statement
The authors declare that they have no competing interests.
Figures


Comment in
-
Skull base chordoma and spinal chordoma exhibit consistency in terms of endoplasmic reticulum stress aspects.Neuro Oncol. 2024 Jun 3;26(6):1171-1173. doi: 10.1093/neuonc/noae050. Neuro Oncol. 2024. PMID: 38557822 Free PMC article. No abstract available.
References
-
- Gill CM, Fowkes M, Shrivastava RK.. Emerging therapeutic targets in chordomas: a review of the literature in the genomic era. Neurosurgery. 2020;86(2):E118–E123. - PubMed
-
- Kayani B, Hanna SA, Sewell MD, et al. A review of the surgical management of sacral chordoma. Eur J Surg Oncol. 2014;40(11):1412–1420. - PubMed
-
- Zhou J, Sun J, Bai HX, et al. Prognostic factors in patients with spinal chordoma: an integrative analysis of 682 patients. Neurosurgery. 2017;81(5):812–823. - PubMed
Publication types
MeSH terms
Grants and funding
LinkOut - more resources
Full Text Sources
