. 2023 Dec 1;29(67):e202302426.
doi: 10.1002/chem.202302426. Epub 2023 Oct 19.

Fluorination Influences the Bioisostery of Myo-Inositol Pyrophosphate Analogs

Affiliations

Fluorination Influences the Bioisostery of Myo-Inositol Pyrophosphate Analogs

Sarah Hostachy et al. Chemistry. .

Abstract

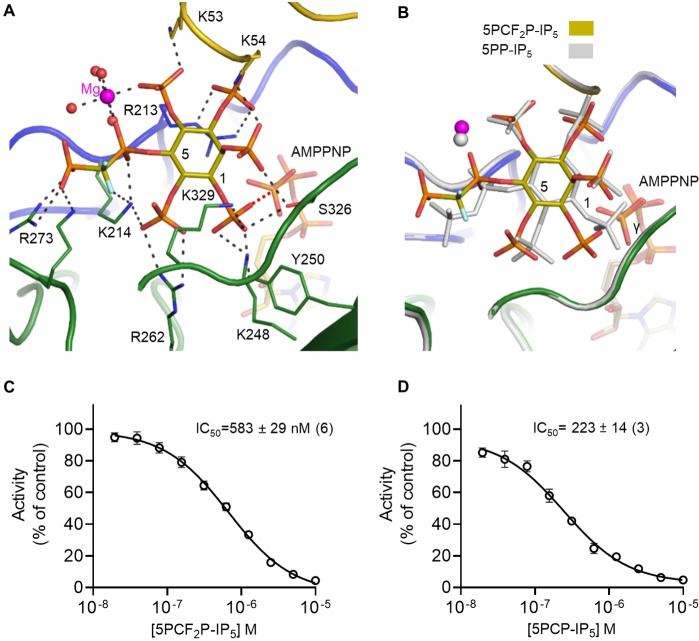
Inositol pyrophosphates (PP-IPs) are densely phosphorylated messenger molecules involved in numerous biological processes. PP-IPs contain one or two pyrophosphate group(s) attached to a phosphorylated myo-inositol ring. 5PP-IP5 is the most abundant PP-IP in human cells. To investigate the function and regulation by PP-IPs in biological contexts, metabolically stable analogs have been developed. Here, we report the synthesis of a new fluorinated phosphoramidite reagent and its application for the synthesis of a difluoromethylene bisphosphonate analog of 5PP-IP5 . Subsequently, the properties of all currently reported analogs were benchmarked using a number of biophysical and biochemical methods, including co-crystallization, ITC, kinase activity assays and chromatography. Together, the results showcase how small structural alterations of the analogs can have notable effects on their properties in a biochemical setting and will guide in the choice of the most suitable analog(s) for future investigations.

Keywords: fluorine; inositol pyrophosphates; phosphoramidite; phosphorylation; protein structures.


Conflict of interest statement

The authors declare no conflict of interest.

Figures

Figure 1
Figure 1
Inositol polyphosphates and their non‐hydrolysable analogs. (A) Abbreviated biosynthesis of inositol polyphosphates. (B–E) Structures of metabolically stable analogs of 5PP−IP5.
Scheme 1
Scheme 1
Synthesis of the fluorinated analog 5PCF2P−IP5. (A) Synthesis of the fluorinated combined phosphoramidite 1 was adapted from a recently reported strategy.[ 6 , 7 ] (B) In the first attempts to obtain 5PCF2P−IP5, inspired by our previous work on methylene bisphosphonate moieties, the difluoro−bisphosphonate moiety was appended on an early synthesis intermediate. (C) In the synthetic route that led to 5PCF2P−IP5, on the contrary, the difluoro−bisphosphonate moiety should be appended at the very end of the synthesis.
Figure 2
Figure 2
Representative NMR signals of the fluorinated phosphoramidite 1. Selected regions of (A) 31P NMR and (B) 19F NMR spectra of 1.
Figure 3
Figure 3
Interactions of 5PCF2P−IP and 5PCF2Am−IP5 with Dipp1. (A) Stick models are used to depict 5‐PCF2P−IP5 and residues within polar‐bond range (<3.2 Å) in a crystal complex with DIPP1 (PDB code: 8G9 C); orange denotes phosphorus, red indicates oxygen, blue indicates fluoride, blue denotes nitrogen. The OMIT map is contoured at 2.5 σ and is shown in Figure S4. Four magnesium atoms are depicted as magenta spheres. (B) The orientation of 5PCF2P−IP5 in panel A (stick model with olive carbons) is superimposed upon 5PP−IP5 (dark yellow carbons) in complex with DIPP1, as described in an earlier study ([37]; PDB code, 6WO7). (C) 5PCF2Am−IP5 (wheat‐colored carbons; C‐5 is numbered) in a crystal complex with DIPP1 (PDB code: 8G9D). The omit map is contoured at 2.5 σ. (D) Superimposition of 5PCF2P−IP5 in panel A upon 5PCF2Am−IP5 from panel C. (E), Superimposition of 5PCF2Am−IP5 from panel C upon 5PCF2Am−IP5 in a crystal complex with ScDdp1 (light green carbons). (F) Superimposition of 5PCF2P−IP5 from panel A with 5PCP−IP5 in complex with DIPP1 (dark green carbons; [37], PDB code, 6WOG).
Figure 4
Figure 4
Interactions of 5PCF2P−IP5, 5PP−IP5 and 5PCP−IP5 with the PPIP5KKD kinase domain. (A) Structural depiction of the catalytic pocket of the PPIP5K241–366/5PCF2P−IP5/AMPPNP crystal complex (PDB code: 8G9E). Colour‐coded tubes depict protein loops hosting residues that form polar contacts (broken black lines) with PPIP5K2KD: yellow for the αβα domain, while blue and green denote different lobes from the ATP‐grasp domain (see [39]). 5PCF2P−IP5 and its interacting residues are depicted as colour‐coded stick models: carbons are olive, phosphorus is orange, oxygen is red, nitrogen is blue, and fluorine is cyan, the magenta sphere depicts magnesium, and the red spheres represent water molecules. The OMIT difference map for 5PCF2P−IP5 is contoured at 5.0 σ and shown in Figure S4. The broken red line depicts the 5.3 Å distance between the γ‐phosphate of AMPPNP and the closest oxygen from the 1‐phosphate. (B) Superimposition of PPIP5K241–366 protein complexes containing either 5PP−IP5 (PDB=3T9D; depicted in light gray, 1‐ and 5‐carbons are labeled) or 5PCF2P−IP5 (color‐coded as in panel A). (C, D) IC50 plots for inhibition of the reverse kinase activity of PPIP5K21–366, from a total of 6 (panel C) or 3 (panel D) independent experiments.
Figure 5
Figure 5
Analysis of ligand binding to the PPIP5K2KD by ITC. Test solutions contained 7.5 μM of PPIP5K21–366 in the sample cell and 75 μM ligand in the syringe. Other details are provided in the Methods Section. Representative thermograms (1 of 3 replicates) are shown for titration of either (A) 5PP−IP5; (B) 5PCPF2P−IP5; (C) 5PCP−IP5; (D) 5PCF2Am−IP5; (E) 5PA−IP5. (F) Corresponding thermodynamic data.
Figure 6
Figure 6
HPLC analysis of the products of PPIP5K‐mediated phosphorylation of 5PP−IP5 and the various analogs. (A) Principle of the assay. PPIP5K21–366 was incubated with [33P‐γ]ATP and either 5PP−IP5 or one of the analogs (each of which is color‐coded as described in the figure), as described in Experimental Section. The [33P]‐labeled reaction products were resolved in individual HPLC runs, and the elution data are incorporated into a single plot. (B) A representative data set is shown, from a total of 3 independent experiments.

References

    1. Wilson M. S. C., Livermore T. M., Saiardi A., Biochem. J. 2013, 452, 369–379. - PubMed
    1. Hand C. E., Honek J. F., Bioorg. Med. Chem. Lett. 2007, 17, 183–188. - PubMed
    1. J. A. M. Morgan, A. Singh, L. Kurz, M. Nadler-Holly, M. Penkert, E. Krause, F. Liu, R. Bhandari, D. Fiedler, bioRxiv 2022, bioRxiv 2022.11.11.516170; doi: 10.1101/2022.11.11.516170. - DOI
    1. Bhandari R., Saiardi A., Ahmadibeni Y., Snowman A. M., Resnick A. C., Kristiansen T. Z., Molina H., Pandey A., Werner J. K., Juluri K. R., others, Proc. Nat. Acad. Sci. 2007, 104, 15305–15310. - PMC - PubMed
    1. Saiardi A., Bhandari R., Resnick A. C., Snowman A. M., Snyder S. H., Science 2004, 306, 2101–2105. - PubMed

LinkOut - more resources