. 2023 Dec 4;220(12):e20230944.
doi: 10.1084/jem.20230944. Epub 2023 Sep 29.

TLR9 ligand sequestration by chemokine CXCL4 negatively affects central B cell tolerance

Affiliations

TLR9 ligand sequestration by chemokine CXCL4 negatively affects central B cell tolerance

Elif Çakan et al. J Exp Med. .

Abstract

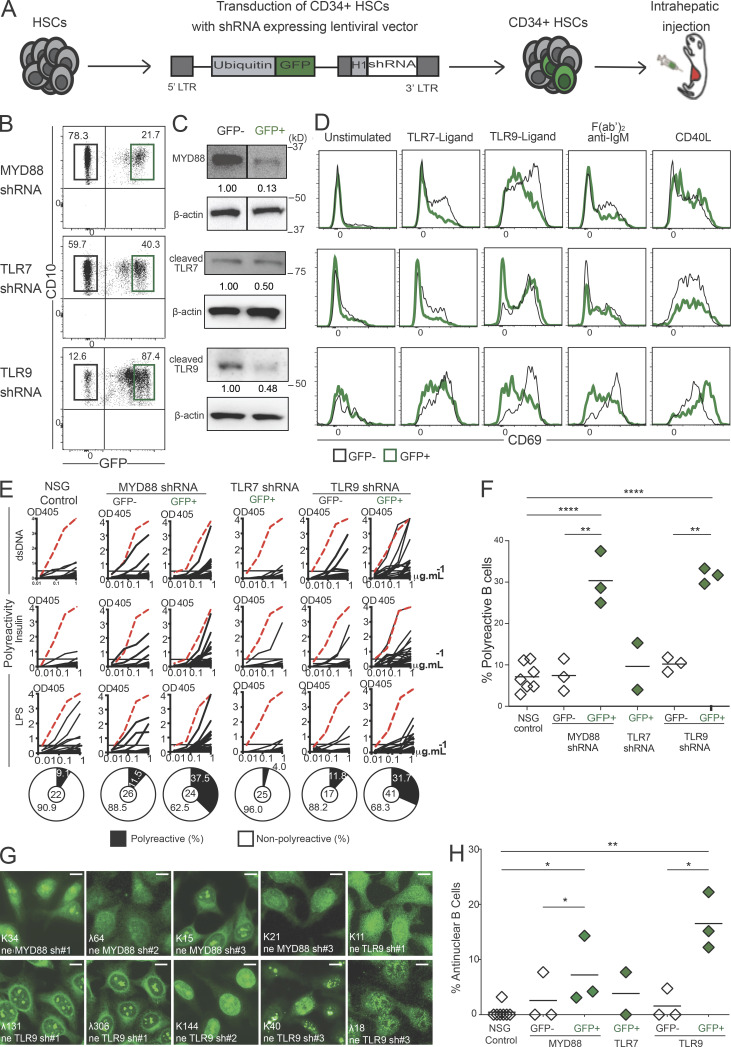
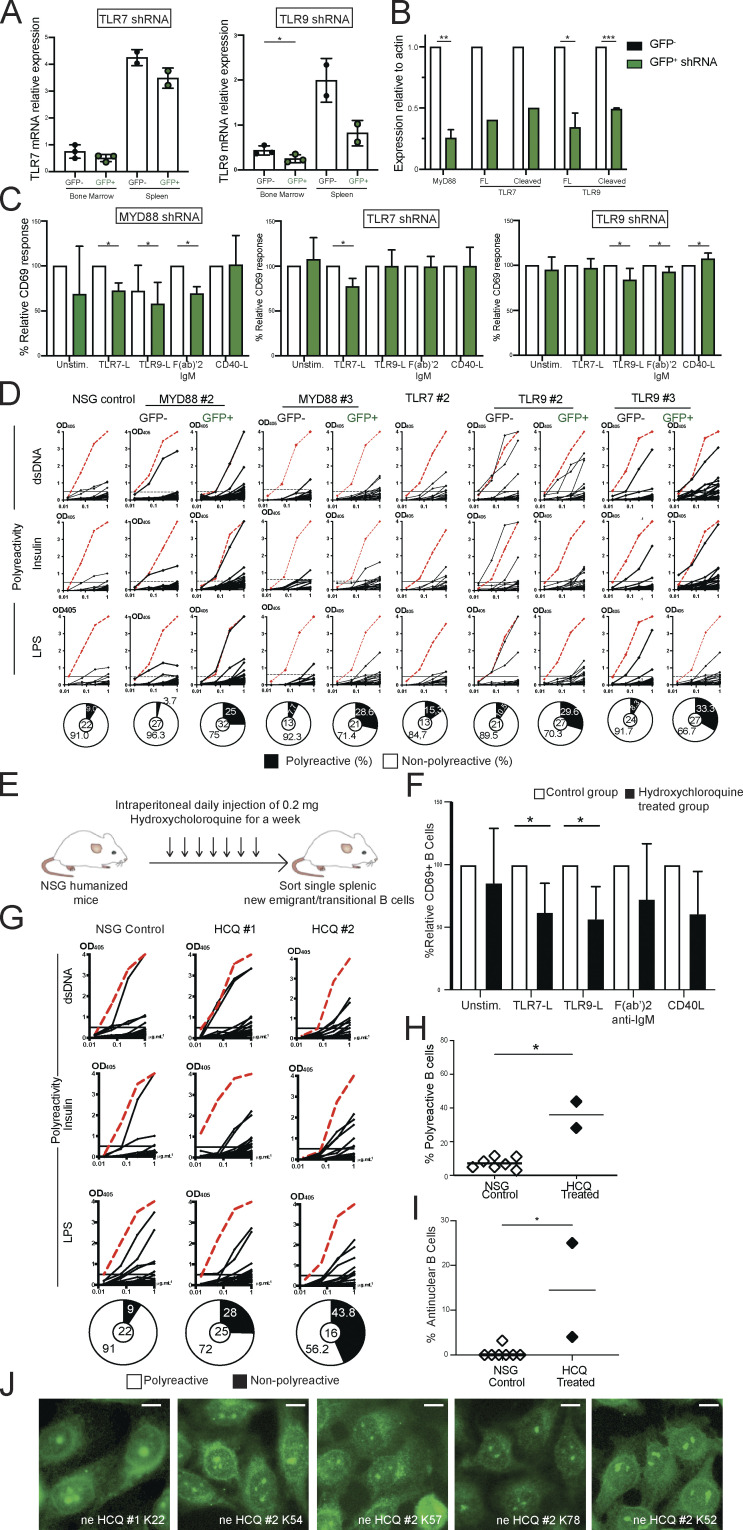
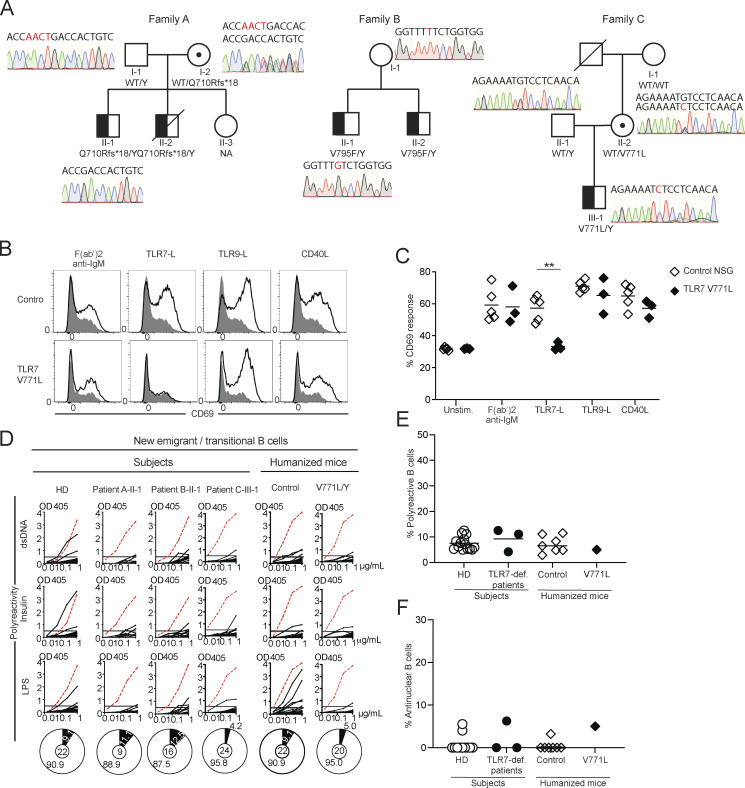
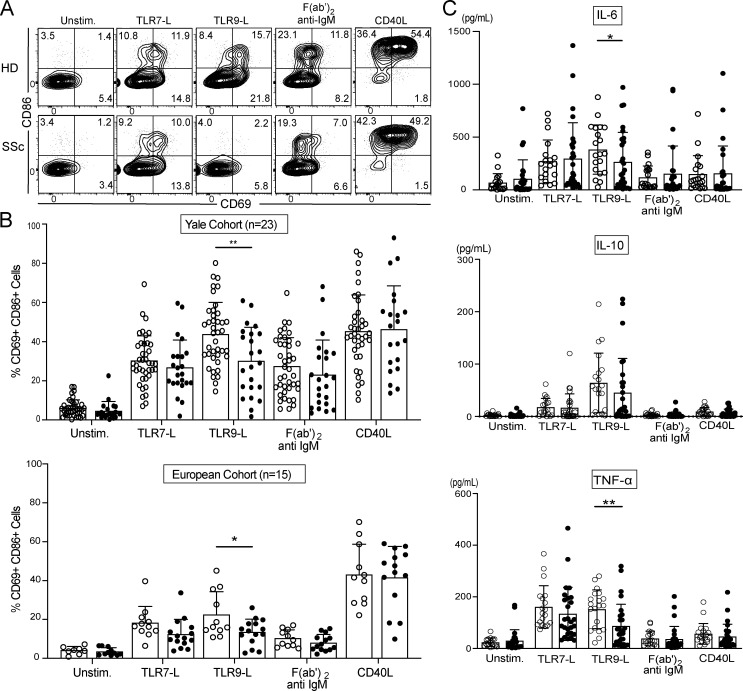
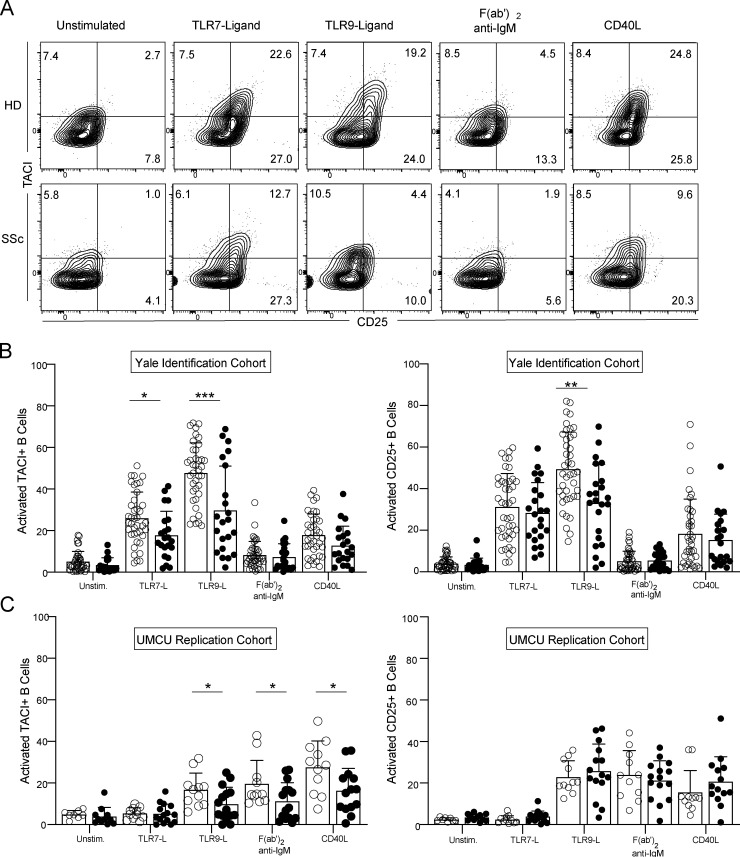
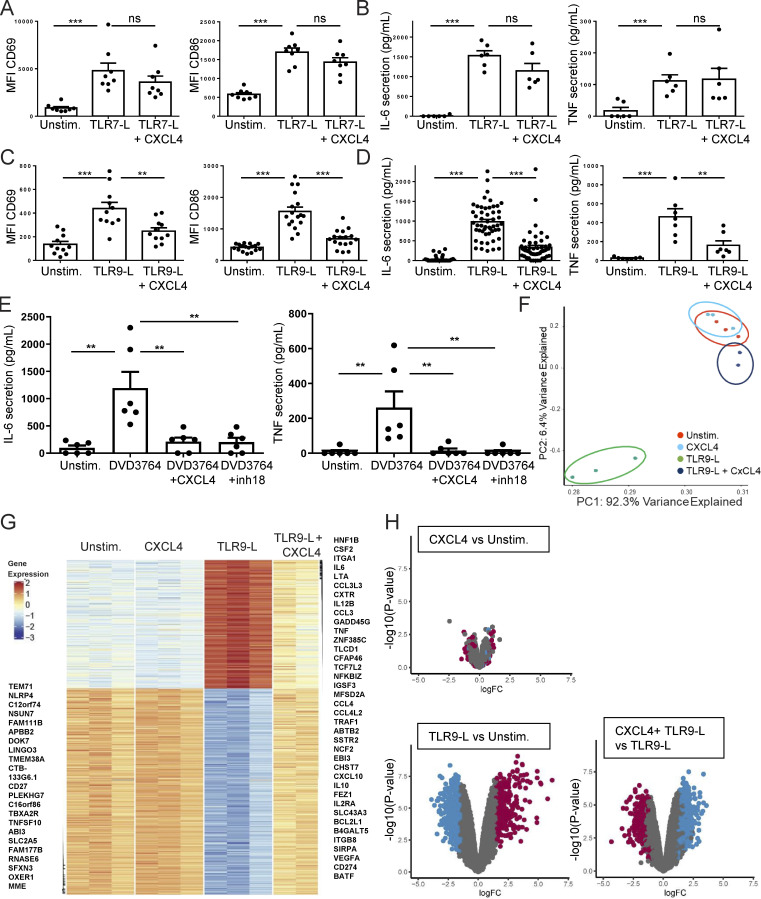
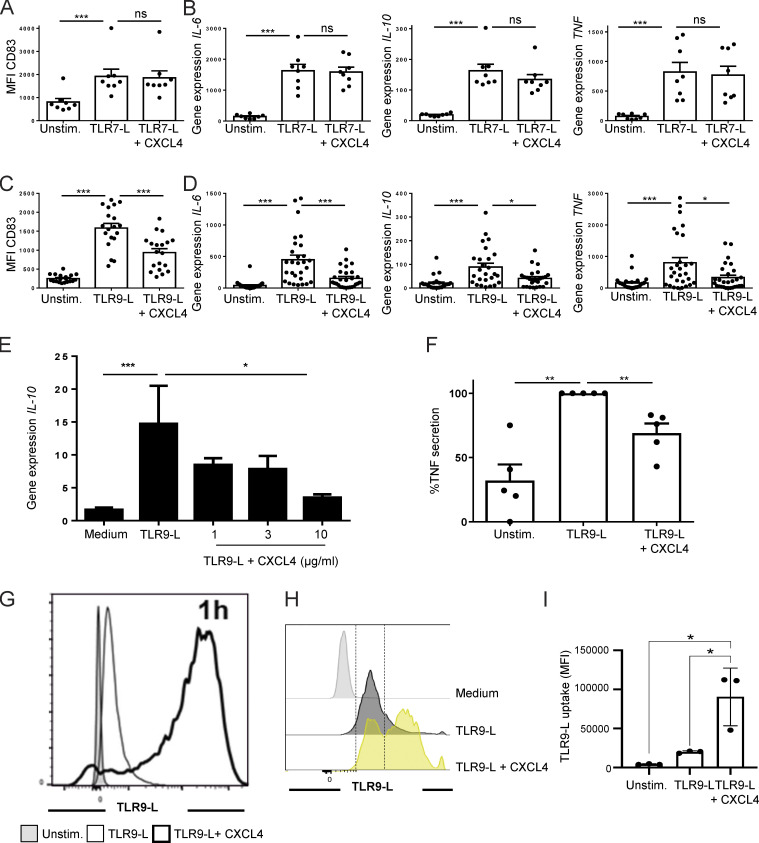
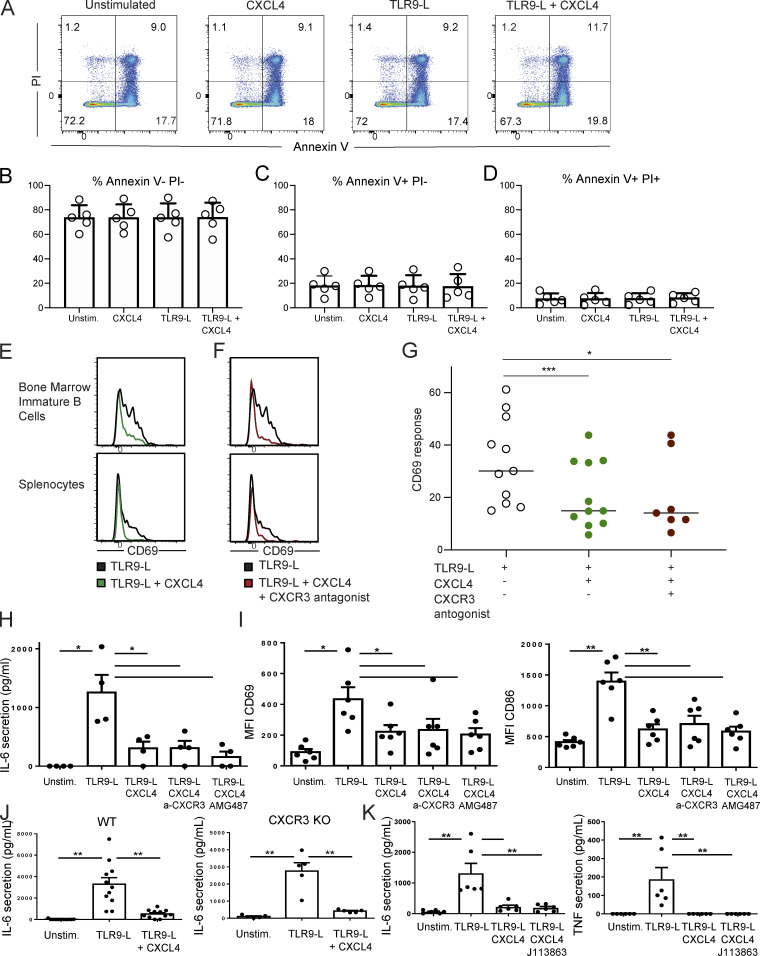
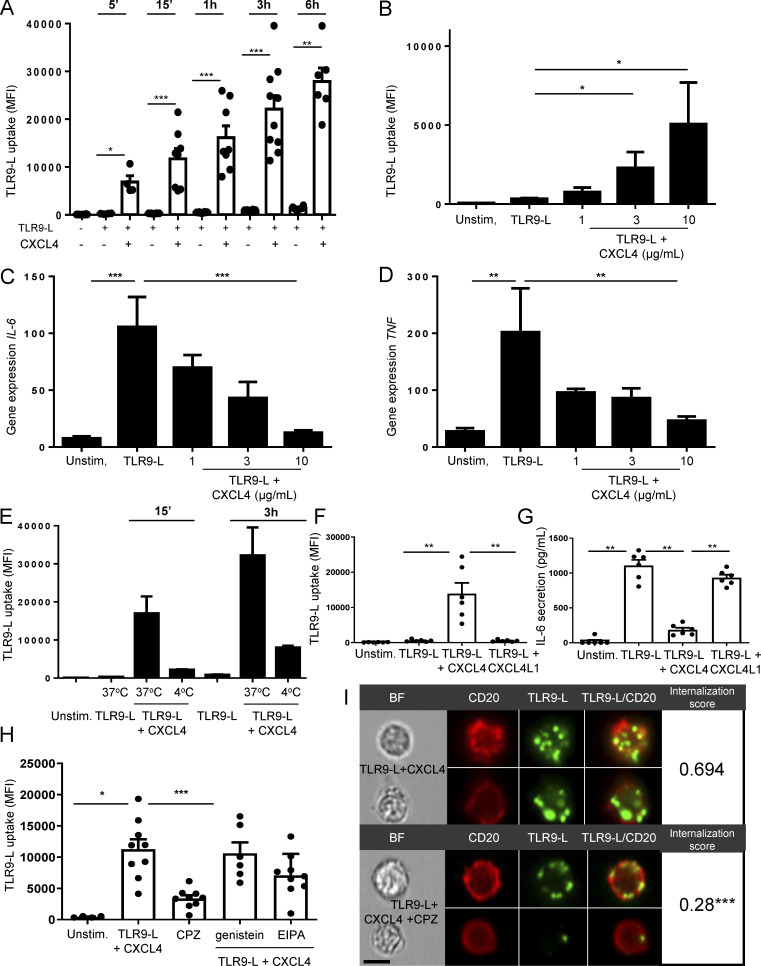
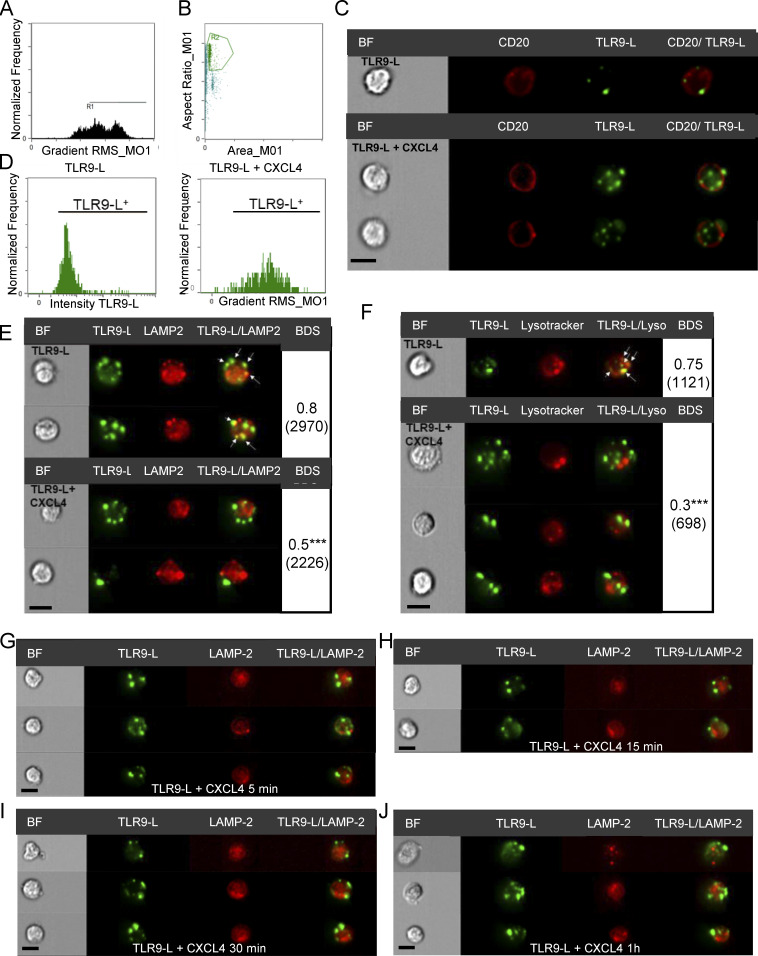
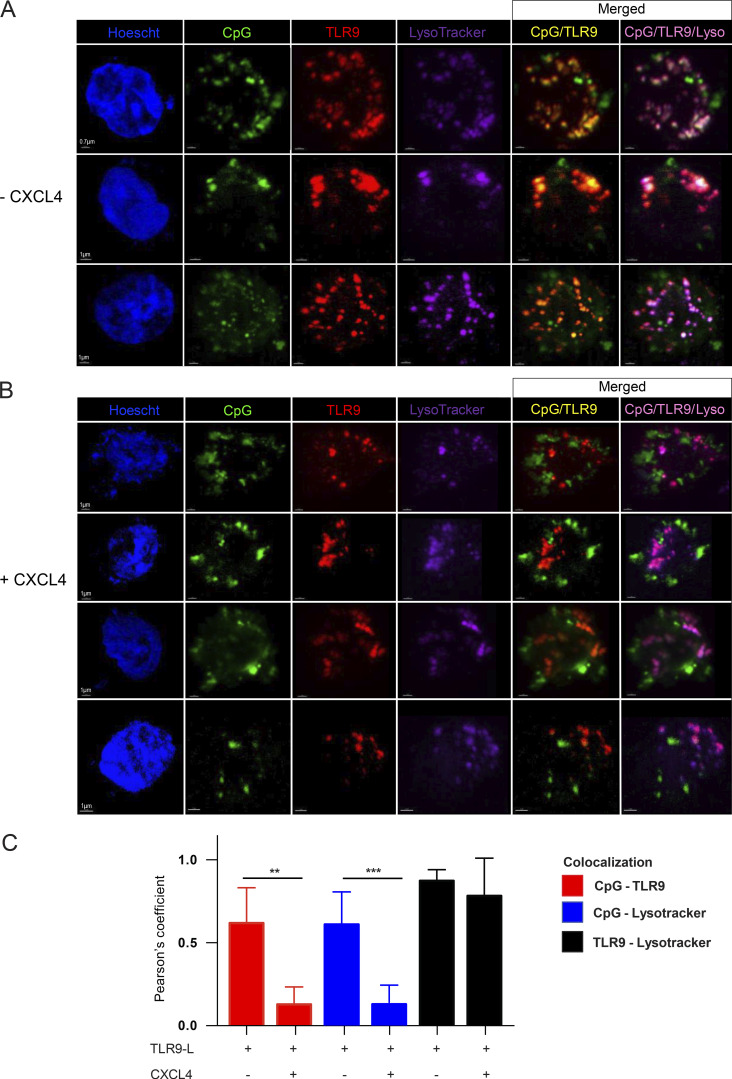
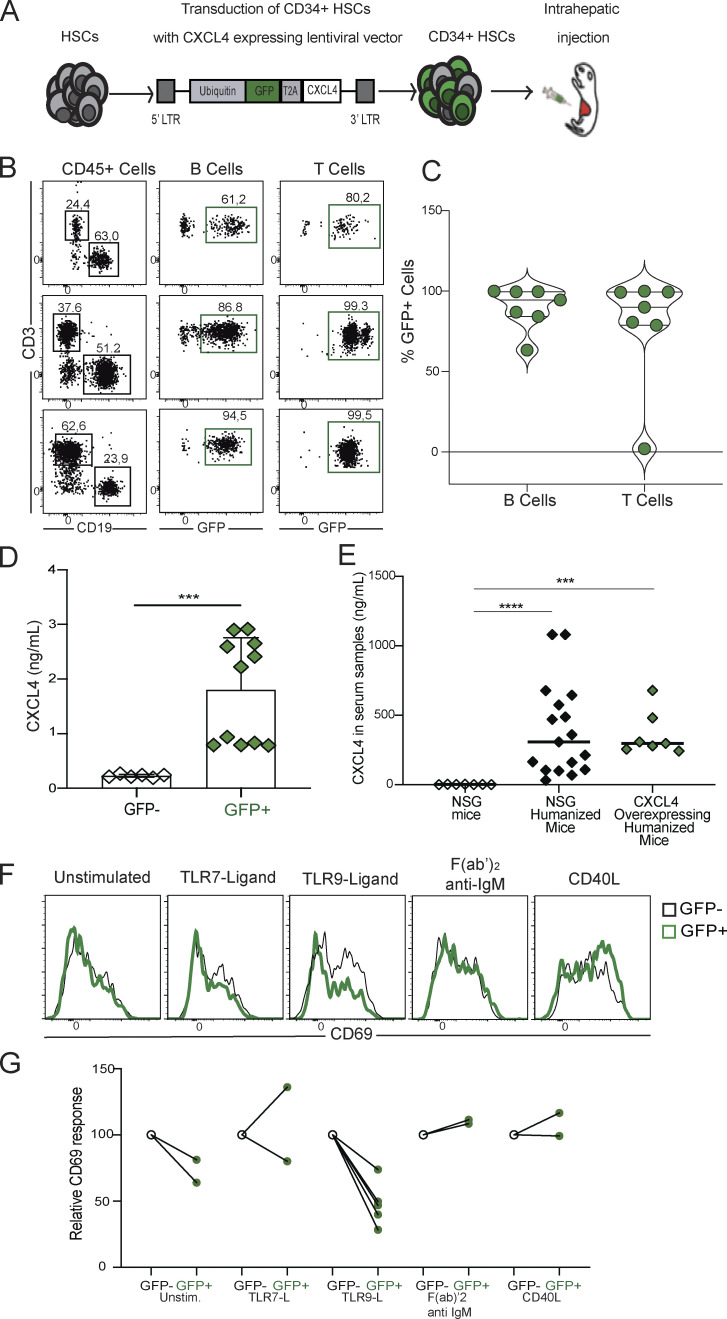
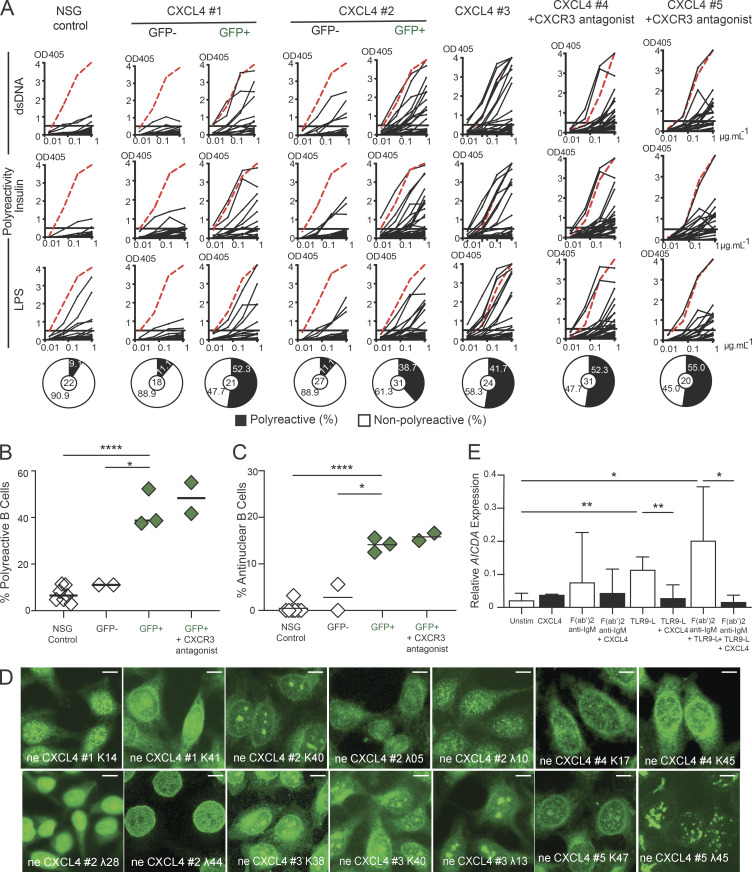
Central B cell tolerance is believed to be regulated by B cell receptor signaling induced by the recognition of self-antigens in immature B cells. Using humanized mice with defective MyD88, TLR7, or TLR9 expression, we demonstrate that TLR9/MYD88 are required for central B cell tolerance and the removal of developing autoreactive clones. We also show that CXCL4, a chemokine involved in systemic sclerosis (SSc), abrogates TLR9 function in B cells by sequestering TLR9 ligands away from the endosomal compartments where this receptor resides. The in vivo production of CXCL4 thereby impedes both TLR9 responses in B cells and the establishment of central B cell tolerance. We conclude that TLR9 plays an essential early tolerogenic function required for the establishment of central B cell tolerance and that correcting defective TLR9 function in B cells from SSc patients may represent a novel therapeutic strategy to restore B cell tolerance.


Conflict of interest statement

Disclosures: L.B. Ivashkiv reported “other” from Ono Pharmaceuticals outside the submitted work. E.L. Herzog reported grants from Bristol Myers, grants from Boehringer Ingelheim, personal fees from Boehringer Ingelheim, grants from the National Institutes of Health, and grants from DOD outside the submitted work. F.J. Barrat reported “other” from Ipinovyx Bio, personal fees from Boehringer Ingelheim, and personal fees from Astra Zeneca outside the submitted work; in addition, F.J. Barrat had a patent to PCT63/255,336 pending (Hospital for Special Surgery). No other disclosures were reported.

Figures

Figure 1.
Figure 1.
TLR9 is essential for central B cell tolerance. (A) Schematic diagram describing the generation of humanized mice. CD34+ HSCs transduced with GFP-tagged lentiviruses expressing MYD88, TLR7, or TLR9 shRNA were injected into the liver of 3-d-old recipient NSG mice. (B) Representative flow cytometry analysis showing the gating strategy to sort GFP and GFP+ CD19+ splenocytes from mice engrafted with HSCs transduced with the indicated GFP-tagged lentiviruses. (C) Expression analysis of indicated proteins in sorted GFP+ and GFP CD19+ splenocytes from humanized mice. β-actin is used for normalization of protein expression. White lines indicate that intervening lanes have been spliced out. (D) Representative surface CD69 expression in GFP (black line) compared with GFP+ (green line) CD19+ splenocytes after 48 h in culture unstimulated or activated with the indicated ligands or F(ab)′2 anti-IgM. (E) Representative polyreactivity of antibodies cloned from single new emigrant/transitional B cells isolated from indicated humanized mice was tested by ELISA against dsDNA, insulin, and LPS. Dotted red lines show the positive control. Pie charts represent the frequencies of reactive (solid) and non-reactive (open) clones, with the number of clones tested shown in the center. OD405 nm, optical density. (F and H) Frequencies of (F) polyreactive and (H) antinuclear reactive clones in new emigrant/transitional B cells. Each data point summarizes the reactivity data from an average of n = 21 cloned recombinant antibodies from control NSG (n = 7), MYD88 shRNA (n = 3), TLR7 shRNA (n = 2), and TLR9 shRNA (n = 3) humanized mice. Same control NSG mouse is used for representation in Fig. 2 D, Fig. 10 A, and Fig. S1 D. Averages are shown with a bar, and statistically significant differences are indicated (Student’s t test, *P < 0.05, **P < 0.01, ****P < 0.0001). (G) Representative nuclear staining patterns for antibodies cloned from new emigrant/transitional B cells. Scale bars, 25 µm. Please see Fig. S1. Source data are available for this figure: SourceData F1.
Figure S1.
Figure S1.
B cell–intrinsic expression of MYD88 and TLR9 but not TLR7 are required for the removal of developing autoreactive B cells in the BM. (A) Relative mRNA levels of TLR7 and TLR9 in GFP+ sorted CD19+ B cells compared with GFP counterparts isolated from BM and spleen of humanized mice transplanted with HSCs transduced with GFP-tagged lentiviruses expressing either TLR7 shRNA or TLR9 shRNA. (B) MYD88, full length (FL) and cleaved TLR7 and TLR9 protein expressions relative to β-actin in GFP (open bars) and GFP+ (green bars) sorted B cells from humanized mice engrafted with HSCs transduced with GFP-tagged lentiviruses expressing MYD88 shRNA (n = 3), TLR7 shRNA (n = 1), or TLR9 shRNA (n = 2). (C) Relative frequencies of CD69+cells in sorted GFP (open bars) and GFP+ (green bars) B cells isolated from NSG humanized mice transplanted with HSCs transduced with GFP-tagged lentiviruses expressing MYD88 shRNA (n = 4), TLR7 shRNA (n = 2), or TLR9 shRNA (n = 6) in GFP+ (green bars) after 48 h in culture with no stimulation (Unstim.) or activation with the indicated ligands or F(ab)′2 anti-IgM. Significant differences are indicated (Mann–Whitney U test, *P < 0.05, **P < 0.01, ***P < 0.001). (D) Antibodies cloned from single GFP and GFP+ new emigrant/transitional B cells isolated from NSG humanized mice engrafted with fetal HSCs transduced with GFP-tagged lentiviruses expressing MYD88 shRNA, TLR7 shRNA, or TLR9 shRNA were tested by ELISA for reactivity against dsDNA, insulin, and LPS. The same control NSG mouse is used for representation in Fig. 1 E, Fig. 2 D, and Fig. 10 A. Dotted red lines show the positive control. Antibodies were considered polyreactive when they recognized all three antigens. For each B cell fraction, the frequencies of polyreactive (filled area) and non-polyreactive (open area) clones are summarized in a pie chart below, with the total number of clones (n) tested indicated in the center. (E) Schematic diagram depicting the HCQ injection strategy. NSG humanized mice generated by fetal CD34+ HSCs engraftment are treated with daily intraperitoneal injections of 0.2 mg HCQ for a week. (F) Relative frequencies of CD69+ B cells from HCQ-treated NSG mice (black bars) compared with control humanized mice (open bars) after 48 h in culture with no stimulation (Unstim.) or activation with the indicated ligands or F(ab)′2 anti-IgM. (G) Representative polyreactivity of antibodies cloned from single new emigrant/transitional B cells isolated from HCQ-injected and control humanized mice were tested by ELISA against dsDNA, insulin, and LPS. Dotted red lines show the positive control. Pie charts represent the frequencies of reactive (solid) and nonreactive (open) clones, with the number of clones tested (n) shown in the center. OD405 nm, optical density. (H and I) Frequencies of polyreactive (H) and antinuclear reactive (I) clones in new emigrant/transitional B cells from the indicated humanized mice. Each data point summarizes the reactivity data from an average of n = 21 cloned recombinant antibodies from control (n = 7) and HCQ-injected NSG humanized mice (n = 2). (J) Representative nuclear staining patterns for antibodies cloned from new emigrant/transitional B cells from HCQ-injected NSG humanized mice. Scale bars, 25 µm. The average values are represented as bars and significant differences are indicated (Mann–Whitney U test, *P < 0.05, **P < 0.01, ****P < 0.0001).
Figure 2.
Figure 2.
Functional central B cell tolerance in TLR7-deficient patients. (A) The pedigrees of three families with TLR7-deficient patients and sequence electropherograms of respective TLR7 variants. Circles represent female family members; squares represent males. A slash symbol represents a deceased individual. Circled dot represents a TLR7 heterozygous carrier. (B) Representative flow cytometry histograms show CD69 expression on B cells isolated from an NSG humanized mouse engrafted with HSCs from controls or patient CIII.1 (TLR7 V771L) after 48 h in culture with no stimulation (gray shadow) or activation with the indicated ligands or F(ab)′2 anti-IgM (thick line). (C) CD69 induction following various stimulations is summarized in C and significant differences are indicated (Mann–Whitney U test, **P < 0.01). (D) Antibodies cloned from single new emigrant/transitional B cells isolated from the blood of three TLR7-deficient patients and control HDs or from NSG humanized mice engrafted with HSCs from controls or patient CIII.1 (TLR7 V771L) was tested by ELISA for reactivity against dsDNA, insulin, and LPS. Same control NSG mouse is used for representation in Fig. 1 E, Fig. 10 A, and Fig. S1 D. Dotted red lines show the positive control. Pie charts represent the frequencies of reactive (solid) and nonreactive (open) clones, with the number of clones tested (n) shown in the center. OD405 nm, optical density. (E and F) Summary for frequencies of polyreactive (E) and antinuclear reactive (F) clones in new emigrant/transitional B cells.
Figure 3.
Figure 3.
Defective TLR9 function in B cells from SSc patients. (A) Surface expression of CD69 and CD86 in CD20+CD27 gated naïve B cells from a representative HD and a patient with SSc after 48 h in culture with no stimulation (Unstim.) or activated with the indicated ligands or F(ab)′2 anti-IgM. Frequencies of single and double-positive populations are indicated. (B) Frequency summary of CD86+CD69+ B cells from HD (open circles) and patients with SSc (black circles) from the Yale identification cohort (n = 23) and UMCU replication cohort (n = 15). (C) IL-6, IL-10, and TNF concentrations measured by Luminex Assay in culture supernatants of B cells from HD (open circles) and patients with SSc (black circles, pooled cohorts). Average values are represented as bars and significant differences are indicated (Mann–Whitney U test, *P < 0.05, **P < 0.01). Please see Fig. S2.
Figure S2.
Figure S2.
Decreased TLR9 function in naïve B cells from patients with SSc. (A) Surface expression of TACI and CD25 in CD20+CD27 gated naïve B cells from a representative HD and a patient with SSc after 48 h in culture with no stimulation (Unstimulated) or activation with the indicated ligands or F(ab)′2 anti-IgM. The frequency of single and double positive populations is indicated. (B and C) Frequency summary of TACI+ (left) and CD25+ (right) B cells from HD (open circles) and patients with SSc (black circles) from (B) the Yale identification cohort (n = 23) and (C) UMCU replication cohort (n = 15). Average values are represented as bars and significant differences are indicated (Mann–Whitney U test, *P < 0.05, **P < 0.01, ***P < 0.001).
Figure 4.
Figure 4.
CXCL4 inhibits TLR9 responses in B cells. (A–D) Purified B cells from HDs were cultured with no stimulation (Unstim.), TLR7 ligand (R848, 0.75 µM) with or without CXCL4 (10 µg/ml; A and B), or TLR9 ligand (CpG1018, 0.15 µM) with or without CXCL4 (C and D). (A and C) CD69 (A, n = 8; and C, n = 11), or CD86 (A, n = 8; and C, n = 17) surface expression was quantified by flow cytometry. (B and D) Secreted IL-6 (B, n = 6; and D, n = 51) and TNF (n = 7) were quantified by ELISA or Luminex after 24 h of culture. (E) B cells from HDs were incubated for 48 h with medium (Unstim.), dual variable domain IgG, which displays both anti-human IgM and anti-dsDNA reactivities (DVD-IgTM 3764, 1 µg/ml) either alone or in the presence of either CXCL4 (10 µg/ml) or the TLR9 antagonist ODN INH-18 (inh18, 1 µg/ml). IL-6 and TNF secretion were quantified by immunoassay (ELISA). Individual donors are indicated, and all results are represented as a mean ± SEM, and statistical significance was evaluated using a Mann–Whitney U test and **P ≤ 0.01, ***P ≤ 0.001. (F–H) FACS-sorted B cells from HDs were cultured for 6 h with no stimulation (Unstim.), with CXCL4, CpG, or CpG + CXCL4 and analyzed by RNA-seq. (F) Principal component analysis of the differentially expressed genes. (G) Hierarchical clustering of log-transformed cpm for differentially expressed genes identified by RNA-seq analysis of RNA from B cells cultured as indicated. The highest and lowest modulated genes by CpG alone are indicated. (H) Volcano plot comparing gene expression in B cells cultured for 6 h with CXCL4 as compared to unstimulated (upper panel), CpG as compared to unstimulated (lower left panel), CXCL4 + CpG as compared to CpG (lower right panel). Colors on all graphs indicate differentially expressed genes in CpG as compared to unstimulated, where upregulated genes are indicated in red and downregulated genes in blue.
Figure S3.
Figure S3.
CXCL4 increases TLR9 ligand uptake but inhibits TLR9 function in B cells. (A–D) Purified B cells from HDs were cultured for 24 h with no stimulation (unstim.) or activated with (A and B) TLR7 agonist (R848, 0.75 µM) with or without CXCL4 (10 µg/ml), or (C and D) TLR9 agonist (CpG1018, 0.15 µM) with or without CXCL4. (A and C) CD83 surface expression (A, n = 8; and C, n = 19) were quantified by flow cytometry. (B and D) gene expression levels of IL6, IL10, or TNF were quantified by Q-PCR (B, n = 8; and D, n = 26–28). (E) Volcano plot comparing gene expression in B cells cultured for 6 h with CXCL4 as compared with unstimulated (upper panel), CpG as compared with unstimulated (middle panel), CXCL4 + CpG as compared to CpG (lower panel). Colors on all graphs indicate differentially expressed genes in CpG as compared to unstimulated, where upregulated genes are indicated in red and downregulated genes in blue. For A–D, individual donors are indicated, and all results are represented as the mean ± SEM and statistical significance evaluated using a Mann–Whitney U test and *P ≤ 0.05, **P ≤ 0.01, ***P ≤ 0.001. (F) B cells from HDs (n = 5–7) were incubated for 6 h with medium only or with TLR9-L CpG (0.15 µM) with or without CXCL4 (1, 3, and 10 µg/ml) and gene expression level of IL-10 was quantified by Q-PCR. (F) Secreted TNF was measured by ELISA after 48 h of culture of BJAB cells with medium only (Unstim.), or with TLR9 ligand (CpG1018, 0.15 µM) alone or with CXCL4. TNF secretion was normalized to TLR9-L stimulation. Results from five independent experiments are represented as mean ± SEM. Statistical significance was evaluated using a Mann–Whitney U test (**P ≤ 0.01). (G–I) Representative flow cytometry histograms show CpG uptake after 1 h of incubation of (G) purified B cells from HDs and of (H) BJAB B cells with medium only, or with fluorescent CpG (0.15 µM) with or without CXCL4 (I) CpG uptake data is represented as mean + SEM of total MFI in three independent experiments and statistical significance was evaluated using unpaired two-tailed t tests (*P ≤ 0.05).
Figure 5.
Figure 5.
Human CXCL4 inhibits TLR9 responses in B cells independently of CXCR3 and CCR1. (A–D) Dot plots represent Annexin V and propidium iodide (PI) staining on purified B cells from HDs (n = 5) that were cultured for 48 h with no stimulation (unstim.) or activated with TLR9L (CpG, 1 µg/ml) with or without CXCL4 (10 µg/ml), proportions of AnnexinVPI live, AnnexinV+PI apoptotic, and AnnexinV+PI+ dead cells are summarized in B–D. (E and F) CD69 induction on (E) CD19+CD10+ immature B cells isolated from the BM, or (F) CD19+CD10+ new emigrant/transitional B cells isolated from the spleen of control NSG humanized mice after 48 h in culture stimulated with TLR9 ligand (CpG, 1 µg/ml) with or without either CXCL4 (10 µg/ml, eleven experiments) or CXCL4 and CXCR3 antagonist (AMG-487, 30 µM, seven experiments). (G) Relative CD69 induction following TLR9 stimulation is summarized in G and significant differences are indicated (Mann–Whitney U test, *P < 0.05, ***P < 0.001). (H and I) B cells from HDs were cultured for 24 h unstimulated (unstim.) or activated with TLR9 ligand CpG (TLR9-L, 0.15 µM) with or without CXCL4 in the presence or not of an anti-CXCR3 antagonist mAb or CXCR3 antagonist AMG487. (H) Secreted IL-6 (n = 4) was quantified by ELISA and (I) CD69 and CD86 surface expression (n = 6) by flow cytometry. (J) Purified splenic B cells from C56Bl6/J (n = 11, left panel) and CXCR3-ko mice (n = 5, right panel) were cultured for 48 h unstimulated (unstim.) or activated with TLR9-L CpG-C274 (0.15 µM) with or without CXCL4. (K) B cells from HDs were cultured for 24 h unstimulated (unstim.), or activated with TLR9 ligand CpG (TLR9-L, 0.15 µM) with or without CXCL4 alone or in the presence of a CCR1 antagonist J113863. Secreted IL-6 and TNF (n = 6) were quantified by ELISA. Individual donors or mice are indicated, and all results are represented as the mean ± SEM and statistical significance evaluated using a Mann–Whitney U test and *P ≤ 0.05, **P ≤ 0.01, ***P ≤ 0.001 for G–K.
Figure 6.
Figure 6.
CXCL4 increases the uptake of TLR9 ligand. (A and B) Purified B cells from HDs were cultured for the indicated time with medium only, or with fluorescent CpG-AF488 (0.15 µM) with or without CXCL4 at (A) 10 µg/ml or (B) at the indicated concentration, and fluorescence was quantified by flow cytometry. Individual donors are indicated (n = 4–12) and mean + SEM of total MFI is shown. (C and D) B cells from HDs (n = 5–7) were incubated for 6 h with medium only or with TLR9-L CpG (0.15 µM) with or without CXCL4 (1, 3, and 10 µg/ml) and gene expression level of IL-6 and TNF was quantified by Q-PCR. (E) B cells from HDs (n = 2) were incubated with medium only, CpG-AF488 (0.15 µM) with or without CXCL4 at 37°C or 4°C, and fluorescence was quantified by flow cytometry. Data are represented as mean + SEM of total MFI. (F and G) B cells from HDs (n = 6) were cultured for 1 h (F) or 24 h (G) either unstimulated (unstim.) or activated with TLR9 ligand CpG alone or with either CXCL4 or CXCL4L1. (F) Fluorescence was quantified by flow cytometry and data is represented as mean + SEM of total MFI. Individual donors are indicated and statistical significance was evaluated using a Mann–Whitney U test and **P ≤ 0.01. (G) Secreted IL-6 was quantified by ELISA (n = 6). All results are represented as a mean ± SEM, and statistical significance was evaluated using a Mann–Whitney U test and *P ≤ 0.05, **P ≤ 0.01, ***P ≤ 0.001. (H) B cells from HDs (n = 6–9) were cultured for 1 h with medium only, with CpG-AF488 (0.15 µM) + CXCL4 with or without genistein, CPZ, or EIPA, and fluorescence was quantified by flow cytometry. Individual donors are indicated, and results are represented as a mean ± SEM and statistical significance was evaluated using a Mann–Whitney U test and *P ≤ 0.05, ***P ≤ 0.001. (I) B cells were cultured for 1 h with CpG-AF488 (0.5 µM) and CXCL4 either alone or with CPZ, stained with anti-CD20, and analyzed using Amnis imaging flow cytometer system. Image gallery, from left to right: showing bright field (BF) images, followed by B cell surface (stained with anti-CD20), uptaken CpG based on cells stained for AF488, merged images of CpG/CD20 showing absence of colocalization in CpG + CXCL4 group and the internalization score calculated by Amnis IDEAS software. Cells with a score of >0.3 were considered to have internalized CpG and those with a score of <0.3 were considered to have surface-bound CpG. Statistical significance was evaluated using a Chi-square test; ***P ≤ 0.001. Scale bars, 7 µm.
Figure 7.
Figure 7.
CXCL4 sequesters TLR9 ligands away from the late endosomal compartments. (A–C) Purified B cells from HDs were cultured for 1 h with the CpG-AF488 (5 µM) or with CpG-AF488 (0.5 µM) + CXCL4 (10 µg/ml) and analyzed by Amnis imaging flow cytometer system. (A) Cells in camera focus were selected from all events on the basis of gradient root mean square of the bright field image and (B) single cells were identified by plotting “Area” versus “Aspect ratio” in which events with higher “Aspect ratio” are likely to be single cells. (C) Image gallery, from left to right: showing bright field (BF) images, followed by B cell surface (stained by antiCD20), uptaken CpG based on cells stained for AF488, and merged images of CpG/CD20 showing absence of colocalization. (D) Representative histograms showing intensity of CpG-AF488 in CpG- (left panel) versus CpG-AF488+CXCL4 (right panel) incubated B cells. (E–J) B cells were cultured with the CpG-AF488 (5 µM) or with CpG-AF488 (0.5 µM) + CXCL4 for 1 h (E and F) or at the indicated time (G–J) and stained with anti-LAMP-2 (E and G–J) or LysoTracker (F) and analyzed using the Amnis imaging flow cytometer system. Image gallery, from left to right: showing bright field (BF) images, followed by uptaken TLR9-L CpG-AF488, LAMP-2+ compartments or lysosome (stained by LysoTracker), and merged images. Arrows indicate TLR9-L/LAMP-2 or TLR9-L/LysoTracker colocalization. The right panel shows the quantification of the correlation between the bright details of E CpG and LAMP2+ compartment or of F CpG and lysosome calculated by the BDS feature. The number of cells analyzed is indicated in brackets and statistical significance was evaluated using a Chi-square test and ***P ≤ 0.001. (C–J) Scale bars, 7 µm.
Figure 8.
Figure 8.
CXCL4 sequesters TLR9 ligand away from its receptor. (A–C) Human B cell line (BJAB) expressing TLR9-mCherry were cultured for 1 h with fluorescent CpG-FITC with or without CXCL4 and then stained with LysoTracker before analysis by confocal microscopy. (A and B) Panel shows z-stack projection of representative cells. Images show nucleus (blue), CpG (green), TLR9 (red), and LysoTracker/lysosomal compartment (purple) and merged images CpG/TLR9 and CpG/TLR9/LysoTracker without (A) or in the presence (B) of CXCL4. Scale bars, 0.7 and 1 µm as indicated. (C) Quantification of the colocalization of CpG and TLR9 (red), CpG and LysoTracker (blue), and TLR9 and LysoTracker (black) in cells cultured with or without CXCL4 as indicated. Results are represented as mean ± SD and statistical significance was evaluated using two-tailed unpaired Student's t test. **P ≤ 0.005, ***P ≤ 0.001.
Figure 9.
Figure 9.
In vivo CXCL4 expression specifically inhibits TLR9 responses in B cells. (A) Humanized mice were generated with CD34+ HSCs transfected with GFP-tagged lentiviruses expressing human CXCL4 and injected into the 3-d-old NSG mice. (B) Representative flow cytometry analysis of human CD3+ T cells and CD19+ B cells and GFP+ cell frequencies in the blood of three NSG humanized mice engrafted with fetal HSCs transduced with GFP-tagged lentiviruses expressing CXCL4. (C) Summary of GFP+CD3+ T cell and GFP+CD19+ B cell frequencies in the blood of NSG humanized mice transplanted with fetal HSCs transduced with GFP-tagged lentiviruses expressing CXCL4. (D) Human CXCL4 concentrations in cell culture supernatants of GFP (open diamonds) and GFP+ (green diamonds) B cells were determined by ELISA. (E) Human CXCL4 concentrations (ng/ml) in the sera of non-engrafted NSG mice (n = 7, open diamonds), NSG humanized mice transplanted with HSCs (n = 17, black diamonds), or HSCs transduced with GFP-tagged lentiviruses expressing CXCL4 (n = 7, green diamonds) were measured by ELISA. The mean is shown with a bar and significant differences are indicated (Mann–Whitney U test, ***P < 0.001, ****P < 0.0001). (F) Representative CD69 expression in GFP (black line) and GFP+ (green line) CD19+ cells from humanized mice after 48 h in culture with no stimulation (Unstimulated) or activated with the indicated ligands or F(ab)′2 anti-IgM. (G) Relative frequencies of CD69+ cells in sorted GFP+ (green circles) compared with GFP (open circles) B cells after 48 h in culture unstimulated (Unstim.) or activation with the indicated ligands or F(ab)′2 anti-IgM.
Figure 10.
Figure 10.
In vivo CXCL4 expression abrogates central B cell tolerance. (A) Representative polyreactivity of recombinant antibodies cloned from single GFP and GFP+ (expressing CXCL4) new emigrant/transitional B cells from humanized mice injected with CXCR3 antagonist (n = 2) or not (n = 3) was tested by ELISA against dsDNA, insulin, and LPS. The same control NSG mouse is used for representation in Fig. 1 E, Fig. 2 D, and Fig. S1 D. Dotted red lines show positive control. OD405, optical density. For each representative fraction, the frequencies of non-polyreactive (open area) and polyreactive (black area) are summarized in pie charts with the total number of clones tested shown in the center. (B and C) Polyreactivity (B) and antinuclear reactivity (C) frequencies in GFP+ (green diamonds) and GFP new emigrant/transitional B cells from the indicated humanized mice and control NSG humanized mice (empty diamonds) are summarized on the right. Mean values (with bars) and statistically significant differences are indicated (Student’s t test, *P < 0.05, ****P < 0.0001). (D) Representative nuclear staining patterns for antibodies cloned from new emigrant/transitional B cells. Scale bars, 25 µm. (E) Quantitative real-time PCR measures AICDA mRNA transcripts encoding AID in CD19+ BM B cell precursors from humanized mice after 48 h in culture with no stimulation (Unstim.) or activated with the indicated ligands (Student’s t test, *P < 0.05, **P < 0.01).

Comment in

References

    1. Ah Kioon, M.D., Tripodo C., Fernandez D., Kirou K.A., Spiera R.F., Crow M.K., Gordon J.K., and Barrat F.J.. 2018. Plasmacytoid dendritic cells promote systemic sclerosis with a key role for TLR8. Sci. Transl. Med. 10:eaam8458. 10.1126/scitranslmed.aam8458 - DOI - PMC - PubMed
    1. Asano, T., Boisson B., Onodi F., Matuozzo D., Moncada-Velez M., Maglorius Renkilaraj M.R.L., Zhang P., Meertens L., Bolze A., Materna M., et al. . 2021. X-linked recessive TLR7 deficiency in ∼1% of men under 60 years old with life-threatening COVID-19. Sci. Immunol. 6:eabl4348. 10.1126/sciimmunol.abl4348 - DOI - PMC - PubMed
    1. Cantaert, T., Schickel J.N., Bannock J.M., Ng Y.S., Massad C., Oe T., Wu R., Lavoie A., Walter J.E., Notarangelo L.D., et al. . 2015. Activation-induced cytidine deaminase expression in human B cell precursors is essential for central B cell tolerance. Immunity. 43:884–895. 10.1016/j.immuni.2015.10.002 - DOI - PMC - PubMed
    1. Chen, S., Zhou Y., Chen Y., and Gu J.. 2018. fastp: an ultra-fast all-in-one FASTQ preprocessor. Bioinformatics. 34:i884–i890. 10.1093/bioinformatics/bty560 - DOI - PMC - PubMed
    1. Christensen, S.R., Shupe J., Nickerson K., Kashgarian M., Flavell R.A., and Shlomchik M.J.. 2006. Toll-like receptor 7 and TLR9 dictate autoantibody specificity and have opposing inflammatory and regulatory roles in a murine model of lupus. Immunity. 25:417–428. 10.1016/j.immuni.2006.07.013 - DOI - PubMed

Publication types