. 2023 Dec 4;220(12):e20231235.
doi: 10.1084/jem.20231235. Epub 2023 Sep 29.

Epitope-engineered human hematopoietic stem cells are shielded from CD123-targeted immunotherapy

Affiliations

Epitope-engineered human hematopoietic stem cells are shielded from CD123-targeted immunotherapy

Romina Marone et al. J Exp Med. .

Abstract

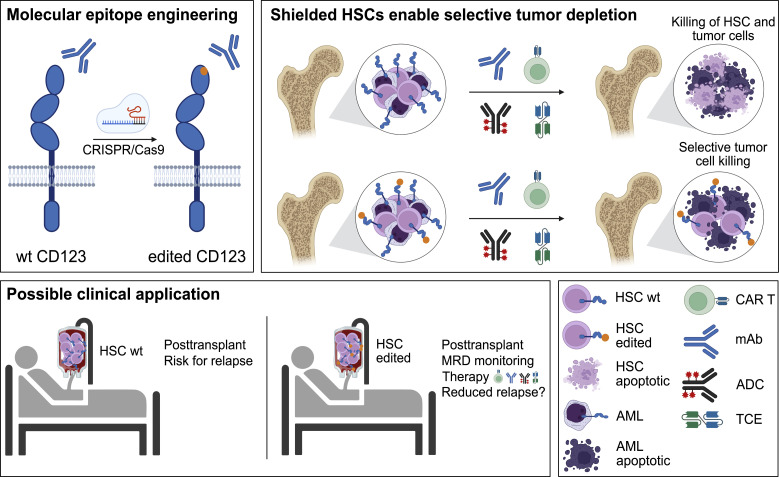
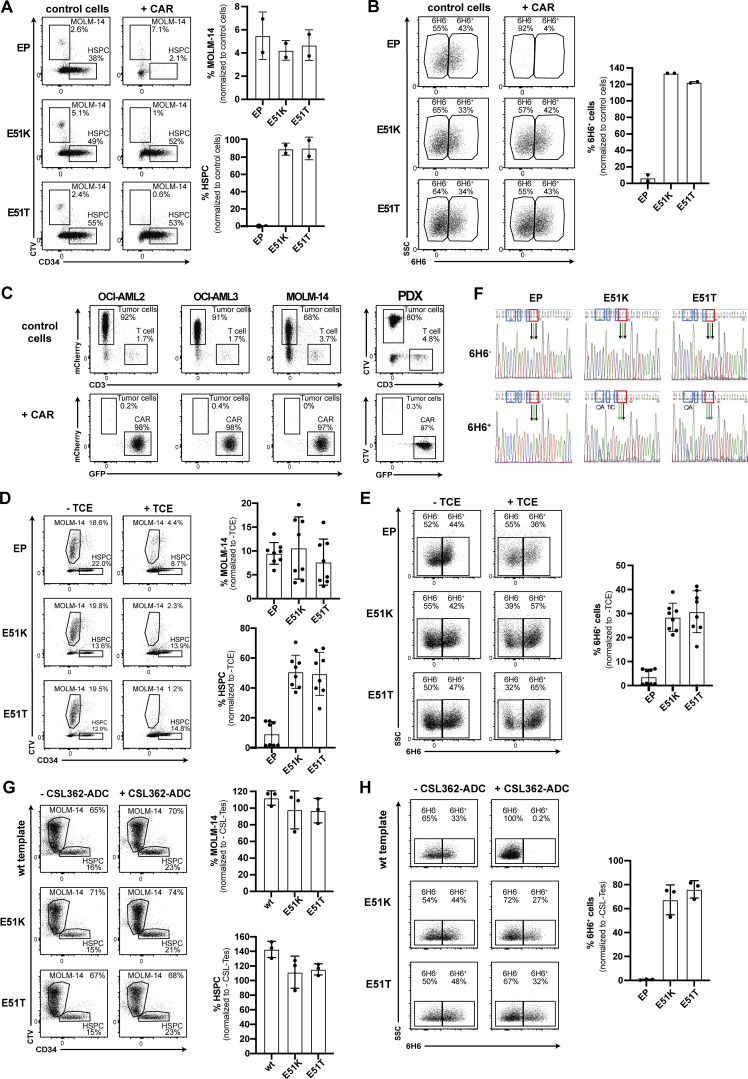
Targeted eradication of transformed or otherwise dysregulated cells using monoclonal antibodies (mAb), antibody-drug conjugates (ADC), T cell engagers (TCE), or chimeric antigen receptor (CAR) cells is very effective for hematologic diseases. Unlike the breakthrough progress achieved for B cell malignancies, there is a pressing need to find suitable antigens for myeloid malignancies. CD123, the interleukin-3 (IL-3) receptor alpha-chain, is highly expressed in various hematological malignancies, including acute myeloid leukemia (AML). However, shared CD123 expression on healthy hematopoietic stem and progenitor cells (HSPCs) bears the risk for myelotoxicity. We demonstrate that epitope-engineered HSPCs were shielded from CD123-targeted immunotherapy but remained functional, while CD123-deficient HSPCs displayed a competitive disadvantage. Transplantation of genome-edited HSPCs could enable tumor-selective targeted immunotherapy while rebuilding a fully functional hematopoietic system. We envision that this approach is broadly applicable to other targets and cells, could render hitherto undruggable targets accessible to immunotherapy, and will allow continued posttransplant therapy, for instance, to treat minimal residual disease (MRD).


Conflict of interest statement

Disclosures: R. Marone reported a patent to immunologically discernible cell variants for use in cell therapy licensed (Cimeio Therapeutics AG) and a patent to discernible cell surface protein variants for use in cell therapy licensed (Cimeio Therapeutics AG). E. Landmann reported a patent to WO2023/012367 licensed (Cimeio Therapeutics AG). A. Devaux reported a patent to WO2023/012367 pending (Cimeio Therapeutics AG). R. Lepore reported personal fees from Cimeio Therapeutics during the conduct of the study; in addition, R. Lepore had a patent to WO2018/083071 licensed (Cimeio Therapeutics AG) and a patent to WO2023/012367 licensed (Cimeio Therapeutics AG). F. Simonetta reported grants from Gilead, Novartis, and BMS/Cellgene; and “other” from Incyte, Janssen, AstraZeneca, and Neovii outside the submitted work. G. Andrieux reported a patent to US11319580B2 licensed. A. Wiederkehr reported “other” from Ridgeline discovery during the conduct of the study; in addition, A. Wiederkehr had a patent to WO2023/012367 pending (Cimeio Therapeutics). A. Sinopoli reported “other” from Ridgeline Discovery during the conduct of the study; in addition, A. Sinopoli had a patent to WO2023/012367 pending (Cimeio Therapeutics). V. Do Sacramento reported “other” from Cimeio Therapeutics during the conduct of the study. A. Haydn reported “other” from Ridgeline Discovery during the conduct of the study; in addition, A. Haydn had a patent to WO2023/012367 pending (Cimeio Therapeutics). L. Garcia-Prat reported “other” from Cimeio Therapeutics during the conduct of the study; in addition, L. Garcia-Prat had a patent to WO2023/012367 pending (Cimeio Therapeutics). A. Camus reported “other” from Cimeio Therapeutics during the conduct of the study; in addition, A. Camus had a patent to WO2023/012367 pending. L. Bordoli reported a patent to WO2018/083071 licensed (Cimeio Therapeutics AG). T. Schwede reported a patent to WO2018/083071 licensed (Cimeio Therapeutics AG). M. Porteus reported grants from Cimeio, “other” from CRISPR Tx, Allogene Tx, and Graphite Bio, and personal fees from Versant Ventures outside the submitted work. J.E. Corn reported grants from Cimeio Therapeutics outside the submitted workand is a cofounder and board member of Spotlight Therapeutics, an SAB member of Mission Therapeutics, Relation Therapeutics, Hornet Bio, and the Joint AstraZeneca-CRUK Functional Genomics Centre, and a consultant for Cimeio Therapeutics. The lab of J.E. Corn has funded collaborations with Allogene and Cimeio. J.E. Corn is supported by the NOMIS Foundation and the Lotte and Adolf Hotz-Sprenger Stiftung. T. Cathomen reported personal fees from Cimeio Therapeutics during the conduct of the study; personal fees from Excision Biotherapeutics, GenCC, and Novo Nordisk, and grants from Cellectis outside the submitted work; in addition, T. Cathomen had a patent to CAST-Seq issued. T.I. Cornu reported grants from Cimeio Therapeutics during the conduct of the study, and grants from Cellectis outside the submitted work. S. Urlinger reported “other” from Cimeio Therapeutics during the conduct of the study; in addition, S. Urlinger had a patent to WO2023/012367 pending (Cimeio Therapeutics). L.T. Jeker reported grants non-financial support from Cimeio Therapeutics AG during the conduct of the study; in addition, L.T. Jeker had a patent to WO2017/186718 licensed (Cimeio Therapeutics AG), a patent to WO2018/083071 licensed (Cimeio Therapeutics AG), and a patent to WO2023/012367 licensed (Cimeio Therapeutics AG); is a co-founder and board member of Cimeio Therapeutics AG, and holding equity in Cimeio Therapeutics AG. No other disclosures were reported.

Figures

None
Graphical abstract
Figure 1.
Figure 1.
Rational design of human CD123 protein variants to shield from targeted immunotherapy. (A) Crystal structure of the CD123-CSL362 complex in open conformation (PDB ID: 4JZJ). CD123 is shown as ribbons. The CSL362 antibody variable domain is shown as a white surface. CD123 amino acid residues involved in IL-3 binding are highlighted as lines and in light blue. (B) Per-residue relative solvent accessibility (RSA) computed on the CSL362-free (solid line) and CSL362-bound (dashed line) states based on the x-ray structure of the CD123–CSL362 complex (PDB ID: 4JZJ). RSA data are shown for the NTD. The CSL362 epitope region is highlighted in blue. (C) Amino acid residues at the interface of the CD123–CSL362 complex are highlighted as lines and sticks. Side chain–mediated intermolecular contacts are shown as dashed black lines. (D and E) The predicted ΔE mutational landscape of CD123 is shown as a heatmap for the full ECD (residue range 20–305, x axis; D) and selected amino acid positions: E51, S59, and R84 (E). Heatmap color ranges from yellow (ΔE < 0, predicted damaging) to blue (ΔE ≥ 0, predicted neutral or beneficial). (F) Selected amino acid variants at residues E51, S59, and R84 are sorted by decreasing ΔE values.
Figure 2.
Figure 2.
Preserved expression of engineered CD123 variants despite abolished binding to the mAb MIRG123. (A and B) Flow cytometry plots (A) and summarizing bar graph (B) showing binding of the anti-human CD123 antibody MIRG123 (biosimilar of CSL362) and the control clone 6H6 to wt CD123 and its 28 variants stably expressed in HEK-293 cells. Variants were categorized based on the dual staining to MIRG123 and 6H6 as non-binding (blue, <1% dual staining), weak (orange, 1–20%), or strong (red, >20%) binding variants. Control conditions (gray) are HEK-293 cells stably expressing wt CD123 (HEK-CD123) and non-transduced HEK-293 cells (HEK). Error bars: mean (SD). Data in A are representative of three independent experiments summarized in B.
Figure 3.
Figure 3.
Cells expressing engineered CD123 variants are shielded from multiple targeted immunotherapy modalities in vitro. (A) Schematic to assess shielding of CD123 expressing cells from three targeted immunotherapies (ADCC, TCE, CAR T cell) in vitro. (B) MIRG123-induced ADCC measured by the luminescence of the effector cell line Jurkat/FcγRIIIa/NFAT-Luc following co-culture with HEK, HEK-CD123, or the CD123 variants. The luminescence signal normalized to the culture with HEK-CD123 (top dashed line). Data of two independent experiments. (C–F) 3-d co-culture of effector T cells and HEK-293 expressing CD123 and its variants with and without CSL362/OKT3-TCE (TCE). Data represent five independent donors and experiments with two technical replicates per group. (C) Representative images after 3-d co-culture with HEK, HEK-CD123, or E51K with and without TCE. White arrows indicate cell clustering. Scale bar: 100 μm. (D) Specific TCE-mediated killing of HEK-293 cells or its variants. (E) Representative flow cytometry plots indicating CD69-expression in effector T cells without (top) and with (bottom) TCE after 3 d co-cultures with HEK, HEK-CD123, and the variant E51K. (F) Frequency of CD69-expressing CD3+ effector T cells after 3 d. (G–J) Human 123CAR T cells were co-cultured with the target cells HEK, HEK-CD123, or its variants for 24 h. Control T cells were electroporated with an HDRT, Cas9 protein but no gRNA. Data are from three independent donors, each with two technical replicates. (G) Representative microscopy images after 1 d with white arrows indicating cell clustering. Scale bar: 100 μm. (H) Specific killing of target cells measured by flow cytometry at day 1 of co-culture. (I and J) Representative FACS plots (I) and (J) summary of CD69+ 123CAR T cells either alone (effector T cells) or in the presence of HEK, HEK-CD123, or all CD123 variants after 24 h co-culture. The data are normalized to % CD69+ cells in the presence of HEK target cells. (B–J) Error bars: mean (SD).
Figure S1.
Figure S1.
TCE-mediated effector T cell activation. (A–D) 72 h co-culture of human effector T cells with HEK, HEK-CD123, and CD123 variants (effector-to-target ratio = 10:1) in the presence of the CSL362/OKT3-TCE (300 ng/ml). Percentage of CD69+ cells within total (A), gated CD4+ (B), and CD8+ (C) effector T cells with (purple) and without (gray) TCE. Data are from five independent donors and experiments with two technical replicates per group. (D) IFNγ secretion was measured by ELISA in co-culture supernatants after 72 h. (A–D) Data are from four blood donors and experiments with two technical replicates per group. Error bars: mean (SD).
Figure S2.
Figure S2.
123CAR design, production, and function. (A) Non-viral HDR-mediated integration of the CD123-specific second-generation CAR into Exon 1 of the TRAC locus using CRISPR/Cas9. (B) Representative microscopy image day 4 after EP showing GFP+ cells expressing the CAR-encoding template. Scale bar 100 μm. (C) Flow cytometry plots highlighting CAR insertion into the TRAC locus represented by fluorescent intensity of GFP with disrupted endogenous TCR expression in human CD4+ and CD8+ T cell subsets. (D) Mean ki efficiency of the CAR-encoding template in gated CD4+ and CD8+ T cells at day 4–5. Control indicates cells electroporated with the HDRT, but incomplete RNPs. Data are from four independent donors and experiments. (E) Sanger sequencing results (left: gel image; and right: sequencing) confirm correct HDRT integration at the TRAC locus in flow-sorted GFP+ CAR cells with primers annealing outside both arms of homology. (F–I) 123CAR T cells (purple) or control cells (gray) were co-cultured with HEK, HEK-CD123, or its variants at an effector-to-target ratio of 10:1 for 24 h. Summary of flow cytometry data indicates the percentage of CD69+ cells within total (F), gated CD4+ (G), or CD8+ (H) control (gray), or 123CAR (purple) T cells after 24 h co-culture. (I) Quantification of IFNγ in supernatants of 24 h co-cultures using ELISA. Error bars: mean (SD). Data are from three independent donors and experiments with two technical replicates per group. Source data are available for this figure: SourceData FS2.
Figure 4.
Figure 4.
Biophysical characterization of selected CD123 protein variants. (A) Binding of CSL362 to the recombinant ECD of CD123 wt (left) and CD123 E51T (right) at increasing concentrations of CSL362 measured by BLI. (B) Binding levels of CD123 wt and its variants at different concentrations to captured CSL362 at 280 s. CD123 wt reaches its saturation to CSL362 at 50 nM, therefore higher concentrations were not measured. (C) Binding levels of CD123 wt and its variants to the captured antibody 6H6 (normalized to a loading level of 6H6) at 250 s. (D) Binding levels of IL-3 to biotinylated CD123 wt and variants (normalized to loading levels of biotinylated CD123 wt and its variants) at 250 s. (E) Thermal unfolding (relative fluorescence unit, RFU) of CD123 wt and variants measured by DSF with increasing temperatures. (A–E) Representative data are from two experiments with two technical replicates.
Figure S3.
Figure S3.
TF-1 and HSPC epitope engineering. (A) Schematic of HDRTs design for insertion of variants K and T at position 51. (B and C) Engineered TF-1 cells were sorted based on the binding to the anti-CD123 mAbs 6H6 and MIRG123 (wt MIRG123+6H6+, KO MIRG1236H6, and ki MIRG1236H6+) and cultured for 3 d (B) with increasing concentrations of IL-3, or in C with 2.5 ng/ml IL-3 in the presence of increasing concentrations of MIRG123. Viable cells were quantified by luminescence and results were normalized to wt cells cultured with 50 ng/ml IL-3 (A) or to wt cells cultured without MIRG123 (B). Data are from four independent experiments. (D) Experimental design of non-viral CRISPR/Cas9-mediated HDR engineering of mobilized CD34+ enriched peripheral blood HSPCs using a GMP-compatible protocol with the CliniMACS Prodigy (Miltenyi). (E) Gating strategy to monitor CD123 expression in HSC (orange, CD34+CD38CD90+CD45RA), multipotent progenitor 1 (MPP1; blue; CD34+CD38CD90CD45RA), and MPP2 (green; CD34+CD38CD90CD45RA+) using the mAbs MIRG123 and 6H6 2 and 5 d after EP. wt: MIRG123+6H6+, KO: MIRG1236H6, ki: MIRG1236H6+ (F) Representative histogram of phosphorylated STAT5 upon exposure to IL-3 in AAV6-edited HSPCs. CCR5 KO was used as negative, and K-562 cells as positive control. Data represent two independent experiments. (G) In vitro differentiation of AAV6-edited HSPCs with and without IL-3. CFUs (erythroid: BFU-E & CFU-E, granulocytes/monocytes: CFU-G/GM, and myeloid progenitors: CFU-GEMM) were scored based on morphological characteristics. Data are from two independent experiments. Error bars: mean (SD).
Figure 5.
Figure 5.
HSPCs expressing CD123 variants E51K and E51T are functional, differentiate normally in vitro, and display a good safety profile. (A–M) Characterization of non-virally CRISPR/Cas9-edited human CD34+ HSPCs. (A) Representative flow cytometry plots showing binding (%) of the anti-human CD123 antibody clones 6H6 and MIRG123 to edited CD34+ HSPCs 5 d after EP. EP (cells electroporated with Cas9 protein only); KO RNP (EP with RNP only); wt, KO, E51K, and E51T variants (electroporated with respective HDRT). In flow cytometry, cells double-positive for MIRG123 and 6H6 were defined as "wt," whereas MIRG1236H6 are indicated as “KO” although they include intended CD123 KO cells as well as cells naturally not expressing CD123. The MIRG1236H6+ cell population is labeled as KI. Representative plots of five independent experiments each performed with different donors. (B) Frequency of ki cells (MIRG1236H6+) 2 and 5 d after EP. Data from eight individual donors (each a color) were performed in six independent experiments with two to four technical replicates. (C) Quantification of the ki population in LT-HSCs (CD34+CD38CD90+CD45RA), multipotent progenitor 1 (MPP1; CD34+CD38CD90CD45RA) and MPP2 (CD34+CD38CD90CD45RA+). (D) Representative Amplicon-NGS sequencing of the targeted CD123 locus at 2, 5, and 9 d after editing of control (EP), wt template, KO template, E51K, and E51T conditions. Data from four different experiments performed with different donors were pooled. (E) Representative FACS plots of CD123 stained with 6H6 and MIRG123 (left) and histograms of phosphorylated STAT5 (right) upon exposure to IL-3 in non-virally edited HSPCs. Color-coding in FACS plots and histogram is identical. Data are representative of four independent experiments. (F) In vitro differentiation of CD123-engineered HSPCs assessed by the number of colony-forming units (erythroid: E, myeloid: M). CFU were scored using STEMVision based on morphological characteristics. A representative experiment of two independent biological replicates performed in duplicates. (G) Allele frequency of the CD123-engineered HSPCs in a minimum of 38 colonies. (H) Frequency of GlyA+ and CD33+ non-virally edited HSPCs cultured in high cytokine medium with or without CSL362-ADC for 14 d. Myeloid lineage: CD33+, erythroid lineage: GlyA+. Data are from three experiments performed in triplicates. (I) Frequency of 6H6+ CD123-positive cells in the CD33+, CD14+, or CD15+ subsets. A representative experiment of two independent experiments performed in triplicates. (J) Computational off-target prediction. HBB and VEGFA site 2 as benchmarking gRNAs. On-target (OnT), off-target (OT1-6). (K) DISCOVER-Seq in KO RNP edited HSPCs. On-target (OnT), off-target (OT7-17). (L) rhAMPSeq validation of computational prediction and DISCOVER-Seq analysis. Shown are the editing rates as percentage of indels detected at the on-target (OnT) site and at the 17 off-target (OT) sites. Blue circles: Edited category comprises samples treated with gRNA for CD123 (KO RNP, KO template, E51K, and E51T). Red triangles: Unedited category comprises samples not treated with gRNA for CD123 (HSC, EP). Data are from one experiment performed with six samples generated in six independent editing experiments with cells from different donors. (M) CAST-Seq in unedited (left) and KO RNP edited HSPCs (center). Coverage plots of the on-target site in CD123 indicate large inversions (pink line) and deletions (orange line), respectively. Circos plot is used to illustrate chromosomal translocations. Data are from one experiment performed with two independent samples. Error bars: mean (SD).
Figure 6.
Figure 6.
CD123 epitopeengineered HSPCs engraft, differentiate normally, and possess long-term reconstitution potential in vivo. (A–F) In vivo engraftment and differentiation potential of non-virally engineered HSPCs expressing E51K and E51T variants measured 16 wk after injection in NBSGW mice. (A) Human chimerism (% hCD45+) in bone marrow. (B) Proportion (left) and absolute number (right) of CD34+CD38CD90+CD45RA HSCs in the bone marrow. (C) Multilineage differentiation in the spleen. Proportion of various differentiated cell subsets (CD19+, CD33+, CD13+, Nkp46+, CD3+, CD14+, pDCs) among human CD45+ cells are shown. (D) Proportion of wt CD123 (MIRG123+6H6+; left) and CD123 ki (MIRG1236H6+; right) within human CD45+ cells in the bone marrow. (E) Representative dot plot of pDCs stained with MIRG123 and 6H6 in spleen. Gating strategy to identify pDCs depicted in Fig. S4. (F) Proportion (left) and absolute number (right) of pDCs. (G–J) Secondary transplant into NSG-SGM3 mice. Engraftment and differentiation were assessed 8 wk after the bone marrow transplant. (G) Human chimerism (% hCD45+) in bone marrow. (H) Relative fraction (left) and absolute number (right) of CD34+CD38CD90+CD45RA HSCs in the bone marrow. (I) Multilineage differentiation in spleen. (J) Percentage of wt CD123 (MIRG123+6H6+; left) or edited CD123 ki (MIRG1236H6+; right) among human CD45+ cells in bone marrow. (A–J) Error bars: mean (SD). (A–F) Data represent one out of three independent experiments, each performed with five to eight mice per group. (G–J) Data are from one experiment with five to eight mice per group.
Figure S4.
Figure S4.
Normal engraftment and differentiation of CD123-edited HSPCs. (A) Human chimerism (% hCD45+) in blood. Data of a representative experiment performed with five to eight mice per group of three independent experiments. (B) Gating strategy to identify pDCs in the spleen 16 wk after injection of edited HSPCs in NBSGW mice. Error bars: mean (SD).
Figure 7.
Figure 7.
Engineered HSPCs enable tumor-selective CD123 immunotherapy. (A–D) Non-virally edited HSPCs co-cultured with MOLM-14-mCherry (AML cells) and control T cells (control cells) or 123CAR (+CAR) for 2 d. (A) Representative dot plots indicating proportion (%) of CD3+ T cells (control cells and CAR, respectively), MOLM-14 cells, and non-virally edited CD34+ HSPCs on day 2 of co-culture. (B) The proportion of HSPCs based on absolute counts from A normalized to the number of control T cells. (C) FACS plots illustrating the proportion (%) of wt or ki HSPCs at the end of the co-culture based on the binding characteristics to the mAb 6H6. Only clone 6H6 was used to avoid epitope masking by the 123CAR. (D) Fraction of 6H6+ cells based on absolute numbers from C relative to co-culture with control T cells. (E–H) Non-virally edited HSPCs co-cultured with PDX (CTV labeled) and control T cells or 123CAR for 2 d. (E) Representative dot plot indicating proportion (%) of CD3+ T cells, PDX-derived cells, and non-virally edited CD34+ HSPCs on day 2 of co-culture. (F) Quantification of HSPCs based on absolute counts from E. (G) Representative FACS data indicating the fraction (%) of wt or ki HSPCs based on the binding to the mAb clone 6H6 at the end of the co-culture. (H) Quantification of 6H6+ cells using absolute cell numbers from G relative to the co-culture with control T cells. (A–H) Error bars: mean (SD). (A–D) Data are from one out of two independent experiments, each performed in triplicate. (E–H) Data of one experiment performed in triplicate.
Figure S5.
Figure S5.
Engineered HSPCs enable tumor-selective CD123 immunotherapy. (A and B) Non-virally edited HSPCs co-cultured with MOLM-14 (CTV-labeled) and control T cells or 123CAR for 3 d. EP are electroporated but non-edited HSPCs. (A) Representative dot plots indicating MOLM-14 cells and non-virally edited CD34+ HSPCs on day 3 of co-culture (left) and the proportion thereof quantified using absolute cell numbers relative to control T cells (right). (B) FACS plots illustrating wt or ki HSPCs by their binding to the mAb 6H6 at the end of the co-culture (left), and proportion of 6H6+ cells based on absolute counts. (A and B) Data of one out of two independent experiments performed in triplicate. (C) 2-d co-culture of AML cells MOLM-14-mCherry, OCI-AML2-mCherry, OCI-AML3-mCherry, and PDX (CTV-labeled) with control T cells or 123CAR. Data of one experiment performed in triplicate. (D and E) Non-virally edited HSPCs co-cultured with MOLM-14 (CTV-labeled) and autologous T cells with or without CSL362/OKT3-TCE (100 ng/ml) for 3 d. Control conditions (EP) are electroporated but non-edited HSPCs. (D) Representative dot plot (left) and proportion (right) of MOLM14 cells and CD34+ HSPCs in different conditions on day 3 of co-culture with or without TCE. Representative data are from one out of three independent experiments with two different donors performed in triplicate. (E) FACS plot (left) and percentage (right) of edited HSPCs (6H6+ cells) at the end of the co-culture with or without TCE. One of two independent experiments, each performed in triplicate, are shown. (F) Sanger sequencing chromatogram of FACS-sorted 6H6+ and 6H6 HSPCs on day 3 of co-culture with autologous T cells and CSL362/OKT3-TCE. Blue boxes: silent mutations; red boxes: E51K and E51T amino acid substitutions. Data are from one experiment. (G and H) Non-virally edited HSPCs co-cultured with MOLM-14 (CTV-labeled) with or without CSL362-ADC (10 nM) for 3 d. EP are electroporated but genetically not modified HSPCs. (G) Representative dot plot (left) and fraction (right) of MOLM14 cells and CD34+ HSPCs in different conditions on day 3 of co-culture with CSL362-ADC. Representative data are from one out of three independent experiments with two individual donors were performed in triplicate. (H) Flow cytometry data (left) and summary (right) showing the percentage of edited 6H6+ HSPCs at the end of the co-culture. Data are from one out of three individual experiments performed in triplicate. Error bars: mean (SD).

Comment in

References

    1. Anzalone, A.V., Koblan L.W., and Liu D.R.. 2020. Genome editing with CRISPR-Cas nucleases, base editors, transposases and prime editors. Nat. Biotechnol. 38:824–844. 10.1038/s41587-020-0561-9 - DOI - PubMed
    1. Arai, Y., Choi U., Corsino C.I., Koontz S.M., Tajima M., Sweeney C.L., Black M.A., Feldman S.A., Dinauer M.C., and Malech H.L.. 2018. Myeloid conditioning with c-kit-Targeted CAR-T cells enables donor stem cell engraftment. Mol. Ther. 26:1181–1197. 10.1016/j.ymthe.2018.03.003 - DOI - PMC - PubMed
    1. Asano, T., Boisson B., Onodi F., Matuozzo D., Moncada-Velez M., Maglorius Renkilaraj M.R.L., Zhang P., Meertens L., Bolze A., Materna M., et al. . 2021. X-linked recessive TLR7 deficiency in ∼1% of men under 60 years old with life-threatening COVID-19. Sci. Immunol. 6:eabl4348. 10.1126/sciimmunol.abl4348 - DOI - PMC - PubMed
    1. Bae, S., Park J., and Kim J.S.. 2014. Cas-OFFinder: A fast and versatile algorithm that searches for potential off-target sites of Cas9 RNA-guided endonucleases. Bioinformatics. 30:1473–1475. 10.1093/bioinformatics/btu048 - DOI - PMC - PubMed
    1. Baroni, M.L., Sanchez Martinez D., Gutierrez Aguera F., Roca Ho H., Castella M., Zanetti S.R., Velasco Hernandez T., Diaz de la Guardia R., Castano J., Anguita E., et al. . 2020. 41BB-based and CD28-based CD123-redirected T-cells ablate human normal hematopoiesis in vivo. J. Immunother. Cancer. 8:e000845. 10.1136/jitc-2020-000845 - DOI - PMC - PubMed

Publication types

MeSH terms

Substances