. 2023 Sep 29;14(1):6099.
doi: 10.1038/s41467-023-41849-8.

TMEM135 links peroxisomes to the regulation of brown fat mitochondrial fission and energy homeostasis

Affiliations

TMEM135 links peroxisomes to the regulation of brown fat mitochondrial fission and energy homeostasis

Donghua Hu et al. Nat Commun. .

Abstract

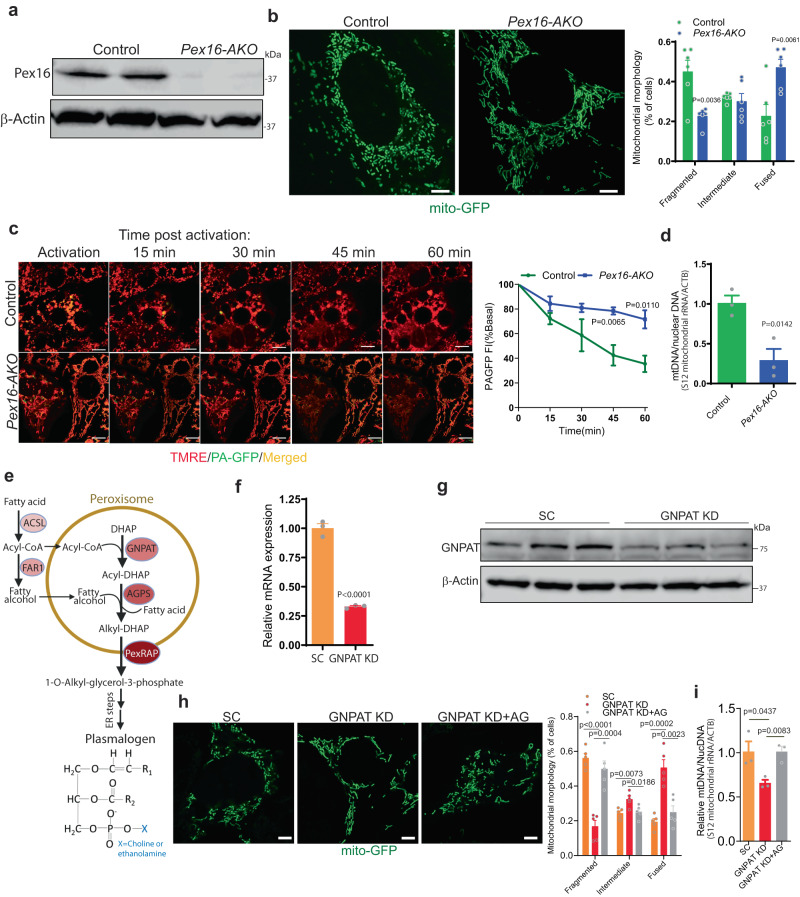
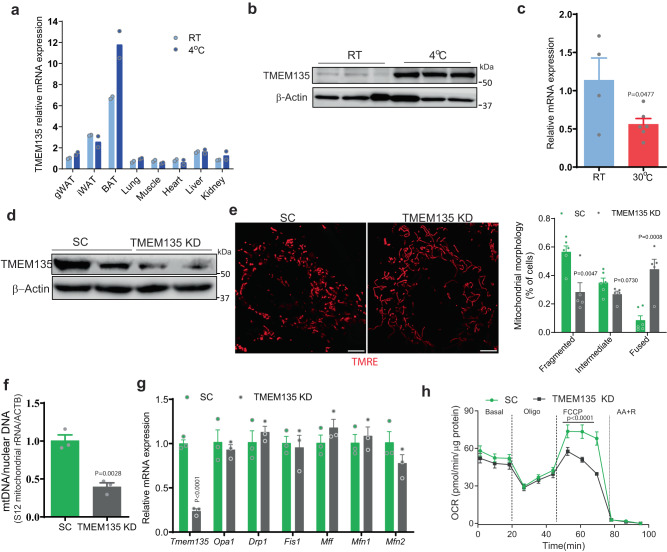
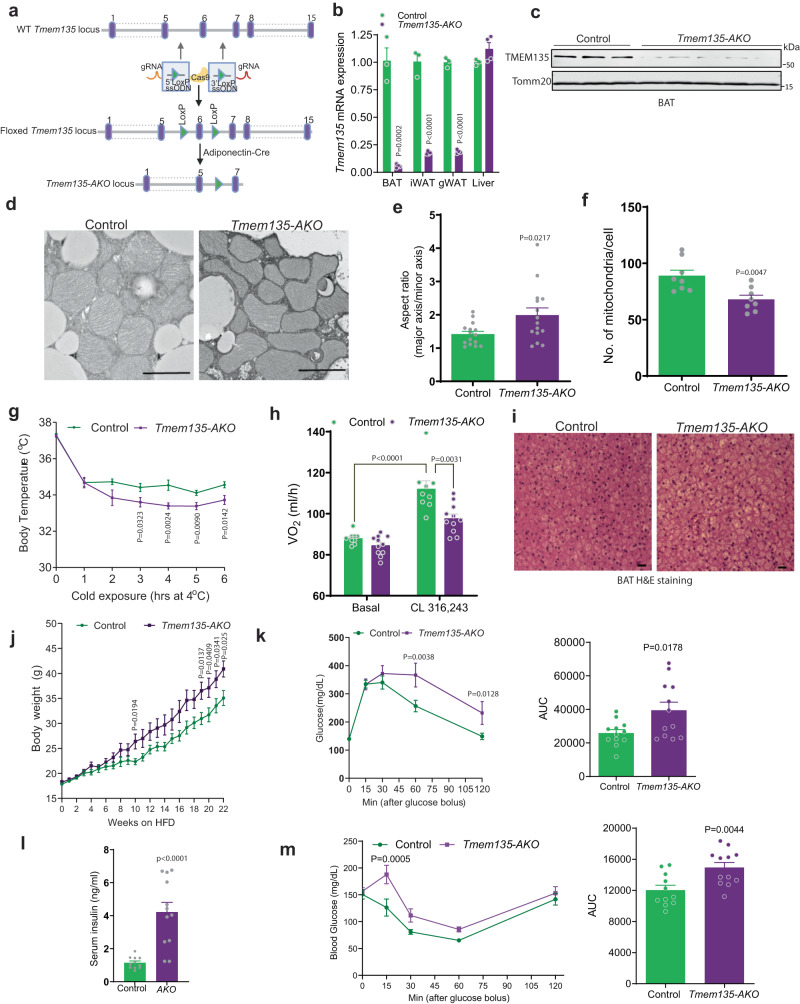
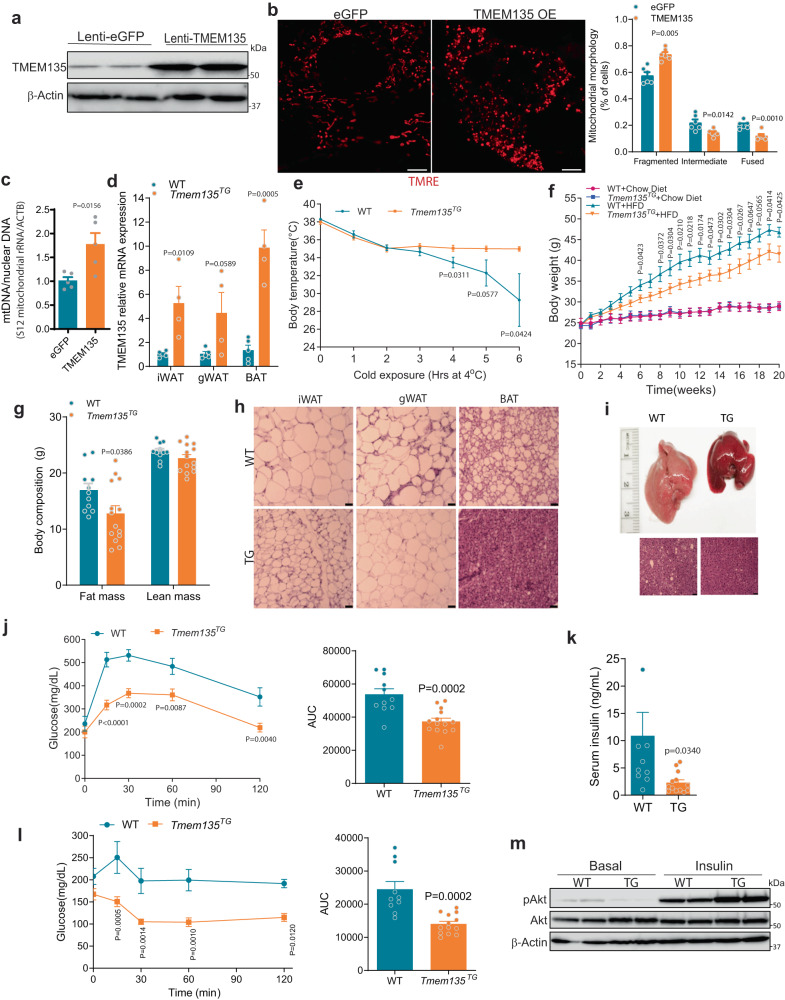
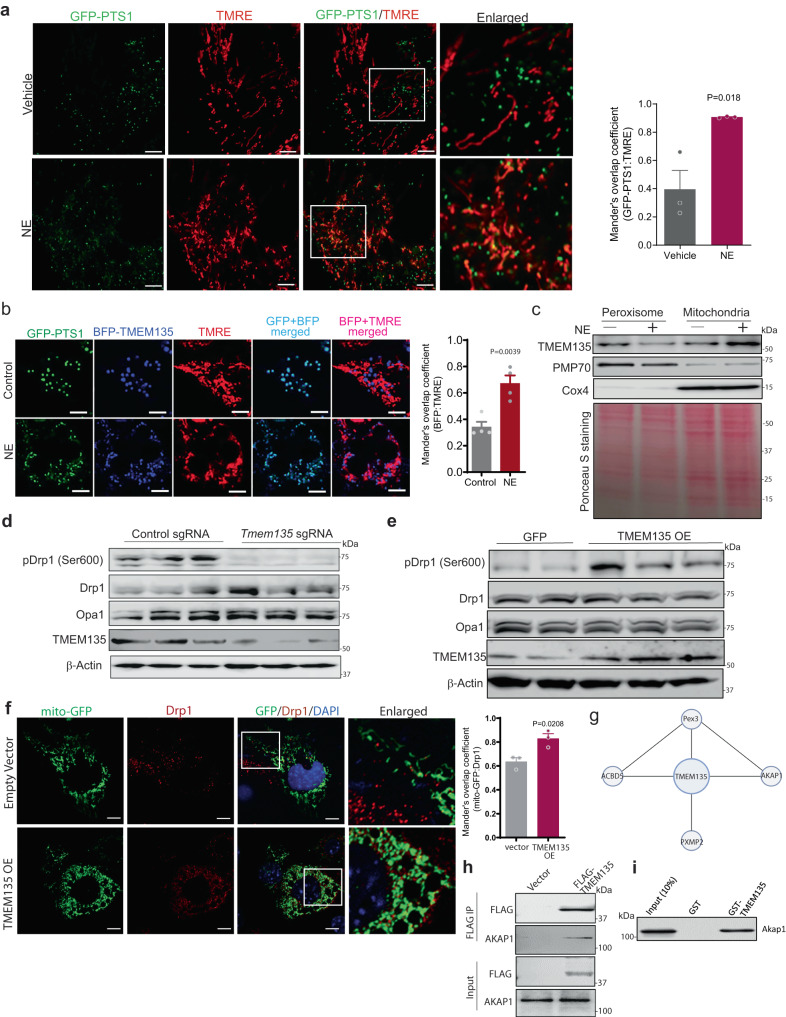
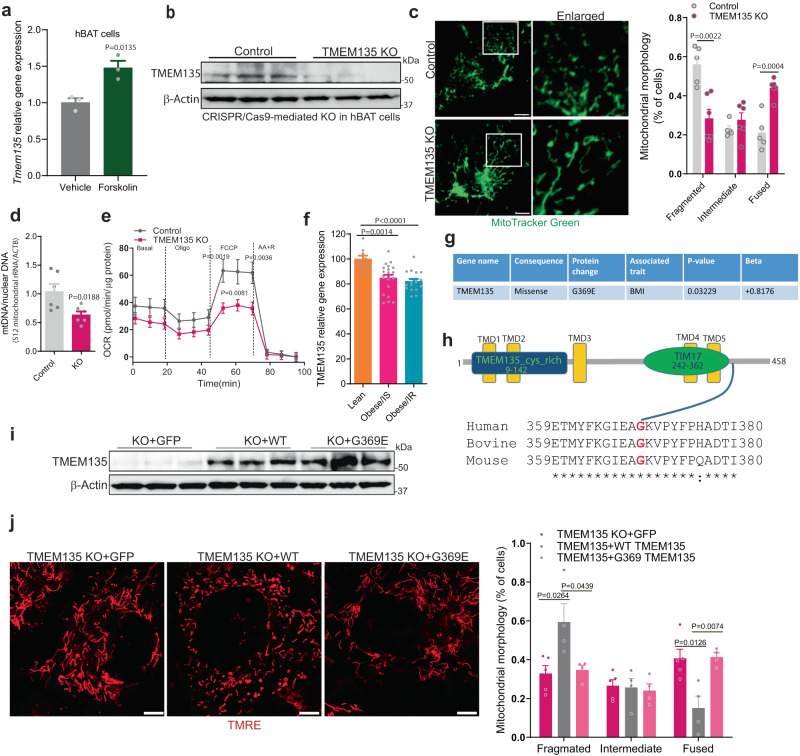
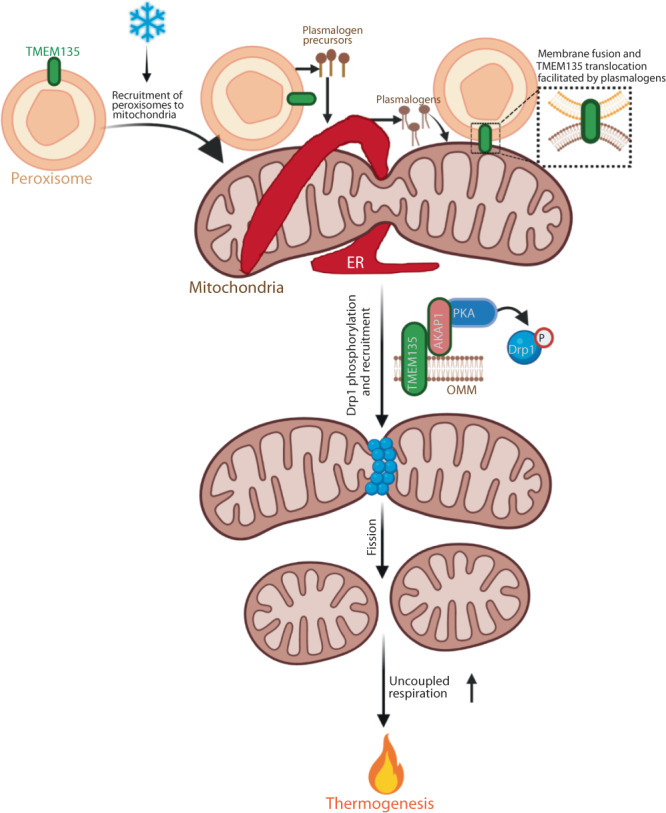
Mitochondrial morphology, which is controlled by mitochondrial fission and fusion, is an important regulator of the thermogenic capacity of brown adipocytes. Adipose-specific peroxisome deficiency impairs thermogenesis by inhibiting cold-induced mitochondrial fission due to decreased mitochondrial membrane content of the peroxisome-derived lipids called plasmalogens. Here, we identify TMEM135 as a critical mediator of the peroxisomal regulation of mitochondrial fission and thermogenesis. Adipose-specific TMEM135 knockout in mice blocks mitochondrial fission, impairs thermogenesis, and increases diet-induced obesity and insulin resistance. Conversely, TMEM135 overexpression promotes mitochondrial division, counteracts obesity and insulin resistance, and rescues thermogenesis in peroxisome-deficient mice. Mechanistically, thermogenic stimuli promote association between peroxisomes and mitochondria and plasmalogen-dependent localization of TMEM135 in mitochondria, where it mediates PKA-dependent phosphorylation and mitochondrial retention of the fission factor Drp1. Together, these results reveal a previously unrecognized inter-organelle communication regulating mitochondrial fission and energy homeostasis and identify TMEM135 as a potential target for therapeutic activation of BAT.


Conflict of interest statement

The authors declare no competing interests.

Figures

Fig. 1
Fig. 1. Brown adipocyte peroxisome deficiency results in tubular mitochondrial networks through impaired mitochondrial fission, which could be rescued by peroxisome-derived lipids.
a Western blot analysis following differentiation of brown pre-adipocytes isolated from control (Pex16lox/lox) and Pex16-AKO (Pex16lox/lox; adipo-Cre+/-) mice. The blots are representative of three independent experiments. b Mitochondrial morphology of differentiated brown pre-adipocytes from control (n = 6) and Pex16-AKO (n = 6) mice stably expressing mito-GFP. Mitochondrial morphology was quantified using ImageJ. Scale bar: 5 μm. c Mitochondrial fusion assay in differentiated brown pre-adipocytes from control and Pex16-AKO mice transduced with lentivirus encoding mt-PAGFP, followed by confocal microscopy; control: n = 4; Pex16-AKO: n = 4. Mitochondrial morphology was quantified using ImageJ. Scale bar: 5 μm. d mtDNA copy number normalized to nuclear DNA of brown adipocytes from control (n = 3) and Pex16-AKO (n = 3) mice measured by qPCR. e Plasmalogen synthetic pathway. The initial steps for synthesis of plasmalogens take place in peroxisomes, generating 1-O-alkyl-glycerol-3-phosphate, a precursor for plasmalogens synthesized in the ER. Plasmalogen structure is shown. ACSL acyl-CoA synthetase, AGPS alkylglycerone phosphate synthase, DHAP dihydroxyacetone phosphate, FAR1 fatty acyl-CoA reductase, GNPAT glyceronephosphate O-acyltransferase, PexRAP Peroxisomal Reductase activating PPARγ. f, g qPCR and Western blot analysis of GNPAT expression in brown adipocytes treated with scrambled (SC; n = 3) or GNPAT shRNA (n = 3). h Mitochondrial morphology of brown adipocytes expressing Mito-GFP treated with scrambled (SC) shRNA (n = 5), GNPAT shRNA (n = 5) or GNPAT shRNA with alkylglycerol (AG; n = 5). Mitochondrial morphology was quantified using ImageJ. Scale bar: 5 μm. i mtDNA copy number normalized to nuclear DNA of brown adipocytes treated with scrambled (SC) shRNA (n = 3), GNPAT shRNA (n = 3) or GNPAT shRNA with AG (n = 3). Data are presented as mean ± SEM; statistical significance was determined by two-tailed unpaired Student’s t test (b, c, d, f, h, i).
Fig. 2
Fig. 2. TMEM135 is the most decreased protein in mitochondria of peroxisome-deficient BAT and its mitochondrial localization is mediated by peroxisome-derived lipids.
a Schematic diagram of proteomic analysis in mitochondria isolated from BAT of cold-treated Pex16-AKO and control mice. Created with BioRender.com. b, c Heat map and volcano plot analysis of mitochondrial proteomics in BAT of Pex16-AKO and control mice; n = 5/group. d, e qPCR and Western blot analysis of TMEM135 in BAT of control and Pex16-AKO mice after cold exposure; control: n = 9; Pex16-AKO: n = 10. f Immunofluorescence analysis in control and Pex16-AKO brown adipocytes expressing mito-GFP stained with an antibody against TMEM135. Colocalization was quantified using ImageJ. Quantification was performed with the investigator blinded to the identity of the samples. Scale bar: 10 μm. The images are representative of four independent experiments and the quantification is based on a total of 54 control and 64 Pex16-AKO cells. g qPCR analysis of Gnpat and Tmem135 in differentiated BAT SVF cells treated with lentivirus-encoding scrambled (SC) shRNA (n = 3), GNPAT shRNA (n = 3) or GNPAT shRNA plus AG (n = 3). h Immunofluorescence analysis using an antibody against TMEM135 in the brown adipocytes expressing Mito-GFP treated with lentivirus-encoding scrambled (SC), GNPAT shRNA or GNPAT shRNA plus AG. Colocalization was quantified using ImageJ. Scale bar: 10 μm. The images are representative of three independent experiments and the quantification is based on a total of 10 cells per group. Data are presented as mean ± SEM; statistical significance was determined by two-tailed unpaired Student’s t test (d, fh). Comparisons between groups were made with a two-tailed unpaired Student’s t-test adjusted for multiple comparisons using the Benjamini-Hochberg method (c).
Fig. 3
Fig. 3. TMEM135 expression is regulated by thermogenic stimuli and its knockdown impairs mitochondrial fission and respiration in brown adipocytes.
a qPCR analysis of Tmem135 expression in major tissues of wild-type C57BL/6 J mice maintained at room temperature or subjected to cold treatment for 7 days; n = 2/condition. b Western blot analysis of TMEM135 protein levels in BAT of wild-type C57BL/6J mice kept at room temperature or cold treated for 7 days. Each lane represents a separate mouse; n = 3. c qPCR analysis of Tmem135 in BAT of wild-type C57BL/6J mice kept at room temperature (RT) or thermoneutrality (30 oC) for 12 days; RT: n = 4; 30 oC: n = 6. d Western blot analysis of TMEM135 protein levels in brown adipocytes treated with scrambled (SC) or TMEM135 shRNA. e Mitochondrial morphology analysis using confocal microscopy in TMRE-stained brown adipocytes treated with scrambled (SC) (n = 6) or TMEM135 shRNA (n = 5). Plot shows quantification of mitochondrial morphology. Scale bar: 5 μm. f mtDNA copy number normalized to nuclear DNA of brown adipocytes treated with scrambled (SC) (n = 3) or TMEM135 shRNA (n = 3). g qPCR analysis of mitochondrial dynamics genes in brown adipocytes treated with scrambled (SC) (n = 3) or TMEM135 shRNA (n = 3). h OCR measured in brown adipocytes treated with scrambled (SC) (n = 5) or TMEM135 shRNA (n = 3) using a Seahorse XF24 Extracellular Flux Analyzer. Oligo oligomycin, FCCP carbonyl cyanide-p-trifluoromethoxyphenylhydrazone, AA + R, mixture of antimycin A and rotenone. Data are presented as mean ± SEM; statistical significance was determined by two-tailed unpaired Student’s t test (c, eg) or 2-way ANOVA with Bonferroni’s post hoc test (h).
Fig. 4
Fig. 4. Adipose-specific knockout of TMEM135 impairs mitochondrial fission and thermogenesis and promotes diet-induced obesity and insulin resistance.
a Gene targeting strategy using CRISPR/Cas9 to insert LoxP sites into the Tmem135 locus. The floxed mice were crossed with an adiponectin-Cre mouse to generate Tmem135-AKO mice. b qPCR analysis of Tmem135 expression in adipose tissue and liver of control (n = 3) and Tmem135-AKO (n = 4) mice. c Western blot analysis of TMEM135 in brown adipose tissue of control (n = 3) and Tmem135-AKO (n = 5) mice. d TEM analysis of BAT from control and Tmem135-AKO mice subjected to 7 day cold exposure. Scale bar: 1 μm. e Aspect ratio (ratio of major axis length to minor axis length) measured in BAT mitochondria. The data are based on 15 mitochondria per condition. f Number of mitochondria per cell based on TEM images of BAT taken at ×1000–×2000 magnification. Data are the average of 8 cells per condition. g Body temperature of Tmem135-AKO (n = 10) and control (n = 9) female mice subjected to a 6-h cold challenge. (h) VO2 of Tmem135-AKO (n = 11) and control (n = 9) mice treated with β3-adrenergic agonist CL-316,243 injection. i H&E staining of BAT from Tmem135-AKO and control mice subjected to cold exposure. The images are representative of 3 mice per genotype. Scale bar: 50 μm. j Body weight of HFD-fed Tmem135-AKO and control female mice; n = 12/group. k Glucose tolerance test and area under the curve (AUC) of HFD-fed TMEM135-AKO and control female mice; n = 12/group. l Fasting serum insulin level of HFD-fed Tmem135-AKO (n = 12) and control (n = 11) female mice. m Insulin tolerance test and AUC of HFD-fed Tmem135-AKO (n = 12) and control (n = 11) female mice. Data are presented as mean ± SEM; statistical significance was determined by two-tailed unpaired Student’s t test (b, eh, jm) or 2-way ANOVA with Bonferroni’s post hoc test (k, m).
Fig. 5
Fig. 5. TMEM135 overexpression increases mitochondrial fission and thermogenesis, decreases diet-induced obesity, and promotes insulin sensitivity.
a Western blot analysis of TMEM135 protein levels in brown adipocytes transduced with lentivirus expressing GFP or TMEM135. The blots are representative of three independent experiments. b Mitochondrial morphology analysis using confocal microscopy in TMRE-stained of brown adipocytes expressing GFP (n = 6) or TMEM135 (n = 6). Plot shows quantification of mitochondrial morphology. Scale bar: 5 μm. c mtDNA copy number normalized to nuclear DNA of brown adipocytes expressing GFP (n = 5) or TMEM135 (n = 5). d qPCR analysis of Tmem135 in various adipose depots of Tmem135TG (n = 4) and WT (n = 5) mice. e Body temperature of Tmem135TG (n = 7) and WT (n = 5) mice kept in warm room (30 oC) for 12 days and then subjected to a 6-h cold challenge. f Body weight of chow diet or HFD-fed Tmem135TG and WT male mice; chow diet (WT: n = 5; Tmem135TG: n = 5) and HFD (WT: n = 11; Tmem135TG: n = 14). g EchoMRI analysis of body composition in HFD-fed Tmem135TG (n = 14) and WT (n = 11) male mice. h H&E staining of adipose tissue depots in HFD-fed Tmem135TG and WT mice. Scale bar: 50 μm. The images are representative results of three independent experiments. i Gross images and H&E staining of liver in HFD-fed Tmem135TG and WT male mice. Scale bar: 50 μm. The images are representative of three mice per group. j Glucose tolerance testing and AUC in HFD-fed Tmem135TG (n = 14) and WT (n = 11) male mice. k Fasting serum insulin level of HFD-fed Tmem135TG (n = 13) and WT (n = 10) male mice. l Insulin tolerance testing and AUC in HFD-fed Tmem135TG (n = 13) and WT (n = 10) male mice. m Western blot analysis of AKT phosphorylation in livers of HFD-fed Tmem135TG and WT mice collected at 10 min following insulin injection. Each lane represents a separate mouse. Two independent experiments yielded similar results. Data are presented as mean ± SEM; statistical significance was determined by two-tailed unpaired Student’s t test (bg, k) or 2-way ANOVA with Bonferroni’s post hoc test (j, l).
Fig. 6
Fig. 6. TMEM135 translocates from peroxisomes to mitochondria in response to acute β-adrenergic stimulation and interacts with AKAP1 to mediate PKA-dependent phosphorylation of Drp1.
a Confocal microscopy in control (n = 3) or 1 h NE-treated brown adipocytes (n = 3) expressing peroxisome-targeted GFP (GFP-PTS1) and labelled with TMRE to mark mitochondrial networks. Quantification of peroxisome-mitochondria colocalization using ImageJ. Quantification was performed with the investigator blinded to the identity of the samples. Scale bar: 5 μm. b Two-photon confocal microscopy in control (n = 4) or 1 h NE-treated brown adipocytes (n = 4) expressing GFP-PTS1 and BFP-TMEM135 and stained with TMRE. Quantification of BFP-TMEM135 localization with mitochondria using ImageJ is shown.Scale bar: 5 μm. c Western blot analysis of TMEM135 protein levels in peroxisomal and mitochondrial fractions of NE-treated brown adipocytes. Ponceau S staining as loading control. The blots are representative of three independent experiments. d Western blot analysis of Drp1 (Ser600) phosphorylation in NE-treated brown adipocytes with or without CRISPR/Cas9-mediated knockout of TMEM135; n = 3. e Western blot analysis of Drp1 (Ser600) phosphorylation in brown adipocytes transduced with lenti-GFP (n = 2) or lenti-TMEM135 (n = 3). f Immunofluorescence analysis using an antibody against Drp1 in mito-GFP expressing brown adipocytes transduced with empty or TMEM135 overexpression lentivirus. Colocalization was quantified using ImageJ. Scale bar: 10 μm. The images are representative of three independent experiments and the quantification is based on a total of 16 empty vector and 23 TMEM135 OE cells cells per group. g TMEM135 interaction network based on search of a publicly available dataset of global protein–protein interactions using a proximity-dependent biotinylation approach. h Co-immunoprecipitation of endogenous AKAP1 with FLAG-TMEM135 in HEK293 cells. The blots are representative of three independent experiments. i Pulldown assay showing that GST-TMEM135 interacts with endogenous AKAP1 in brown adipocyte protein lysates. The blots are representative of three independent experiments. Data are presented as mean ± SEM; statistical significance was determined by two-tailed unpaired Student’s t test (a, b, f).
Fig. 7
Fig. 7. TMEM135 regulates mitochondrial fission in human thermogenic adipocytes.
a qPCR analysis of Tmem135 expression in human brown adipocytes (hBAT) treated with vehicle (n = 3) or 10 µM forskolin (n = 3) for 4 h. b Western blot analysis of TMEM135 knockout using CRISPR/Cas9 in human brown adipocytes; n = 3. c Analysis of mitochondrial morphology using confocal microscopy in control (n = 5) and TMEM135 KO (n = 6) human brown adipocytes stained with MitoTracker Green. Plot shows quantification of mitochondrial morphology. Scale bar: 10 μm. d mtDNA copy number normalized to nuclear DNA in control (n = 6) and TMEM135 KO (n = 6) human brown adipocytes. e OCR measured in control (n = 10) and TMEM135 KO (n = 10) human brown adipocytes using a Seahorse XF24 Extracellular Flux Analyzer; oligo oligomycin, FCCP carbonyl cyanide-p-trifluoromethoxyphenylhydrazone, AA + R mixture of antimycin A and rotenone. f Relative gene expression of TMEM135 in abdominal subcutaneous WAT of female lean (n = 9), obese/insulin sensitive (IS) (n = 21), and obese/insulin resistance (IR) (n = 18) patients, based on analysis of publicly available transcriptome-profiling data (GEO: GSE94753). g A coding variant of TMEM135 associated with increased BMI in a Hispanic population identified in a publicly available AMP-T2D-GENES exome sequencing dataset. h Domain architecture and sequence alignment of human, bovine and mouse TMEM135. i Western blot analysis of TMEM135 KO human adipocytes transduced with lentivirus expressing GFP (n = 3), mouse WT (n = 3) or G369E TMEM135 (n = 3). j Confocal microscopy analysis of mitochondrial morphology of TMEM135 KO human adipocytes transduced with lentivirus expressing GFP (n = 5), mouse WT (n = 4) or G369E TMEM135 (n = 4). Plot shows quantification of mitochondrial morphology. Scale bar: 5 μm. Data are presented as mean ± SEM; statistical significance was determined by two-tailed unpaired Student’s t test (a, c, d, f, j) or 2-way ANOVA with Bonferroni’s post hoc test (e).
Fig. 8
Fig. 8. Graphical summary of the peroxisomal regulation of mitochondrial fission and thermogenesis mediated by TMEM135.
Cold promotes recruitment of peroxisomes to mitochondria in brown adipocytes. Peroxisomes cooperate with the endoplasmic reticulum (ER) to synthesize plasmalogens, which are incorporated into mitochondrial membrane. Plasmalogens facilitate membrane fusion and translocation of the peroxisomal transmembrane protein TMEM135 to the outer mitochondrial membrane (OMM). TMEM135 interacts with AKAP1 to promote PKA-mediated phosphorylation of Drp1. This activates mitochondrial fission, leading to increased uncoupled respiration and thermogenesis. Created with BioRender.com.

References

    1. Bluher M. Obesity: global epidemiology and pathogenesis. Nat. Rev. Endocrinol. 2019;15:288–298. - PubMed
    1. Klein S, Gastaldelli A, Yki-Jarvinen H, Scherer PE. Why does obesity cause diabetes? Cell Metab. 2022;34:11–20. - PMC - PubMed
    1. Chondronikola M, et al. Brown adipose tissue improves whole-body glucose homeostasis and insulin sensitivity in humans. Diabetes. 2014;63:4089–4099. - PMC - PubMed
    1. Chouchani ET, Kazak L, Spiegelman BM. New advances in adaptive thermogenesis: UCP1 and beyond. Cell Metab. 2019;29:27–37. - PubMed
    1. Ikeda K, et al. UCP1-independent signaling involving SERCA2b-mediated calcium cycling regulates beige fat thermogenesis and systemic glucose homeostasis. Nat. Med. 2017;23:1454–1465. - PMC - PubMed

Publication types

Substances