. 2023 Nov;146(5):725-745.
doi: 10.1007/s00401-023-02637-2. Epub 2023 Sep 29.

Senescent fibro-adipogenic progenitors are potential drivers of pathology in inclusion body myositis

Affiliations

Senescent fibro-adipogenic progenitors are potential drivers of pathology in inclusion body myositis

Christopher Nelke et al. Acta Neuropathol. 2023 Nov.

Abstract

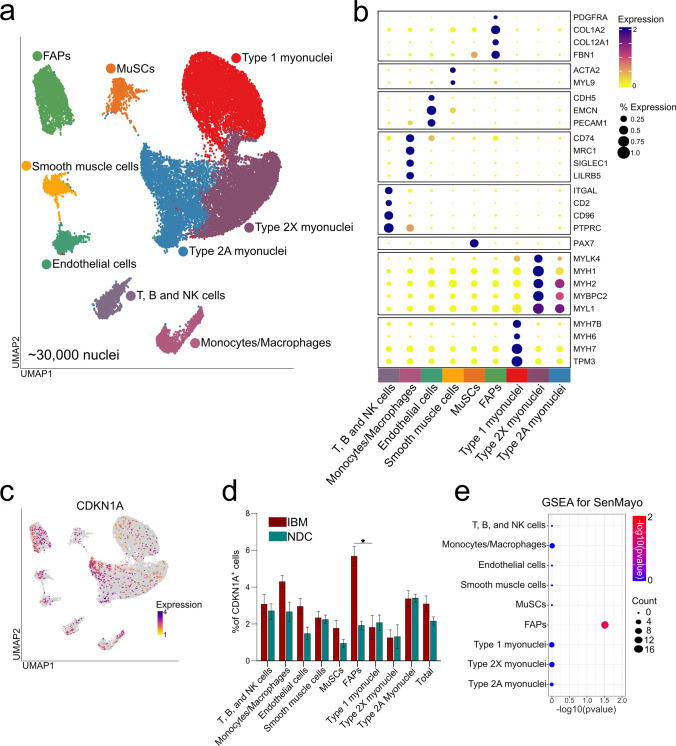
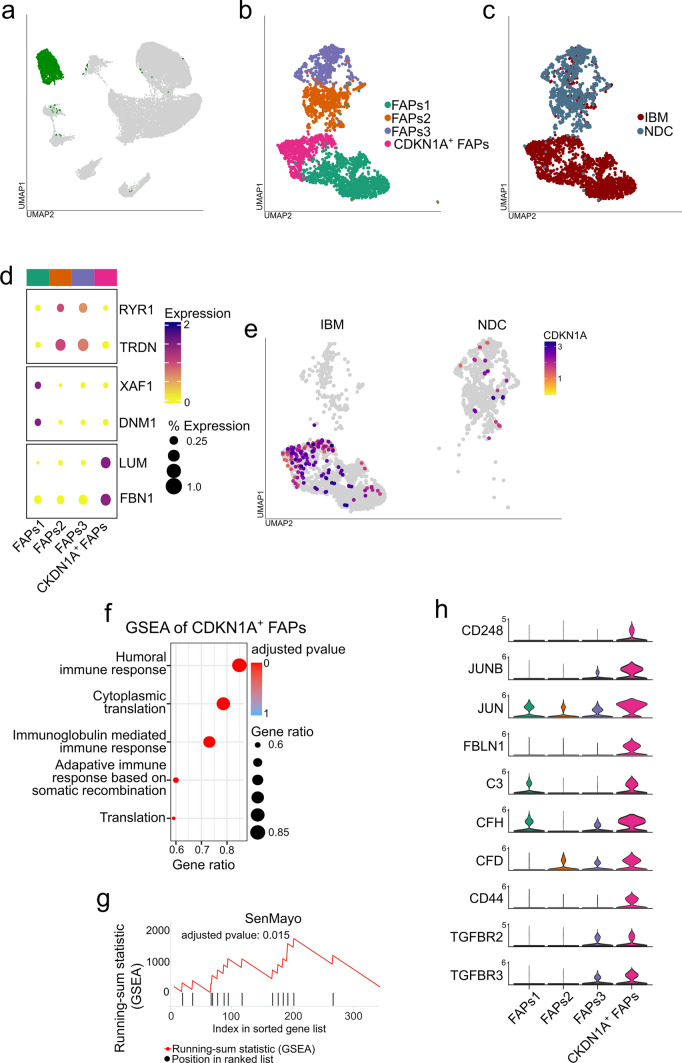
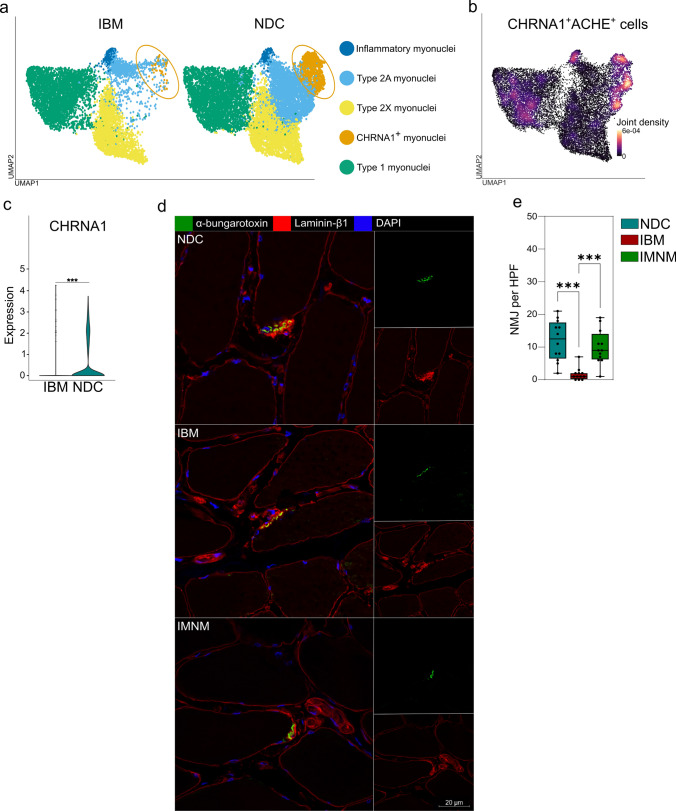
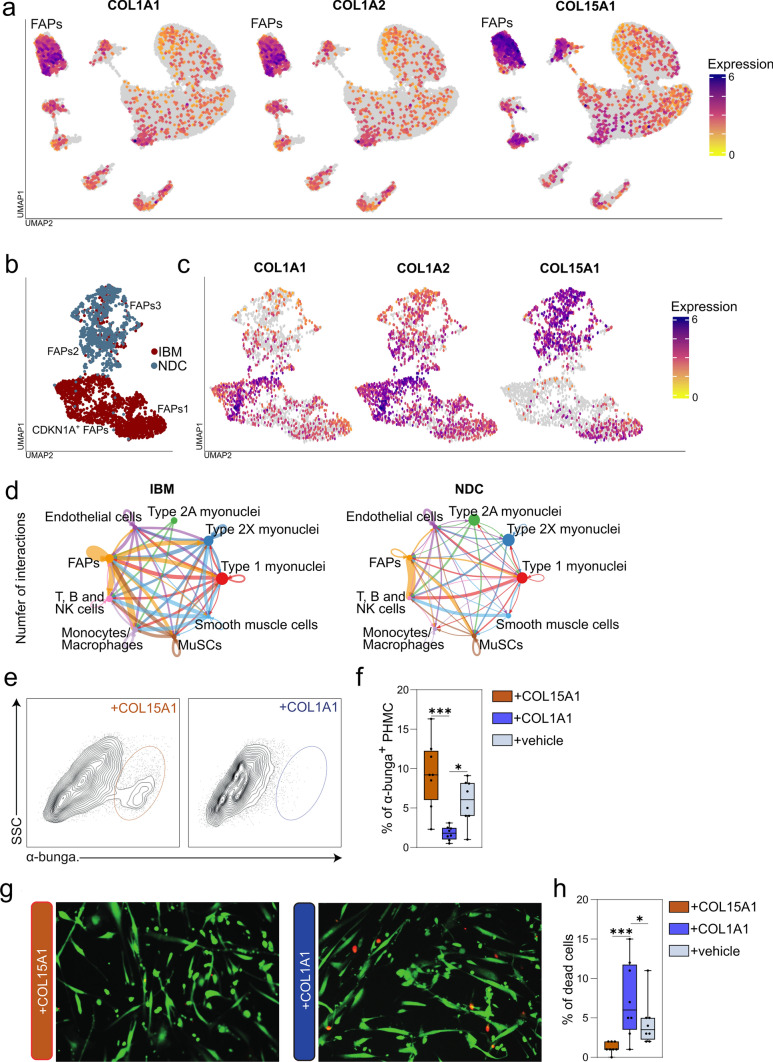
Inclusion body myositis (IBM) is unique across the spectrum of idiopathic inflammatory myopathies (IIM) due to its distinct clinical presentation and refractoriness to current treatment approaches. One explanation for this resistance may be the engagement of cell-autonomous mechanisms that sustain or promote disease progression of IBM independent of inflammatory activity. In this study, we focused on senescence of tissue-resident cells as potential driver of disease. For this purpose, we compared IBM patients to non-diseased controls and immune-mediated necrotizing myopathy patients. Histopathological analysis suggested that cellular senescence is a prominent feature of IBM, primarily affecting non-myogenic cells. In-depth analysis by single nuclei RNA sequencing allowed for the deconvolution and study of muscle-resident cell populations. Among these, we identified a specific cluster of fibro-adipogenic progenitors (FAPs) that demonstrated key hallmarks of senescence, including a pro-inflammatory secretome, expression of p21, increased β-galactosidase activity, and engagement of senescence pathways. FAP function is required for muscle cell health with changes to their phenotype potentially proving detrimental. In this respect, the transcriptomic landscape of IBM was also characterized by changes to the myogenic compartment demonstrating a pronounced loss of type 2A myofibers and a rarefication of acetylcholine receptor expressing myofibers. IBM muscle cells also engaged a specific pro-inflammatory phenotype defined by intracellular complement activity and the expression of immunogenic surface molecules. Skeletal muscle cell dysfunction may be linked to FAP senescence by a change in the collagen composition of the latter. Senescent FAPs lose collagen type XV expression, which is required to support myofibers' structural integrity and neuromuscular junction formation in vitro. Taken together, this study demonstrates an altered phenotypical landscape of muscle-resident cells and that FAPs, and not myofibers, are the primary senescent cell type in IBM.

Keywords: Acetylcholine receptor; Complement; Inclusion body myositis; Myofiber; Senescence; Single nuclei.


Conflict of interest statement

The authors declare no competing interests.

Figures

Fig. 1
Fig. 1
p21+ senescent cells are abundant in muscle of IBM. a Immunofluorescence staining of p21 (red), laminin-β1 (green), and DAPI (blue) in muscle specimens of NDCs (n = 16), IBM (n = 16), and IMNM (n = 16) patients. Patients were matched by age. Arrows indicate single p21+ cells or clusters of p21+ cells. b p21 + cells were counted in randomly distributed 10 HPF (≙ 0.16 mm2). The biopsies were blinded for quantification, with the diagnosis impossible to identify from the label. p21+ cells were defined as cells with a clear expression of p21 in the nucleus. c RT-qPCR analysis of CDKN1A coding for p21 in muscle specimen (n = 16 per group). The 2−ΔΔCT method was used for normalization. CDKN1A is significantly over-expressed to NDC for both IBM and IMNM. d Quantification of p21+ myonuclei in muscle in muscle specimen (n = 16 per group). p21+ myonuclei were defined as nuclei located inside a muscle fiber. e Exemplary image of a p21+ nucleus located inside a myofiber. Differences between groups were analysed by Kruskal–Wallis test followed by post hoc testing. f Simple linear regression of the number of p21+ cells and the disease duration of each IBM patient. The disease duration was defined as the time in months between the first symptoms as reported by the patient and the time of biopsy. The dotted line indicates the 95% confidence interval. Significance was tested by the likelihood test. *p < 0.05, **p < 0.01, ***p < 0.001. NDC non-diseased control; HPF high-power field; IBM inclusion body myositis; IMNM immune-mediated necrotizing myopathy; r2 coefficient of determination; RT-qPCR real-time quantitative polymerase chain reaction
Fig. 2
Fig. 2
Single-nuclei RNA sequencing of IBM and NDC muscle. A total of 6 frozen muscle specimens were processed for single nuclei-RNAseq (3 samples per group). A total of ~ 30,000 nuclei were included for downstream processing and clustering after quality control. a UMAP embedding demonstrating distinct clusters of cell types and subtypes. b Clustered dot plot visualization of top-regulated marker genes. The mean expression for each cluster is indicated by colour code. The dot size indicates the percent of expressing cells. Clusters were annotated based on marker genes. c Expression of CKDN1A (coding for p21) across the UMAP embedding. The mean expression for each cell is indicated by the colour code. d Frequency of CDKN1A+ cells for each cell cluster as indicated for IBM patients and NDC. Differences between groups were analysed by the Kruskal–Wallis test followed by post hoc testing. e Gene set enrichment analysis (GSEA) for the SenMayo dataset. Differentially expressed genes were determined by the FindMarkers function using Wilcox testing and a fold-change threshold of 0.25. The Bonferroni correction was used for correction for multiple testing. DEGs specific to the IBM dataset were entered into the GSEA. The Kolmogorov–Smirnov test, followed by post hoc correction, was used to determine the significance. **p < 0.01. ACTA2 actin alpha 2; CDKN1A cyclin dependent kinase inhibitor 1A; CDH5 cadherin 5; COL collagen; EMCN endomucin; FBN1 fibrillin-1; ITGAL integrin subunit alpha L; LILRB5 leukocyte immunoglobulin like receptor B5; MRC1 mannose receptor C-type 1; MYBPC2 myosin binding protein C2; MYL9 myosin light chain 9; NDC non-diseased control; IBM inclusion body myositis; SIGLEC1 sialic acid binding Ig like lectin 1; TPM3 tropomyosin 3; PECAM1 platelet and endothelial cell adhesion molecule 1; PAX7 paired box 7; PTPRC protein tyrosine phosphatase type C (CD45); UMAP uniform manifold approximation and projection
Fig. 3
Fig. 3
A novel population of senescent FAPs resides in IBM muscle. a UMAP embedding of the full dataset. FAPs are highlighted in green. All FAPs were extracted for downstream analysis and subclustering. b Subcluster analysis of the FAP population. Four FAP populations are identified based on their marker genes. c UMAP embedding displaying the origin for each nucleus. d Clustered dot plot visualization of top-regulated marker genes. The mean expression for each cluster is indicated by colour code. The dot size indicates the percent of expressing cells. Cluster were annotated based on marker genes. e Expression of CKDN1A (coding for p21) across the UMAP embedding split into the IBM (left) and NDC (right) datasets. The mean expression for each cell is indicated by the colour code. f Gene set enrichment analysis (GSEA) for the GO-BP dataset for the CDKN1A+ FAP cluster. Differentially expressed genes were determined by the FindMarkers function using Wilcox testing and a fold-change threshold of 0.25. The Bonferroni correction was used for correction for multiple testing. DEGs specific to the IBM dataset were entered into the GSEA. The Kolmogorov–Smirnov test, followed by a post hoc correction, was used to determine the significance. g GSEA analysis for the SenMayo dataset for the DEGs obtained from the CDKN1A+ FAP cluster. The running-sum statistic is in red, with the position in the ranked DEG list in black. Genes were sorted by fold change. The Kolmogorov–Smirnov test, followed by a post hoc correction, was used to determine the significance. h Violin plots displaying the normalized gene expression of the indicated genes for each FAP cluster. CDKN1A cyclin dependent kinase inhibitor 1A; DNM1 dynamin-1; FBN1 fibrillin-1; GO-BP gene ontology biological processes; LUM lumican; NDC non-diseased control; IBM inclusion body myositis; RYR1 ryanodine receptor 1; TRDN triadin; UMAP uniform manifold approximation and projection; XAF1 XIAP-associated factor 1
Fig. 4
Fig. 4
IBM demonstrates a pronounced loss of type 2A muscle fibers. a UMAP embedding of the full dataset split into IBM (left) and NDC (right). Cell populations are indicated by their colour code. b Relative frequency of each cell type or subtype in the IBM and the NDC dataset as a stacked bar plot. c UMAP embedding of the full dataset. Myonuclei are highlighted in dark red. These nuclei were extracted for downstream analysis d UMAP embedding of the myonuclei subclusters. A total of five populations were obtained from subclustering. e Clustered dot plot visualization of top-regulated marker genes. The mean expression for each cluster is indicated by colour code. The dot size indicates the percent of expressing cells. Clusters were annotated based on marker genes. f UMAP embedding for the myonuclei subcluster split into the IBM (left) and NDC (right) datasets. Subclusters are colour coded. g Exemplary ATPase staining for muscle specimens obtained from NDC, IBM, and IMNM patients. 8 patients were analysed by ATPase staining for each group. Muscle slices were incubated at a pH of 4.6, inactivating the myosin-ATPase of specific muscle fiber types. Type 1 muscle fibers are dark brown, type 2A is light brown, and type 2X are of an intermediate colour. The contrast and intensity vary between muscle specimens. A total of 10 high-power fields were counted. The corresponding statistical analysis is displayed in Suppl. Fig. 1B. ACHE acetylcholine esterase; CHRNA1 cholinergic receptor nicotinic alpha 1 subunit; FAP fibro-adipogenic progenitor; HLA human leukocyte antigen; IMNM immune-mediated necrotizing myopathy; MYH myosin heavy chain; MuSC muscle stem cell; NDC non-diseased control; IBM inclusion body myositis; TNFAIP2 TNF Alpha Induced Protein 2; UMAP uniform manifold approximation and projection
Fig. 5
Fig. 5
Skeletal muscle cells assume an inflammatory reprogramming in IBM. a UMAP embedding of the myonuclei split into IBM (left) and NDC (right). The expression of each gene indicated on the right is colour coded. b Violin plot displaying the expression of complement factor 3 (C3) for each myonuclei subset for IBM and NDC. Only inflammatory myonuclei obtained from IBM patients express C3. c Exemplary staining for C3 (red) laminin-β1 (green) and DAPI (blue) for NDC, IBM, and IMNM patients. 16 patients were analysed for each group by immunofluorescence. d C3+ myofibers were counted in randomly distributed 10 HPF (≙ 0.16 mm2). The biopsies were blinded for quantification, making the diagnosis impossible to identify from the label. e Visualization of the gene set enrichment analysis (GSEA) for the GO-BP dataset as a gene concept network. GSEA was performed from the DEGs comparing inflammatory myonuclei from IBM patients and NDC. The Kolmogorov–Smirnov test followed by post hoc correction was used to determine the significance. The top five GO terms for the BP dataset are colour coded. A line connects the corresponding genes constituting each term. The fold change for each gene comprising the GO term comparing IBM and NDC is indicated in red. The number of genes for each GO term is indicated as a dot size. CHRNA1 cholinergic receptor nicotinic alpha 1 subunit; HLA human leukocyte antigen; HPF high-power field; MYH myosin heavy chain; NDC non-diseased control; IBM inclusion body myositis; TGFB1 transforming growth factor beta 1; UMAP uniform manifold approximation and projection
Fig. 6
Fig. 6
IBM myofibers lose their potential for endplate formation. a UMAP embedding of the myonuclei split into IBM (left) and NDC (right). The myonuclei cluster expressing the acetylcholine receptor (CHRNA1) is marked in orange. b Density plot generated with the Nebulosa package of cells expressing acetylcholine receptor and acetylcholine esterase (ACHE). Areas of high cellular density are indicated in orange. c Violin plot for the CHRNA1 expression across the dataset. CHRNA1-expressing nuclei are largely absent in IBM muscle. d Exemplary staining of a NMJ in NDC, IBM, and IMNM patients, respectively. α-bungarotoxin was used to label the acetylcholine receptors of the NMJ in green. 12 patients were analysed for each group. e While NMJ was detected in all muscle samples, their frequency was strongly reduced in IBM. NMJ was defined by its characteristic topography and expression of the acetylcholine receptor. NMJ was counted in randomly distributed 10 HPF (≙ 0.16 mm2). The biopsies were blinded for quantification, with the diagnosis impossible to identify from the label. 12 patients were analysed by immunofluorescence for each group. f Frequencies of NMJ in NDC, IBM, and IMNM patients. Differences between groups were analysed by Kruskal–Wallis test followed by post hoc testing. ***p < 0.001. ACHE acetylcholine esterase; CHRNA1 cholinergic receptor nicotinic alpha 1 subunit; HPF high-power field; NDC non-diseased control; IBM inclusion body myositis; IMNM immune-mediated necrotizing myopathy; UMAP uniform manifold approximation and projection
Fig. 7
Fig. 7
FAPs demonstrate a shifted collagen homeostasis with potential consequences for muscle health in IBM. a UMAP embedding of the full dataset with the corresponding gene expression indicated by the colour code. The FAP cluster is in the upper left. b UMAP of the FAP subclusters split into their origin of IBM patients or NDC. The annotation of the corresponding subcluster is given beside the plot. CDKN1A+ FAPs are in the lower left. c UMAPs demonstrating COL1A1, COL1A2, and COL15A1 expression across the FAP cluster and its subclusters. COL15A1 is largely absent in the CDKN1A+ FAP subcluster. d Analysis of the cell–cell communication across the IBM and NDC datasets using the CellChat package. The number of the inferred ligand/receptor interactions is indicated by the size of an arrow connecting two cell populations. The larger the arrow, the higher the number of interactions between the cell populations. The ligand/receptor pairings were tested against the CellChat library for significance. e Representative flow cytometry scatter plots displaying SSC vs α-bungarotoxin for primary human muscle cells (PHMC) treated with COL15A1 or COL1A1. f Percentage of α-bungarotoxin + PHMC treated with COL15A1 or COL1A1 or vehicle. N = 8 per group. g Representative live/dead staining for PHMCs incubated with COL15A1 or COL1A1 in addition to 10 ng/ml interferon-γ (INF-γ). Live cells were identified by green-fluorescent calcein-AM, indicating intracellular esterase activity. Dead cells were identified by red-fluorescent ethidium homodimer-1, indicating a loss of membrane integrity. h 100 cells were counted for each sample, and the frequencies of live or dead cells were recorded. N = 8 per group. Differences between groups were analysed by Kruskal–Wallis test followed by post hoc testing. *p < 0.05, ***p < 0.001. CDKN1A cyclin dependent kinase inhibitor 1A; COL collagen; FAP fibro-adipogenic progenitor; NDC non-diseased control; IBM inclusion body myositis; IMNM immune-mediated necrotizing myopathy; UMAP uniform manifold approximation and projection

References

    1. Allenbach Y, Benveniste O, Goebel H-H, Stenzel W. Integrated classification of inflammatory myopathies. Neuropathol Appl Neurobiol. 2017;43:62–81. doi: 10.1111/nan.12380. - DOI - PubMed
    1. Allenbach Y, Mammen AL, Benveniste O, Stenzel W, Allenbach Y, Amato A, et al. 224th ENMC international workshop: clinico-sero-pathological classification of immune-mediated necrotizing myopathies Zandvoort, the Netherlands, 14–16 October 2016. Neuromuscul Disord. 2018;28:87–99. doi: 10.1016/j.nmd.2017.09.016. - DOI - PubMed
    1. Arbore G, Kemper C, Kolev M. Intracellular complement—the complosome—in immune cell regulation. Mol Immunol. 2017;89:2–9. doi: 10.1016/j.molimm.2017.05.012. - DOI - PMC - PubMed
    1. Benveniste O, Hogrel J-Y, Belin L, Annoussamy M, Bachasson D, Rigolet A, et al. Sirolimus for treatment of patients with inclusion body myositis: a randomised, double-blind, placebo-controlled, proof-of-concept, phase 2b trial. Lancet Rheumatol. 2021;3:e40–e48. doi: 10.1016/S2665-9913(20)30280-0. - DOI - PubMed
    1. Biferali B, Proietti D, Mozzetta C, Madaro L. Fibro–adipogenic progenitors cross-talk in skeletal muscle: the social network. Front Physiol. 2019;10:1074. doi: 10.3389/fphys.2019.01074. - DOI - PMC - PubMed

Publication types