. 2023 Sep 29;14(1):6086.
doi: 10.1038/s41467-023-41759-9.

Multi-omics profiling reveals rhythmic liver function shaped by meal timing

Affiliations

Multi-omics profiling reveals rhythmic liver function shaped by meal timing

Rongfeng Huang et al. Nat Commun. .

Abstract

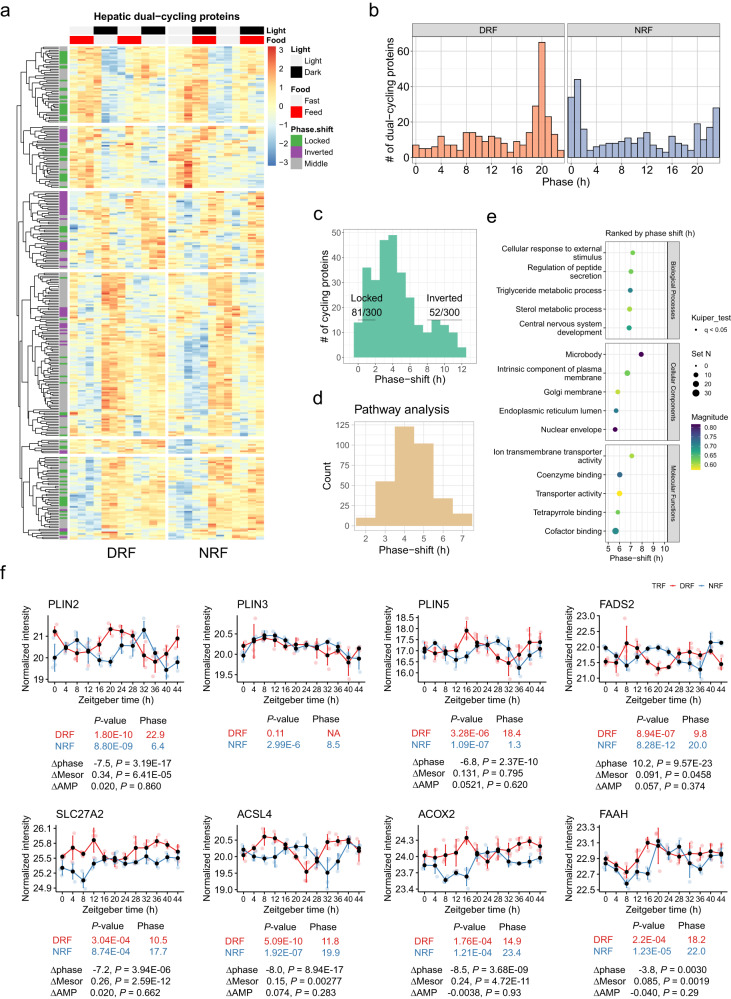
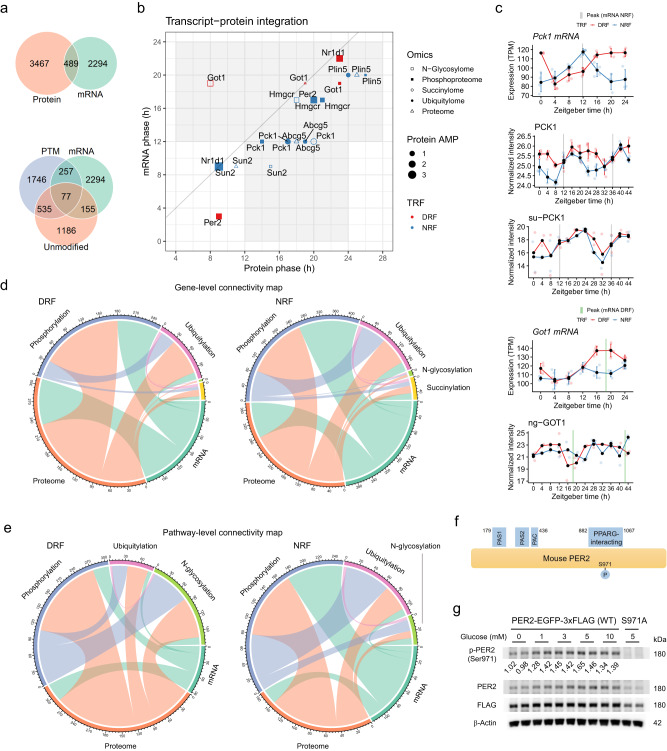
Post-translational modifications (PTMs) couple feed-fast cycles to diurnal rhythms. However, it remains largely uncharacterized whether and how meal timing organizes diurnal rhythms beyond the transcriptome. Here, we systematically profile the daily rhythms of the proteome, four PTMs (phosphorylation, ubiquitylation, succinylation and N-glycosylation) and the lipidome in the liver from young female mice subjected to either day/sleep time-restricted feeding (DRF) or night/wake time-restricted feeding (NRF). We detect robust daily rhythms among different layers of omics with phosphorylation the most nutrient-responsive and succinylation the least. Integrative analyses reveal that clock regulation of fatty acid metabolism represents a key diurnal feature that is reset by meal timing, as indicated by the rhythmic phosphorylation of the circadian repressor PERIOD2 at Ser971 (PER2-pSer971). We confirm that PER2-pSer971 is activated by nutrient availability in vivo. Together, this dataset represents a comprehensive resource detailing the proteomic and lipidomic responses by the liver to alterations in meal timing.


Conflict of interest statement

The authors declare no competing interests.

Figures

Fig. 1
Fig. 1. Diurnal multi-omics analysis of the mouse liver under time-restricted feeding.
a A schematic diagram illustrating the workflow of the multi-omics study on the effects of meal timing in the liver from 9-week-old C57BL/6J female mice. The intervention of meal timing lasts for 1 week. Samples were dissected every 4 h for 2 days (n = 48 mice per group). Proteomics, phosphoproteomics and ubiquityl-proteomics (n = 4 mice per time-point), succinyl-proteomics and N-glycosyl-proteomics (n = 2 mice per time-point) were performed and integrated. Data were matched with diurnal lipidomics (n = 4 mice per time point for 7 time points within one diurnal cycle). b Interaction of diurnal molecules in each omics dataset, and summary of identified and quantified molecules in the multi-omics data. Numbers in blue and red circles of Venn diagrams denote the number of rhythmic molecules, while numbers in the gray area denote arrhythmic molecules. Circadian rhythmicity was determined by the algorithms MetaCycle (adjusted P-value < 0.05), RAIN (adjusted P-value < 0.05), and CircaCompare (P-value < 0.05). DRF, day/sleep time-restricted feeding; NRF, night/wake time-restricted feeding; NAPE, N-acylphosphatidyl ethanolamine; EC, endocannabinoid; acyl-AA, acyl amino acids. Source data are provided as a Source data file.
Fig. 2
Fig. 2. Entrainment of the diurnal phosphoproteome by DRF.
a Expression profiles of phosphorylated proteins in the mouse liver that are diurnal under both DRF and NRF (referred to as dual-cycling phospho-proteins). Average expression levels were log2-transformed and scaled (n = 48 mice per group). b, c Histogram showing the distribution of phase (b) or phase-shift (c) of dual-cycling phospho-proteins in the mouse liver. Locked, phase shift [0, 2 h]; inverted, phase shift [8, 12 h]; numbers denote phase-locked/inverted rhythmic phosphoproteins over total dual-cycling phosphoproteins. d Histogram showing the phase distribution of enriched GO: Biological Process pathways, as measured by phase set enrichment analysis (PSEA, Kuiper test q < 0.05) of hepatic dual-cycling phospho-proteins. e, f Display of the least (e) or the most (f) phase-shifted pathways. Pathway terms are ranked based on the average phase shift and q-values, and the top 5 are displayed. g, h Diurnal profiles of representative phospho-proteins involved in the receptor-mediated endocytosis (g) and regulation of circadian rhythm (h) in the mouse liver. Data are presented as mean values  ±  standard deviation, n = 4 mice per time point for 12 time points. Source data are provided as a Source data file.
Fig. 3
Fig. 3. Features associated with meal timing in the diurnal proteome.
a Expression profiles of proteins in the mouse liver that are rhythmic under both DRF and NRF (referred to as dual-cycling proteins). Average expression levels were log2-transformed and scaled (n = 4 mice per time point for 12 time points). b, c Distribution of phase (b) and phase-shift (c) for dual-cycling hepatic proteins. Locked, phase shift [0, 2 h]; inverted, phase shift [8, 12 h]; numbers denote phase-locked/inverted rhythmic proteins over total dual-cycling proteins. d Histogram showing the phase distribution of enriched GO: Biological Process pathways, as measured by phase set enrichment analysis (PSEA, Kuiper test q < 0.05) of hepatic dual-cycling proteins. e Display of the most phase-shifted pathways. Pathway terms are ranked based on the average phase shift and q-values, and the top 5 are displayed. f Diurnal expression of proteins involved in lipid storage and fatty acid metabolism in the mouse liver (Circacompare method, P < 0.05, two-sided). Data are presented as mean values  ±  standard deviation, n = 4 mice per time point for 12 time points. Source data are provided as a Source data file.
Fig. 4
Fig. 4. Clock regulation of fatty acid metabolism is a key feature of the hepatic proteome under DRF.
a Expression profiles of dual-cycling ubiquityl-proteins in the mouse liver. Average expression levels were log2-transformed and scaled (n = 48 mice per group). b Histogram showing the phase-shift distribution of dual-cycling hepatic ubiquityl-proteins. Locked, phase shift [0, 2 h]; inverted, phase shift [8, 12 h]; numbers denote phase-locked/inverted rhythmic ubiquityl-proteins over total dual-cycling ubiquityl-proteins. c, d Histogram showing the phase-shift distribution (c) and representative pathways (d) of enriched GO: Biological Process pathways, as measured by phase set enrichment analysis (PSEA, Kuiper test q < 0.05) of hepatic dual-cycling ubiquityl-proteins. e Diurnal expression of ubiquitylated (ub-) SLC27A2 in mouse liver. Data are presented as mean values ± standard deviation, n = 4 mice per time point for 12 time points. fi Sample plot per Omics (f), loading plot displaying the contribution (loading weight) of each feature selected from the first component per Omics in an increasing order of importance from the bottom up (g), circos plot showing the positive (negative) correlation (r > 0.8) between selected features (rhythmic proteins) as indicated by the red (blue) links (h) and clustered image maps of component 1 features (i) from the N-integrative supervised analysis with multi-omics data sampled in the evening (ZT8 and ZT12, n = 16 per group). Diurnal proteins are included for this analysis. Phos.protein, phosphorylated proteins; Ubiq.protein, ubiquitylated proteins. Source data are provided as a Source data file.
Fig. 5
Fig. 5. Integrated analyses of diurnal transcriptome and multi-level proteomes.
a Histogram showing the phase distribution of enriched rhythmic pathways under DRF or NRF, as measured by PSEA of cycling proteins in livers from DRF or NRF female mice (Kuiper test, q < 0.05). b, c Representative rhythmic pathways in mouse livers under DRF (b) or NRF (c), as shown by the hour of their estimated peak time. d Diurnal profiles of dual-cycling N-glycosyl proteins in the mouse liver. Average expression levels were log2-transformed and scaled (n = 24 mice per group). e Histogram showing the phase-shift distribution of dual-cycling hepatic N-glycosyl proteins. Locked, phase shift [0, 2 h]; inverted, phase shift [8, 12 h]; numbers denote phase-locked/inverted rhythmic N-glycosyl proteins over total dual-cycling N-glycosyl proteins. f Diurnal profiles of N-glycosylated (ng-) APOB and ANGPTL3 in mouse liver, as measured by affinity purification-mass spectrometry. N = 24 mice per group. g Interaction of diurnal succinyl-sites between DRF and NRF. h Diurnal profiles of dual-cycling succinyl-sites in the mouse liver. Average expression levels were log2-transformed and scaled (n = 24 mice per group). i Diurnal profile of succinylation at K644 of HADHA (HADHA_su-K644). CircaCompare method (n = 24 mice per group, P < 0.05, two-sided test). Source data are provided as a Source data file.
Fig. 6
Fig. 6. Diurnal lipidomics profiling corroborates the entrainment of fatty acid metabolism by DRF.
a Histograms showing phase distribution of diurnal hepatic lipids and phase-shift distribution of dual-cycling hepatic lipids, the rhythmicity of which is determined by RAIN (adjusted P < 0.05), MetaCycle (adjusted P < 0.05) and Circacompare (P < 0.05) (n = 28 mice per group, n = 4 mice per time point). Two-sided multiple comparisons are adjusted using the default settings. Exact p-values are provided in the associated Source data file. Locked, phase shift [0, 2 h]; inverted, phase shift [8, 12 h]; numbers denote phase-locked/inverted rhythmic lipids over total dual-cycling lipids. b Diurnal profiles of dual-cycling lipids in mouse livers (n = 4 mice per time point). Average expression levels were log2-transformed and scaled. BMP, bis(monoacylglycero) phosphate; DAG, diacylglycerol; PA, phosphatidic acid; PE, phosphatidylethanolamine; PI, phosphatidylinositol. c Diurnal profiles of representative diurnal lipids in mouse liver. Data are presented as mean values  ±  standard error of the mean, n = 4 mice per time point for 7 time points. Two-sided unpaired Student’s t-tests with Bonferroni correction. d Class of diurnal hepatic lipids and 24-h levels of representative diurnal lipids from TRF mice. TAG, triacylglycerol; PS, phosphatidylserine; SM, sphingomyelin. e Diurnal profiles of diurnal N-acylphosphatidyl ethanolamine (NAPE), endocannabinoid/N-acylethanolamine (NAE) and monoacylglycerol (MAG) species in TRF mouse livers, the rhythmicity of which is determined by RAIN (P < 0.05), MetaCycle (P < 0.05), and Circacompare (P < 0.05). Data are presented as mean values  ±  standard error of the mean, n = 4 mice per time point for 7 time points. Two-sided unpaired Student’s t-tests with Bonferroni correction. Source data are provided as a Source data file.
Fig. 7
Fig. 7. Integrated analyses of diurnal transcriptome and multi-level proteomes.
a Venn diagram showing the interaction between rhythmic proteins consisting of unmodified, phosphorylated (phos), ubiquitylated (ubiq), N-glycosylated (ngly), and succinylated (succ) proteins and rhythmic transcripts in mouse livers under either DRF or NRF, as measured by the presence of source genes. Rhythmic transcripts are based on a published dataset (GSE150380), as measured by MetaCycle: meta2d_BH.Q < 0.05 and meta2d_rAMP >0.1 (n = 28 mice per group). b Phase plot showing the phase relationship between rhythmic proteins with or without post-translational modifications and rhythmic transcripts. c Diurnal profiles of Pck1 and Got1 gene products in mouse livers under TRF. Data are presented as mean values  ±  standard deviation (mRNA and protein). N = 14 (succinylation (su-) or N-glycosylation (ng-)) or 28 (mRNA or protein) per group. d Chord diagram showing the connection across multi-level proteomes and transcriptome under DRF or NRF, as measured by the number of shared rhythmic gene products (protein or transcript). e Chord diagram showing the connections among different omics, as measured by the presence of rhythmic pathways (Kuiper test, q < 0.05). f A schematic diagram illustrating the structural features of mouse PER2 protein. PAS, Per-ARNT-Sim domain; PAC, PAS-associated C-terminal domain; PPARG, peroxisome proliferator-activated receptor gamma. g Representative immunoblots of PER2-pSer971 and PER2 in AML-12 mouse hepatocytes stably expressing EGFP/FLAG-tagged PER2 or S971A mutant. Cells were treated in different concentrations of glucose for 8 h (n = 8 biological replicates from 4 independent experiments). Densitometric results were subtracted from the average value of those from S971A, normalized to the average of the 0 mM glucose group and labeled below the bands. Source data are provided as a Source data file.

References

    1. Bass J, Lazar MA. Circadian time signatures of fitness and disease. Science. 2016;354:994–999. - PubMed
    1. Panda S. Circadian physiology of metabolism. Science. 2016;354:1008–1015. - PMC - PubMed
    1. Mohawk JA, Green CB, Takahashi JS. Central and peripheral circadian clocks in mammals. Annu. Rev. Neurosci. 2012;35:445–462. - PMC - PubMed
    1. Allada R, Bass J. Circadian mechanisms in medicine. N. Engl. J. Med. 2021;384:550–561. - PMC - PubMed
    1. Bolshette N, Ibrahim H, Reinke H, Asher G. Circadian regulation of liver function: from molecular mechanisms to disease pathophysiology. Nat. Rev. Gastroenterol. Hepatol. 2023;31:650–657.e3. - PubMed

Publication types