. 2023 Sep 29;8(1):55.
doi: 10.1038/s41536-023-00327-x.

Human retinal ganglion cell neurons generated by synchronous BMP inhibition and transcription factor mediated reprogramming

Affiliations

Human retinal ganglion cell neurons generated by synchronous BMP inhibition and transcription factor mediated reprogramming

Devansh Agarwal et al. NPJ Regen Med. .

Abstract

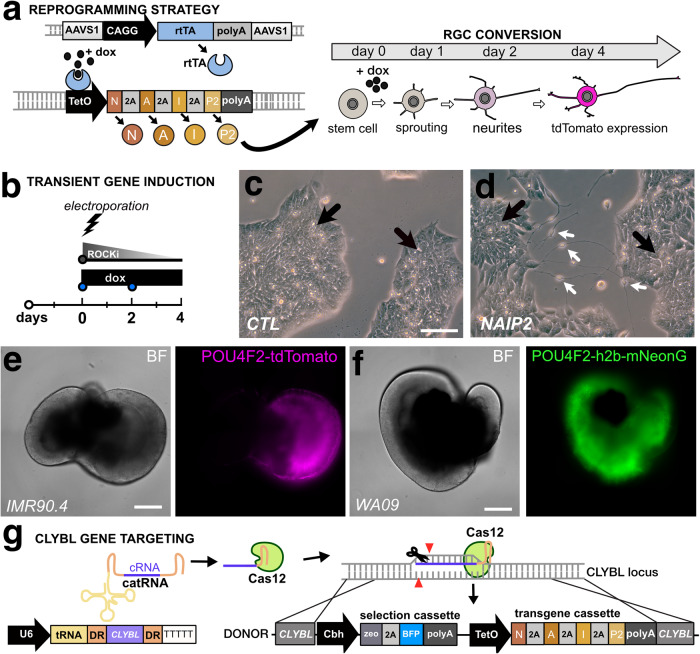
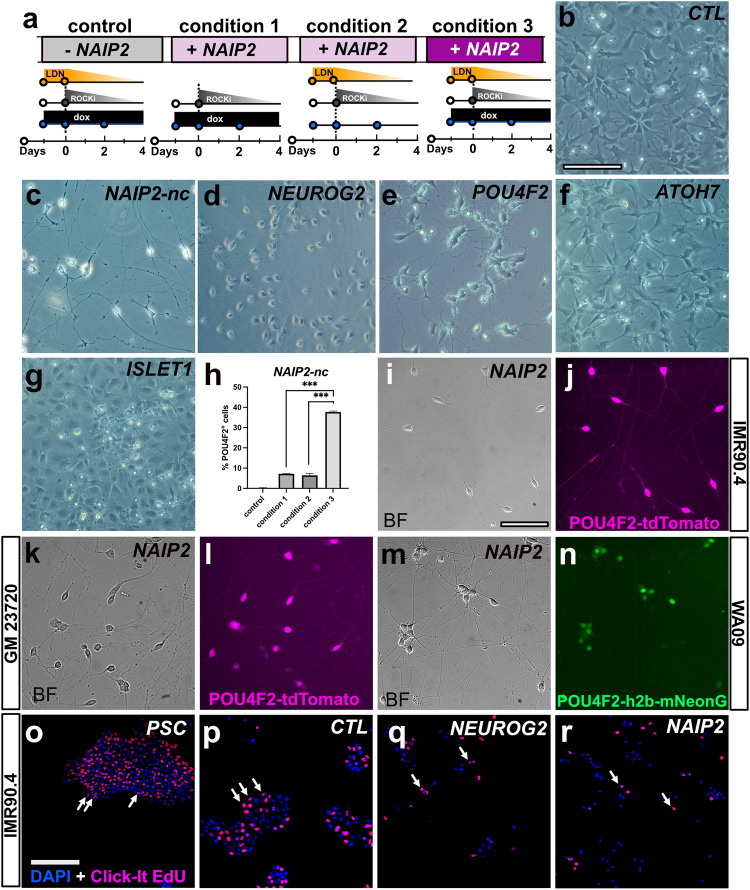
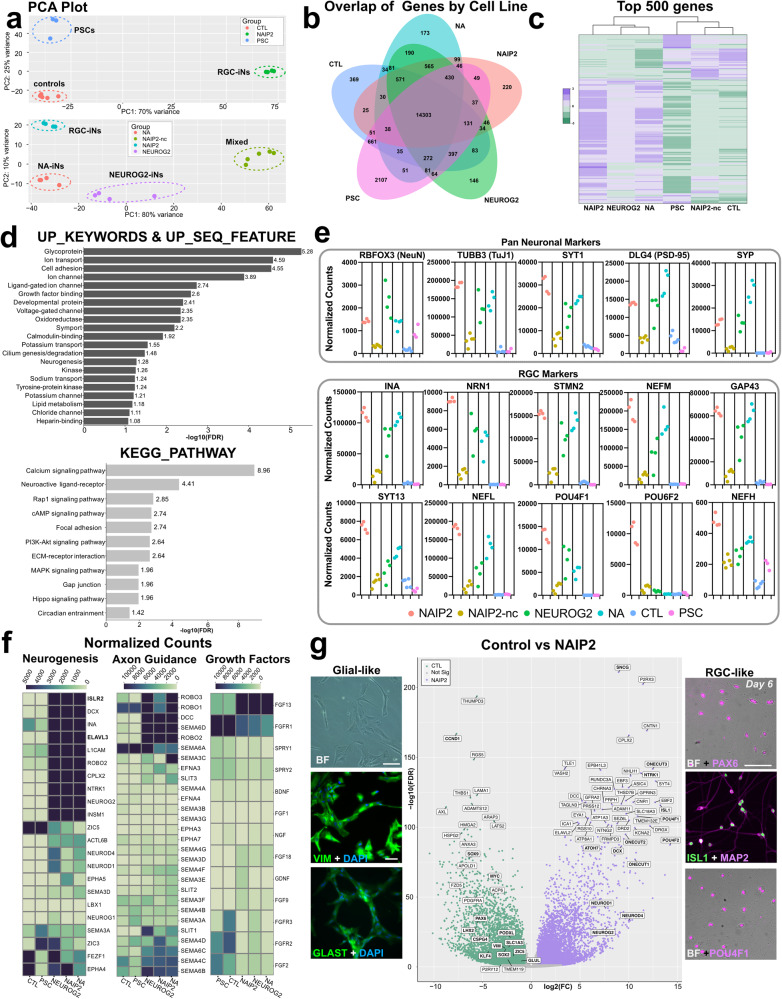
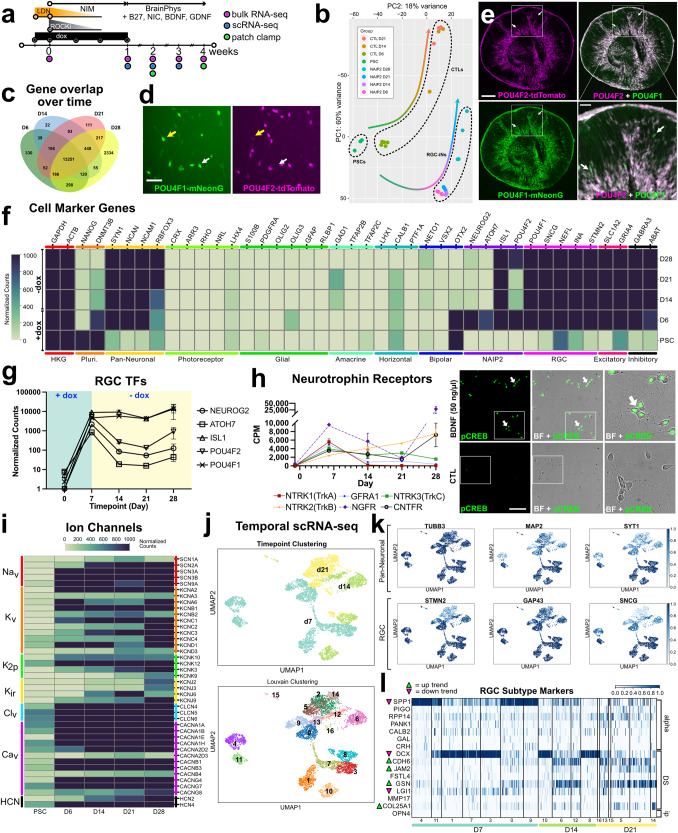
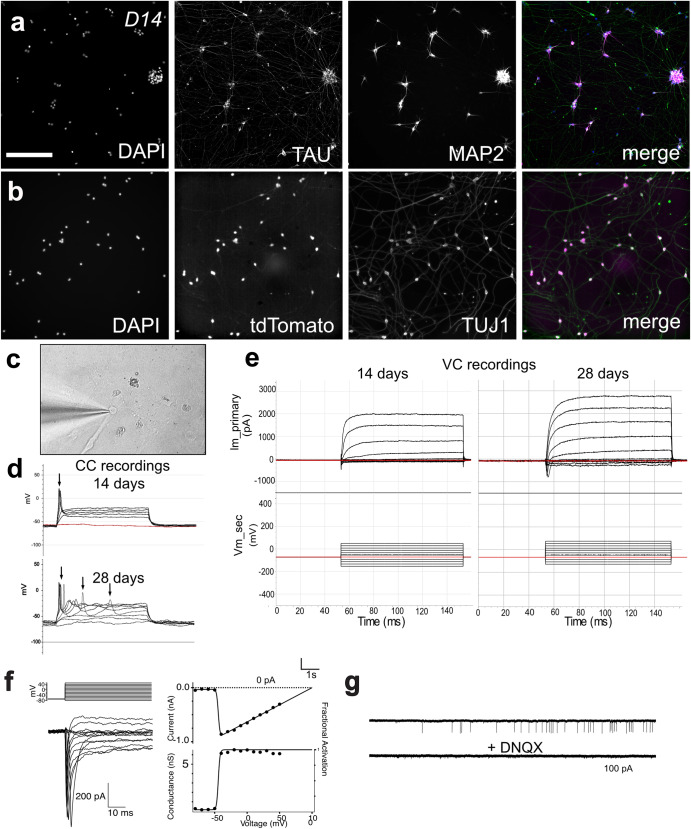
In optic neuropathies, including glaucoma, retinal ganglion cells (RGCs) die. Cell transplantation and endogenous regeneration offer strategies for retinal repair, however, developmental programs required for this to succeed are incompletely understood. To address this, we explored cellular reprogramming with transcription factor (TF) regulators of RGC development which were integrated into human pluripotent stem cells (PSCs) as inducible gene cassettes. When the pioneer factor NEUROG2 was combined with RGC-expressed TFs (ATOH7, ISL1, and POU4F2) some conversion was observed and when pre-patterned by BMP inhibition, RGC-like induced neurons (RGC-iNs) were generated with high efficiency in just under a week. These exhibited transcriptional profiles that were reminiscent of RGCs and exhibited electrophysiological properties, including AMPA-mediated synaptic transmission. Additionally, we demonstrated that small molecule inhibitors of DLK/LZK and GCK-IV can block neuronal death in two pharmacological axon injury models. Combining developmental patterning with RGC-specific TFs thus provided valuable insight into strategies for cell replacement and neuroprotection.


Conflict of interest statement

K.J.W., D.A., N.D., and R.M.W. have filed a United States provisional patent (63/478416) for work related to RGC reprogramming. J.M.R. is the chief medical officer for Path Therapeutics, Inc., consultant for Danone Nutricia, Cerecin, Eisai, Biocodex, Zogenix and in the speaker’s bureau for Aquestive Pharmaceuticals. The remaining authors declare no competing interests.

Figures

Fig. 1
Fig. 1. Vector design for insertion of a Tet-On regulated RGC cassette.
a A conceptual diagram for a 3G Tet-ON system where doxycycline binds to constitutively expressed rtTA to induce polycistronic expression of NEUROG2, ATOH7, ISLET1, and POU4F2 (NAIP2) leading to conversion of RGC-like neurons. b Electroporation approach for the transient transfection of the NAIP2 transgene package. c PSCs that were transiently transfected with control (empty) or d NAIP2 plasmids and treated with dox for 3 days. Black arrows = PSCs, white arrows = converted neurons. Brightfield and fluorescent images of e the POU4F2-tdTomato+ reporter in a 66-day-old retinal organoid in the IMR90.4 genetic background and f a 65-day-old POU4F2-h2b-mNeonGreen+ retinal organoid in the WA09 genetic background. g U6 promoter-driven expression of an AsCas12a cRNA targeting the CLYBL safe harbor site for insertion of a zeocin selectable Tet-inducible transgene cassette. Scale c, d = 100 µm, e, f = 400 µm.
Fig. 2
Fig. 2. Enhancement of neuronal morphology after patterning by BMP inhibition.
a Timeline of LDN193189 and/or dox treatments of POU4F2-tdTomato PSCs with an integrated empty cassette (control) or NAIP2 cassette (conditions 1–3). Brightfield images of dox treated b empty cassette control cells, c NAIP2-nc, d NEUROG2, e POU4F2, f ATOH7, and g ISLET1 cells after 6 days. NAIP2-nc = not clonally selected. h Quantification of %POU4F2+ cells at day 6 relative to DAPI in the empty cassette control and conditions 1–3 illustrated in (a). *P < 0.05, **P < 0.01, ***P < 0.001, ns P > 0.05, n = 3. Error bars are reported as standard deviation (SD). in NAIP2 RGC-iNs from different genetic backgrounds differentiated and imaged in brightfield and POU4F2+ tdTomato fluorescence for clonally selected i, j IMR90.4 and k, l GM23720 PSCs, and m, n brightfield and POU4F2 + h2b-mNeonGreen fluorescence for WA09 PSCs. Click-iT EdU staining in o undifferentiated PSCs and 2-day LDN/dox treated p control, q NEUROG2, and r NAIP2 cells co-stained with DAPI. Arrows in O-R indicate EdU+ cells. Scale bg, in = 100 µm, or = 200 µm.
Fig. 3
Fig. 3. Quantification of POU4F2-tdTomato+ cells induced with different TF combinations.
al Representative images of PSCs induced for 6 days with LDN/dox and different TFs alone (N, A, I, P2) or in combination (NAIP2, NA, NAI, AI, NP, NAP2, IP2) with imaging for DAPI (left) and POU4F2-tdTomato+ (right). TdTomato panels are intentionally uniformly overexposed so that samples with weaker fluorescence (dl) could be detected. m Percent of POU4F2-tdTomato+ cells on day 6 quantified as POU4F2+ cells relative to DAPI. For the WA09 background, this was determined by measuring h2b-mNeonGreen+ relative to DAPI. n NAI iNs and o NAIP2 RGC-iNs showing POU4F2-tdTomato expression (left) and TUJ1 staining (right). NAI cells were additionally labeled with DAPI. p %TUJ1+ neurons and q %TUJ1+/POU4F2+ co-labeled RGC-iNs. r A diagram summarizing the key events driving differentiation from immature PSCs to mature RGCs. White arrows=overlapping tdTomato+ signal; yellow arrows=absence of a signal. *P < 0.05, **P < 0.01, ***P < 0.001, ****P < 0.0001, ns P > 0.05, n = 3. Error bars are reported as standard deviation (SD). Scale al = 200 µm; n, o =100 µm.
Fig. 4
Fig. 4. Validation of RGC-iNs by RNA-seq.
a Principal Component Analysis (PCA) plot of day 6 CTL, NAIP2 and PSC (top) and NEUROG2, NA, NAIP2-nc and NAIP2 cells (bottom). b Venn diagram of the number of genes expressed in each sample (normalized count >10). c Heatmap of the top 500 genes expressed in the NAIP2 samples. d Bar graph depicting −log10(FDR) of significantly differentially expressed pathways between NAIP2 and CTL samples identified by DAVID in Uniprot (top) and KEGG Gene Ontology (bottom) databases. e Scatterplots showing normalized counts of pan-neuronal and RGC marker genes in each treatment group. f Heatmaps of genes expressed within the neurogenesis (left), axon guidance (center), and growth factor (right) pathways. g Volcano plot highlighting log2(FC) gene expression between the CTL and NAIP2 samples plotted with respect to −log10(FDR). Immunostaining for VIM and GLAST in control cells (left) and PAX6, ISL1, POU4F1, and MAP2 in NAIP2 samples (right). FDR = false discovery rate. FC = fold change. Scale g = 85 µm. NAIP2-nc = RGC-iNs from non-clonally selected PSCs.
Fig. 5
Fig. 5. Temporal RNA-seq of RGC-iNs.
a Timeline for longitudinal studies. b RNA-seq PCA plot showing clustering among PSCs, days 6, 14, 21, and 28 (D6, -14, -21, -28) RGC-iN cultures and days 6, 14, and 21 (D6, -14, -21) CTLs. c Venn Diagram showing overlapping genes at each time point (normalized count > 10). d POU4F1-mNeonGreen/POU4F2-tdTomato dual reporters in RGC-iNs at day 6. e Cryosectioned day 45 organoids exhibiting POU4F2-tdTomato + /POU4F1-mNeonGreen+ reporter expression. f Heatmap indicating the expression of selected markers for housekeeping (HKG), pluripotency, NAIP2 cassette, photoreceptor (PRs), glial, RGC, inhibitory, excitatory, and pan-neuronal genes. g Line graph showing the RGC transcription factors (TFs) NEUROG2, ATOH7, ISL1, POU4F1, and POU4F2 expression at each time point. h Line graph for selected neurotrophin receptors and immunostaining of day 6 RGC-iNs with pCREB after 30 min BDNF treatment. i Heatmap highlighting ion channel genes expressed at each time point. j UMAPs of RGC-iNs colored by time point (top) and Louvain clusters (bottom). k UMAPs of RGC-iNs colored by pan-neuronal marker gene expression (top) and RGC-specific marker genes (bottom). l Heatmap showing normalized expression of various RGC-subtype marker genes in each cluster of RGC-iNs across day 7, 14, and 21 time points. *P < 0.05, **P < 0.01, ***P < 0.001, ****P < 0.0001, ns P > 0.05, n = 3 for PSCs, n = 4 for all other samples. Error bars g, h = SEM. Scale d = 50 µm, e = 200 µm, e, inset = 50 µm, h = 85 µm.
Fig. 6
Fig. 6. Functional analysis of RGC-iNs.
Day 14 (D14) RGC-iNs stained with a DAPI, TAU, and MAP2. b DAPI and TUJ1 overlayed with tdTomato. c Patched D14 RGC-iN. d Electrophysiological recordings from RGC-iNs under current clamp showing single action potentials elicited in response to depolarizing current injection as early as 14 days. By day 28, RGC-iNs are shown to exhibit repetitive action potentials. Resting membrane potential = −60 mV. Threshold current = 60 pA. e Under voltage clamp, depolarizing voltage steps in RGC-iNs reveal both fast inward Na+ and outward K+ currents, which are increased at day 28 compared to day 14. f, left: An example AMPA puff (1 mM) evoked current in a voltage-clamped RGC-iN. f, right: I–V plot for AMPA puff evoked currents in RGC-iN (solid symbols), and linear fit (solid line). Traces on the left show time course and double exponential fit to putative sEPSCs. g Example of current traces showing spontaneous excitatory post-synaptic currents (sEPSCs) that were blocked by the AMPA/Kainate antagonist DNQX. Scale a, b = 200 µm.
Fig. 7
Fig. 7. Inhibition of DLK/LZK and GCK-IV pathways protects against neuronal injury.
a Diagram illustrating a model for blocking DLK-induced cell death. b Timeline for RGC-iN differentiation, colchicine-induced injury and neuroprotection with GNE-3511. c RGC-iNs treated with or without GNE-3511 (1 μM), 72 h after treatment with or without colchicine (40 nM). d Quantification of the CellTiterGlo (CTG) viability assay in the presence or absence of GNE-3511 in combination with increasing doses of colchicine (n = 4). e Timeline for RGC-iN differentiation, injury from paclitaxel(P), and neuroprotection with PF-06260933(PF). f Representative Calcein-AM images after treatment at D1, 2, 3, and 4 with control, paclitaxel, PF-06260933 and paclitaxel + PF-06260933. Quantification of viability using CTG in NAIP2 cells in g IMR90.4, h WA09, and i GM23720 RGC-iNs normalized relative to controls after treatment with P, PF or P + PF (n = 3). Scale c = 200 µm, f = 400 µm. *P < 0.05, **P < 0.01, ***P < 0.001, ****P < 0.0001. Error bars are reported as standard deviation (SD).

References

    1. Todd L, et al. Reprogramming Muller glia to regenerate ganglion-like cells in adult mouse retina with developmental transcription factors. Sci. Adv. 2022;8:eabq7219. - PMC - PubMed
    1. Huang J, Liu Y, Oltean A, Beebe DC. Bmp4 from the optic vesicle specifies murine retina formation. Dev. Biol. 2015;402:119–126. - PMC - PubMed
    1. Heavner W, Pevny L. Eye development and retinogenesis. Cold Spring Harb. Perspect. Biol. 2012;4:a008391–a008391. - PMC - PubMed
    1. Hasegawa Y, et al. Emergence of dorsal-ventral polarity in ESC-derived retinal tissue. Development. 2016;143:3895–3906. - PubMed
    1. Hufnagel RB, Le TT, Riesenberg AL, Brown NL. Neurog2 controls the leading edge of neurogenesis in the mammalian retina. Dev. Biol. 2010;340:490–503. - PMC - PubMed