. 2024 Jan;476(1):75-86.
doi: 10.1007/s00424-023-02863-3. Epub 2023 Sep 29.

PKC regulates αKlotho gene expression in MDCK and NRK-52E cells

Affiliations

PKC regulates αKlotho gene expression in MDCK and NRK-52E cells

Lisa Wolf et al. Pflugers Arch. 2024 Jan.

Abstract

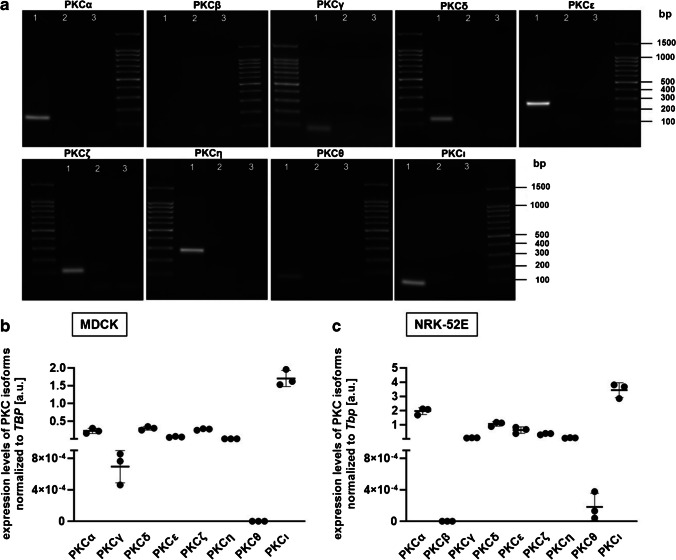
Particularly expressed in the kidney, αKlotho is a transmembrane protein that acts together with bone hormone fibroblast growth factor 23 (FGF23) to regulate renal phosphate and vitamin D homeostasis. Soluble Klotho (sKL) is released from the transmembrane form and controls various cellular functions as a paracrine and endocrine factor. αKlotho deficiency accelerates aging, whereas its overexpression favors longevity. Higher αKlotho abundance confers a better prognosis in cardiovascular and renal disease owing to anti-inflammatory, antifibrotic, or antioxidant effects and tumor suppression. Serine/threonine protein kinase C (PKC) is ubiquitously expressed, affects several cellular responses, and is also implicated in heart or kidney disease as well as cancer. We explored whether PKC is a regulator of αKlotho. Experiments were performed in renal MDCK or NRK-52E cells and PKC isoform and αKlotho expression determined by qRT-PCR and Western Blotting. In both cell lines, PKC activation with phorbol ester phorbol-12-myristate-13-acetate (PMA) downregulated, while PKC inhibitor staurosporine enhanced αKlotho mRNA abundance. Further experiments with PKC inhibitor Gö6976 and RNA interference suggested that PKCγ is the major isoform for the regulation of αKlotho gene expression in the two cell lines. In conclusion, PKC is a negative regulator of αKlotho gene expression, an effect which may be relevant for the unfavorable effect of PKC on heart or kidney disease and tumorigenesis.

Keywords: FGF23; Longevity; Phorbol ester; Phosphate.


Conflict of interest statement

The authors declare no competing interests.

Figures

Fig. 1
Fig. 1
Expression of PKC isoforms in MDCK and NRK-52E cells. Original gel photographs (a) showing the products of PKC isoform-specific transcript amplification in untreated MDCK cells (lane 1), minus reverse transcriptase controls (lane 2), and non-template controls (lane 3). Expression levels (arithmetic means ± SD) of PKC isoforms in MDCK (b, n=3) and NRK-52E cells (c, n=3) relative to TBP transcript levels. bp, base pairs; a.u., arbitrary units
Fig. 2
Fig. 2
PKC activator PMA decreased and PKC inhibitor staurosporine increased αKlotho expression in MDCK cells. a Arithmetic means ± SD (n=5) of αKlotho expression relative to TBP in MDCK cells treated with or without (CTR; white circles) PKC activator PMA. Original Western Blots showing b phospho-ERK(1/2) and total ERK(1/2) (left panel) and phospho-ERK(1/2) over total ERK(1/2) protein ratio (right panel; n=4) in MDCK cells treated with or without (CTR) 30 nM PMA for 24 h. c αKlotho expression relative to TBP in MDCK cells (n=6) treated with or without (CTR; white circles) PKC inhibitor staurosporine at the indicated concentrations for 24 h. d Cell viability of MDCK cells (n=3) treated with 1 nM staurosporine for 24 h relative to vehicle-treated cells. e αKlotho gene expression relative to TBP in MDCK cells (n=6) incubated with (black squares) or without (CTR; white circles) PKC activator PMA (100 pM) in the presence or absence of 1 nM PKC inhibitor staurosporine for 24 h. *p < 0.05, **p < 0.01, and ***p < 0.001. a, c Friedman test; b, d paired t-test, e repeated measures two-way ANOVA followed by Bonferroni’s multiple comparison test. a.u., arbitrary units
Fig. 3
Fig. 3
PKC activator PMA lowered and PKC inhibitor staurosporine enhanced αKlotho expression in NRK-52E cells. Arithmetic means ± SD of αKlotho expression relative to Tbp in NRK-52E cells treated with or without (CTR; white circles) a PKC activator PMA (n=6) or b PKC inhibitor staurosporine (n=8) at the indicated concentrations for 24 h. c Original Western Blots (upper panel) showing αKlotho and loading control GAPDH protein abundance and αKlotho over GAPDH ratio (lower panel; n=8) in NRK-52E cells treated with or without 1 nM staurosporine for 24 h. d αKlotho gene expression relative to Tbp in NRK-52E (n=11) cells treated with (black squares) or without (CTR; white circles) PKC activator PMA (100 nM) in the presence or absence of 1 nM PKC inhibitor staurosporine for 24 h. *p < 0.05 and **p < 0.01. a, b Friedman test; c paired t-test; d repeated measures two-way ANOVA followed by Bonferroni’s multiple comparison test. a.u., arbitrary units; m, marker; stauro, staurosporine
Fig. 4
Fig. 4
PKCα/β/δ/ε/η/θ inhibitor sotrastaurine and PKCα/β inhibitor Gö6976 did not significantly affect αKlotho expression in MDCK cells. a Arithmetic means ± SD (n=4) of αKlotho mRNA abundance relative to TBP in MDCK cells treated with (black squares) or without (CTR; white circles) PKC activator PMA (100 nM) in the presence or absence of 300 nM PKC inhibitor sotrastaurine. b αKlotho mRNA abundance relative to TBP (n=4) in MDCK cells treated with or without 40 nM PKC inhibitor Gö6976 for 24 h. **p < 0.01. a Repeated measures two-way ANOVA followed by Bonferroni’s multiple comparison test; b paired t-test. a.u., arbitrary units
Fig. 5
Fig. 5
RNAi-mediated silencing of PKCγ enhanced αKlotho gene expression in MDCK and NRK-52E cells. a Original gel photograph showing the product of PKCγ isoform-specific transcript amplification in untreated MDCK (lane 1) and NRK-52E cells (lane 2). b Original Western Blots of PKCγ protein abundance in mouse brain, untreated MDCK and NRK-52E cells, and rat kidney. Arithmetic means ± SD of c, f PKCγ and e, g αKlotho gene expression relative to TBP in c, e MDCK (n=11) and f, g NRK-52E (n=10 and n=11, respectively) cells transfected with either 50 nM (NRK52E) or 25 nM (MDCK) non-targeting siRNA (siNeg) or siRNA specifically targeting PKCγ (siPKCγ) for 24 h. d Original Western Blots (left panel) and densitometric analysis (right panel; n=6) of PKCγ and loading control GAPDH in MDCK cells treated for 72 h with 25 nM non-targeting siRNA (siNeg) or siRNA targeting PKCγ. e αKlotho mRNA abundance relative to TBP in MDCK cells (n=5) treated with PKCγ-targeting or non-targeting (siNeg) siRNA in the presence (black squares) or absence (white circles) of PMA. *p < 0.05, **p < 0.01, and ***p < 0.001. c, f, g Wilcoxon matched-pairs signed rank test; d paired t-test; e repeated measures two-way ANOVA followed by Bonferroni’s multiple comparison test. a.u., arbitrary units; m, marker
Fig. 6
Fig. 6
RNAi-mediated silencing of PKCη had no effect on αKlotho gene expression in MDCK cells. Arithmetic means ± SD of a PKCη (n=4) and b αKlotho (n=4) gene expression relative to TBP in MDCK cells transfected for 24 h with either non-targeting siRNA (siNeg) or siRNA specifically targeting PKCη (siPKCη). *p < 0.05. a, b Paired t-test). a.u., arbitrary units

References

    1. Bacchetta J, Sea JL, Chun RF, et al. Fibroblast growth factor 23 inhibits extrarenal synthesis of 1,25-dihydroxyvitamin D in human monocytes. J Bone Miner Res. 2013;28:46–55. doi: 10.1002/jbmr.1740. - DOI - PMC - PubMed
    1. Bär L, Hase P, Föller M. PKC regulates the production of fibroblast growth factor 23 (FGF23) PLoS One. 2019;14:e0211309. doi: 10.1371/journal.pone.0211309. - DOI - PMC - PubMed
    1. Bergwitz C, Jüppner H. Regulation of phosphate homeostasis by PTH, vitamin D, and FGF23. Annu Rev Med. 2010;61:91–104. doi: 10.1146/annurev.med.051308.111339. - DOI - PMC - PubMed
    1. Bi X, Yang K, Zhang B, et al. The protective role of Klotho in CKD-associated cardiovascular disease. Kidney Dis (Basel) 2020;6:395–406. doi: 10.1159/000509369. - DOI - PMC - PubMed
    1. Blau JE, Collins MT. The PTH-vitamin D-FGF23 axis. Rev Endocr Metab Disord. 2015;16:165–174. doi: 10.1007/s11154-015-9318-z. - DOI - PubMed