. 2023 Sep 29;3(1):128.
doi: 10.1038/s43856-023-00355-0.

Intestinal disturbances associated with mortality of children with complicated severe malnutrition

Affiliations

Intestinal disturbances associated with mortality of children with complicated severe malnutrition

Bijun Wen et al. Commun Med (Lond). .

Abstract

Background: Children admitted to hospital with complicated severe malnutrition (CSM) have high mortality despite compliance with standard WHO management guidelines. Limited data suggests a relationship between intestinal dysfunction and poor prognosis in CSM, but this has not been explicitly studied. This study aimed to evaluate the role of intestinal disturbances in CSM mortality.

Methods: A case-control study nested within a randomized control trial was conducted among children hospitalized with CSM in Kenya and Malawi. Children who died (cases, n = 68) were compared with those who were discharged, propensity matched to the cases on age, HIV and nutritional status (controls, n = 68) on fecal metabolomics that targeted about 70 commonly measured metabolites, and enteropathy markers: fecal myeloperoxidase (MPO), fecal calprotectin, and circulating intestinal fatty acid binding protein (I-FABP).

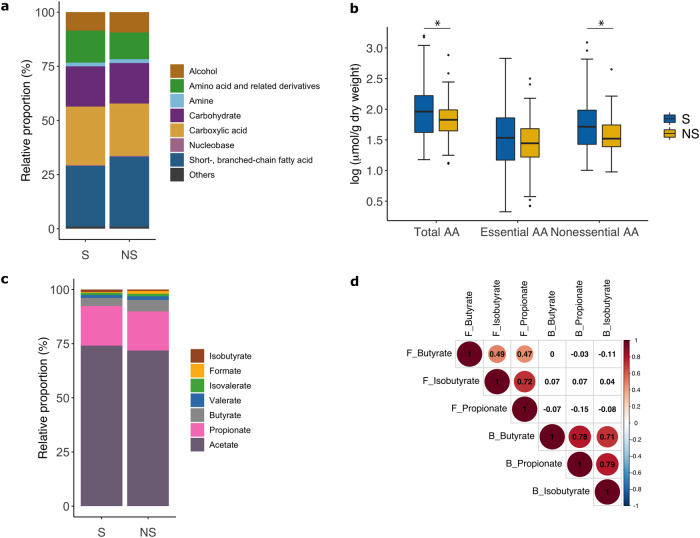
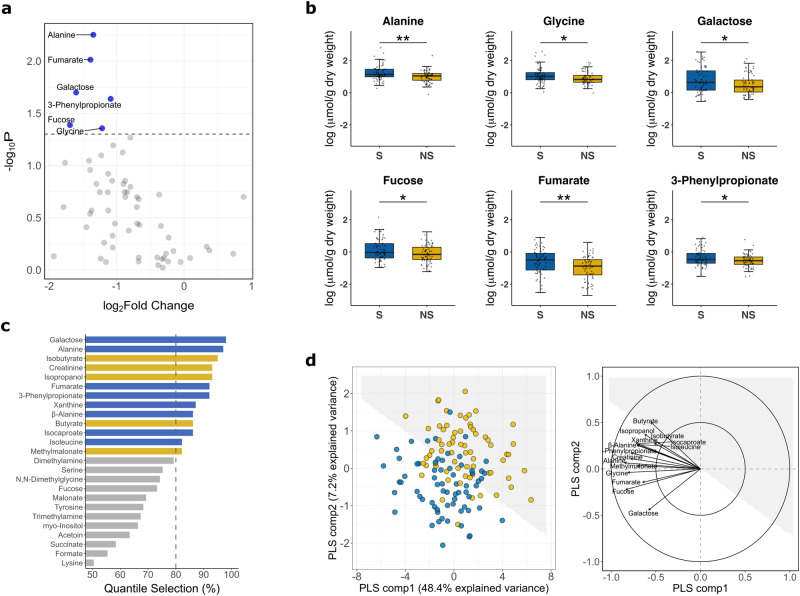
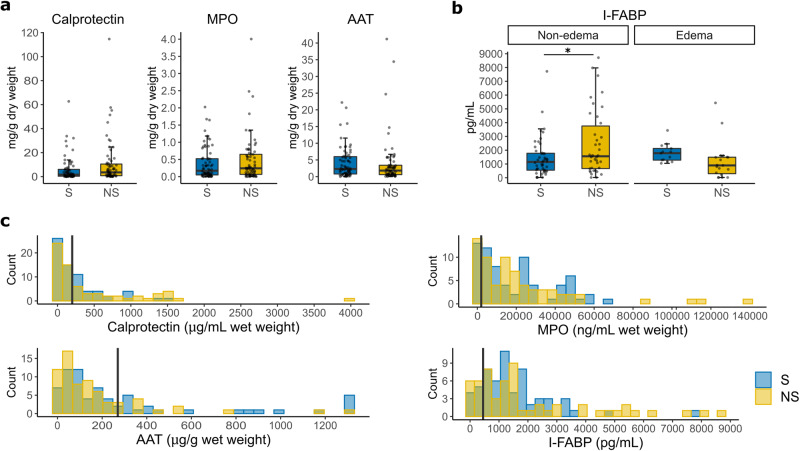
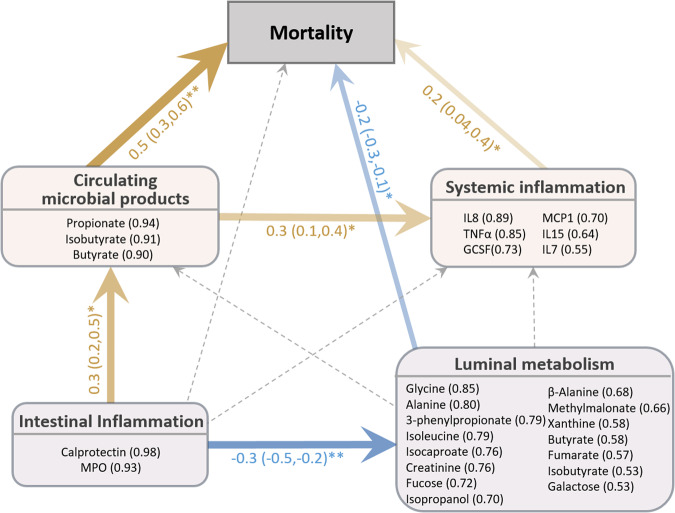
Results: The fecal metabolomes of cases show specific reductions in amino acids, monosaccharides, and microbial fermentation products, when compared to controls. SCFA levels did not differ between groups. The overall fecal metabolomics signature moderately differentiates cases from controls (AUC = 0.72). Enteropathy markers do not differ between groups overall, although serum I-FABP is elevated in cases in a sensitivity analysis among non-edematous children. Integrative analysis with systemic data suggests an indirect role of intestinal inflammation in the causal path of mortality.

Conclusions: Intestinal disturbances appear to have an indirect association with acute mortality. Findings of the study improve our understanding of pathophysiological pathways underlying mortality of children with CSM.

Plain language summary

Malnourished children are at a high risk of dying when exposed to an acute illness. They often have symptoms like diarrhea that indicate their gut is not working properly. It is unclear whether these gut problems contribute to their deaths. Feces contain numerous small molecules processed by the gut that reflect gut health. We compare these fecal molecules between malnourished children who died during hospitalization to those who survived, and relate them to signs of inflammation in the body. We show that the fecal molecules are different between children who died and those who survived. These differences reveal that poor gut health could increase risk of death, potentially by perturbing the body’s defensive response to an acute illness. These findings underscore that treatment for ill severely malnourished children should focus on improving gut health.


Conflict of interest statement

The authors declare no competing interests.

Figures

Fig. 1
Fig. 1. Fecal metabolome composition.
a Relative proportion of metabolites in each class. The class Others includes metabolites presence in relatively small amounts of the classes of phenol, phenethylamine, phenylpropanoid, sulfonic acid or carbonyl compound. b Boxplots (center line: median; box limits: IQR; whiskers: 1.5 times IQR) showing concentrations of amino acids between survivors (S) and nonsurvivors (NS). c Relative proportions of individual SCFA species to total SCFAs. (d) Pairwise Pearson correlations between fecal (labeled as “F_”) and circulating (labeled as “B_”) SCFAs. Significant (PFDR < 0.05) correlations are denoted by color-filled circles. Unless stated otherwise, n = 68 cases and 68 controls.
Fig. 2
Fig. 2. Fecal metabolomic signatures associated with mortality.
a Volcano plot of 61 measurable metabolites. Univariately differential metabolites between nonsurvivors (NS) and survivors (S) are above the dashed line (P = 0.05). b Boxplots (center line: median; box limits: IQR; whiskers: 1.5 times IQR) showing concentrations of univariately differential metabolites between NS and S. *P < 0.05, ** P < 0.01. c Multivariable elastic net analysis with quantile selection. Bars correspond to the bootstrapped confidence interval of a respective metabolite being selected (i.e. coefficient ≠ 0) by the elastic net model; influential metabolites are those above the threshold of 80% (dashed line). Bar color denotes median concentration higher (yellow) or lower (blue) in NS compared to S. d Partial least squares discriminant analysis (PLS-DA) of the combined profile of 15 differential features. Left: score plot of individuals (NS in yellow; S in blue) clustered by multilevel PLS-DA. The interface between the white and the grey shaded area represents the classification decision line. Right: correlations among the differential features with PLS components. Arrows denote the direction and magnitude of correlations. Model performance and validity measures were cross-validated AUC = 0.72 ± 0.03, misclassification rate=0.35 ± 0.03. Unless stated otherwise, n = 68 cases and 68 controls.
Fig. 3
Fig. 3. Enteropathy marker levels at admission between survivors and nonsurvivors.
a Concentrations of fecal enteropathy markers in dry fecal weight between nonsurvivors (NS) and survivors (S): Calprotectin (P = 0.08), Myeloperoxidase (MPO, P = 0.27), Alpha-1 antitrypsin (AAT, P = 0.54). (b) Serum marker Intestinal fatty acid binding protein (I-FABP) concentrations stratified by edema status between NS and S (n = 57 cases and 61 controls with one outlier in controls removed; Pnon-edema = 0.029, Pedema = 0.91, Pinteraction = 0.082). c Histograms showing distribution of individual enteropathy marker between NS and S. Concentrations are expressed in wet fecal weight. Vertical line indicates clinical cutoffs for normal marker levels in non-tropical settings (calprotectin: 200 μg/g wet feces, MPO: 2000 ng/ml wet feces, AAT: 270 ug/g wet feces, I-FABP: 450 pg/ml), marker levels above these cutoffs are considered elevated. Unless stated otherwise, n = 68 cases and 68 controls. Each boxplot shows the median (center line), IQR (box limits), and data points with whiskers showing 1.5 times IQR. * P < 0.05.
Fig. 4
Fig. 4. Relation between intestinal disturbances, systemic inflammation, energy metabolism and mortality estimated by PLS path modeling.
Children with both blood and fecal data measured were included in this analysis (n = 51 cases and 42 controls). Latent variables are represented by rounded rectangles. Their corresponding observed manifested indicators and respective loadings are listed underneath. Model goodness of fit = 0.3, R2 = 0.4. Path coefficients above each interconnecting arrow indicate the strength and direction of the relation between nodes of the model. Bootstrap resampling was used to validate significance of path coefficients and 95%CI are presented next to the coefficients. Significant paths are marked by solid arrows (positive and negative associations are denoted by yellow and blue arrows, respectively); tested but insignificant paths are indicated by dashed arrows in light grey. *P < 0.05, ** P < 0.01.

References

    1. Bhutta ZA, et al. Severe childhood malnutrition. Nat. Rev. Dis. Primers. 2017;3:17067. - PMC - PubMed
    1. Kerac M, et al. ‘Severe malnutrition’: Thinking deeplys, communicating simply. BMJ Glob Health. 2020;5:e003023. - PMC - PubMed
    1. Guideline: Updates on the management of severe acute malnutrition in infants and children. World Health Organization, Genevahttps://www.ncbi.nlm.nih.gov/books/NBK190328 (2013). - PubMed
    1. Grenov B, et al. Diarrhea, dehydration, and the associated mortality in children with complicated severe acute malnutrition: A prospective cohort study in uganda. J. Pediatr. 2019;210:26–33. - PubMed
    1. Irena AH, Mwambazi M, Mulenga V. Diarrhea is a major killer of children with severe acute malnutrition admitted to inpatient set-up in lusaka, zambia. Nutrit. J. 2011;10:110. - PMC - PubMed