. 2023 Oct 31;42(10):113176.
doi: 10.1016/j.celrep.2023.113176. Epub 2023 Sep 27.

Targeting MCL-1 triggers DNA damage and an anti-proliferative response independent from apoptosis induction

Affiliations

Targeting MCL-1 triggers DNA damage and an anti-proliferative response independent from apoptosis induction

Utsarga Adhikary et al. Cell Rep. .

Abstract

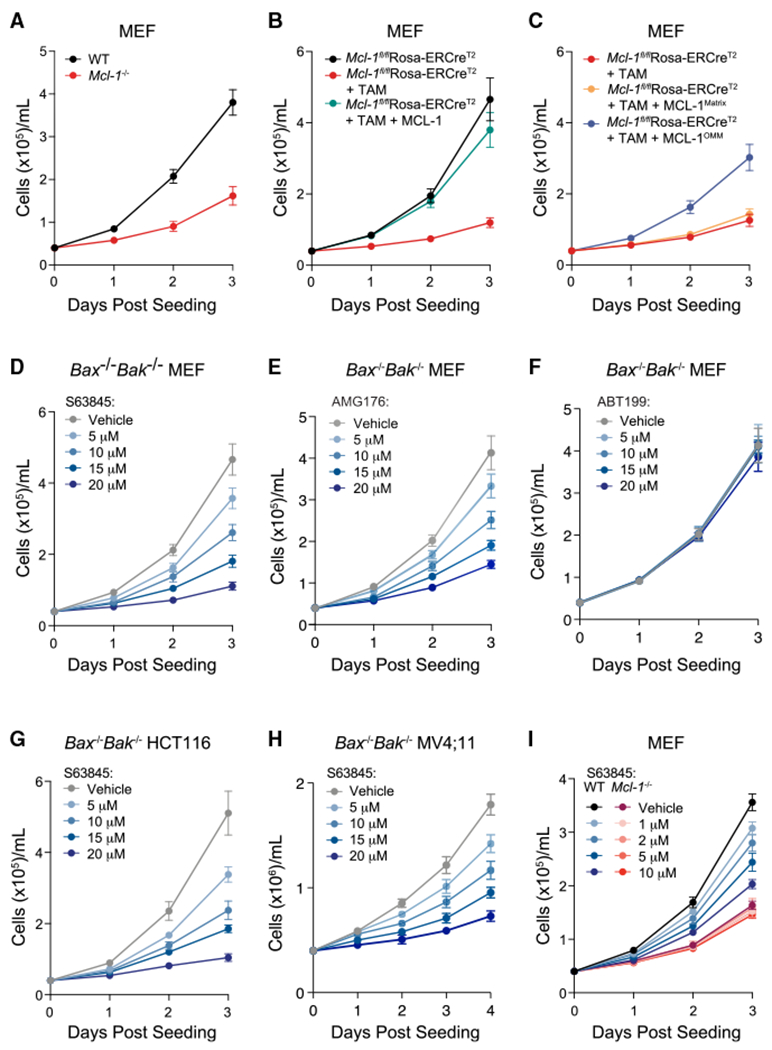
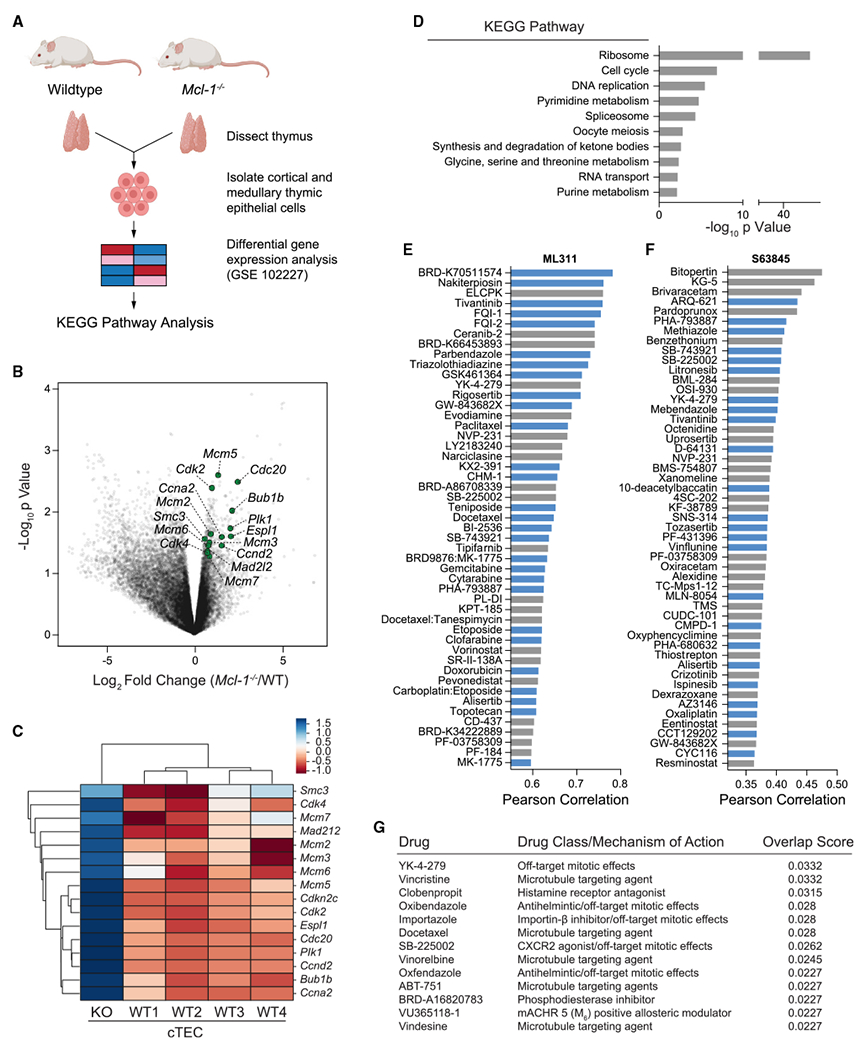
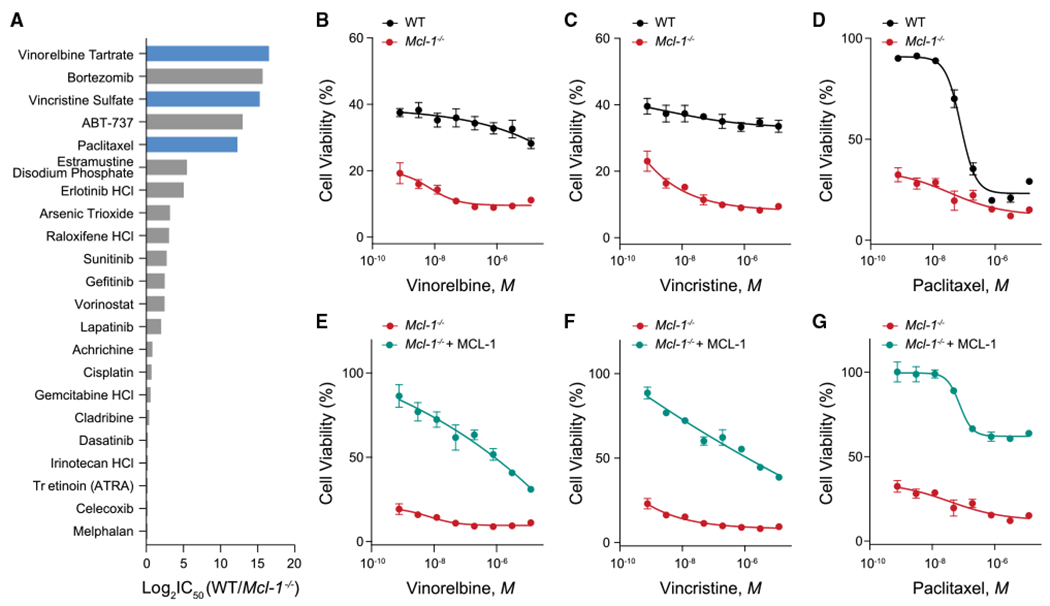
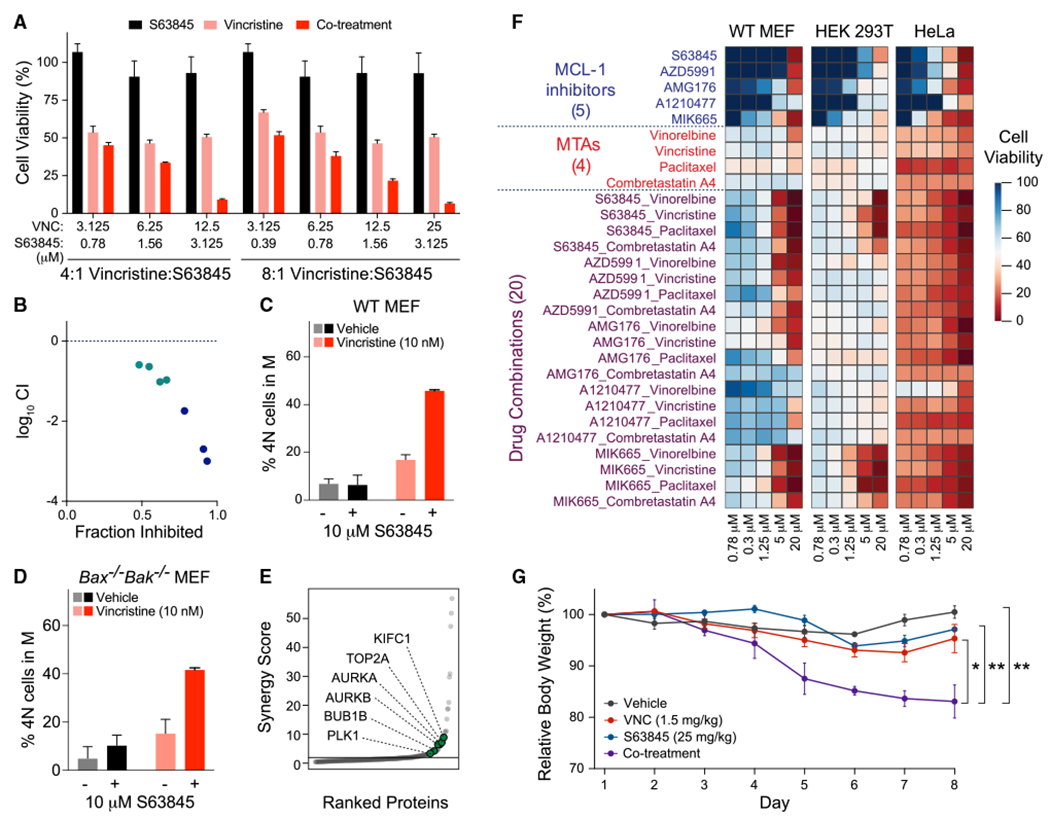
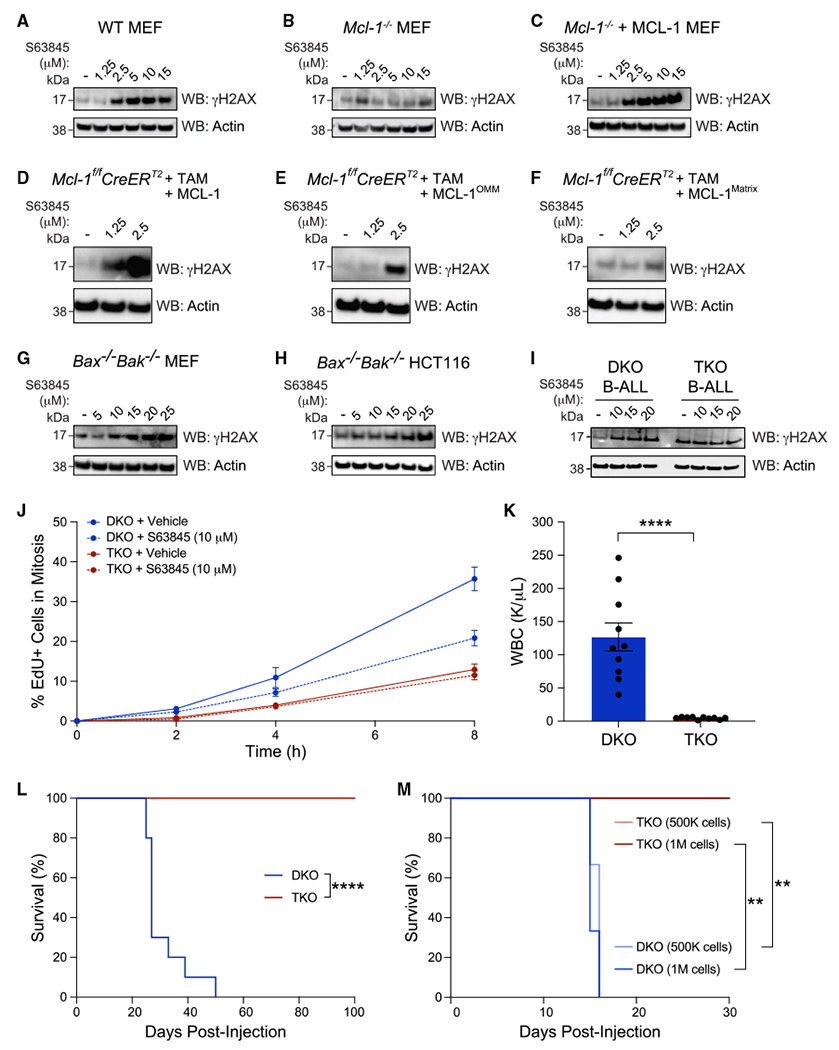
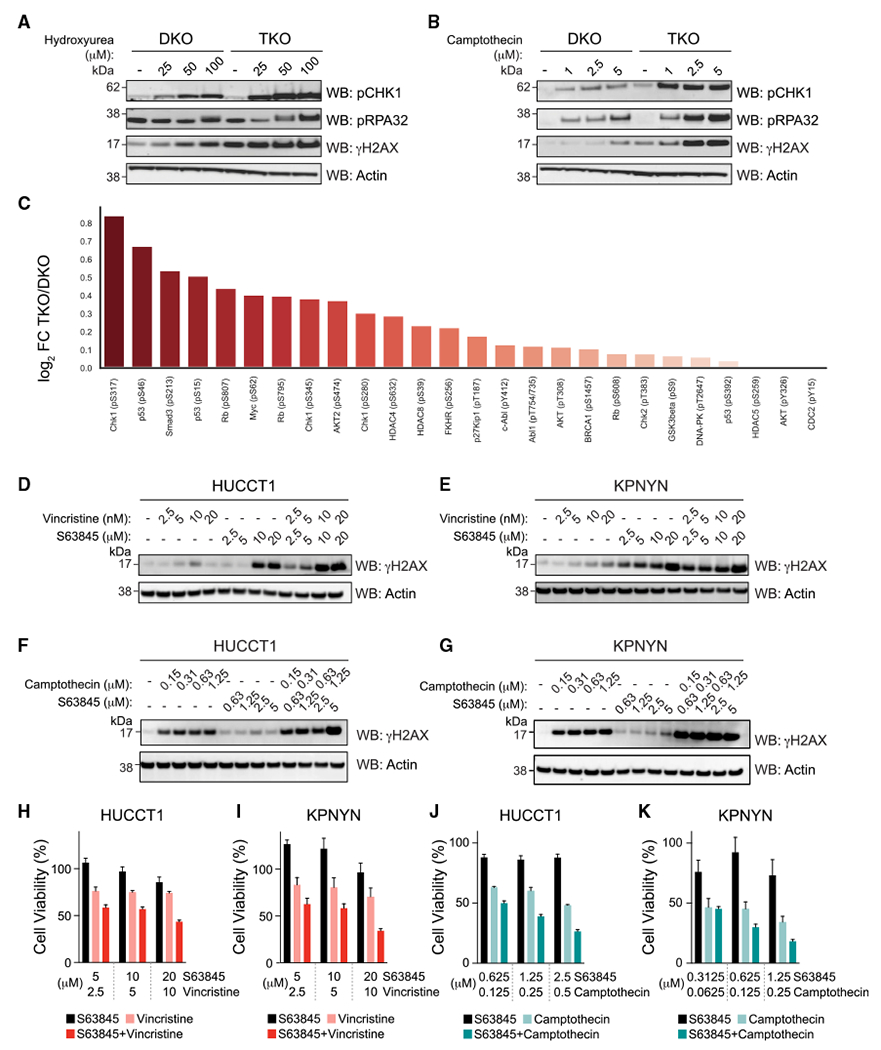
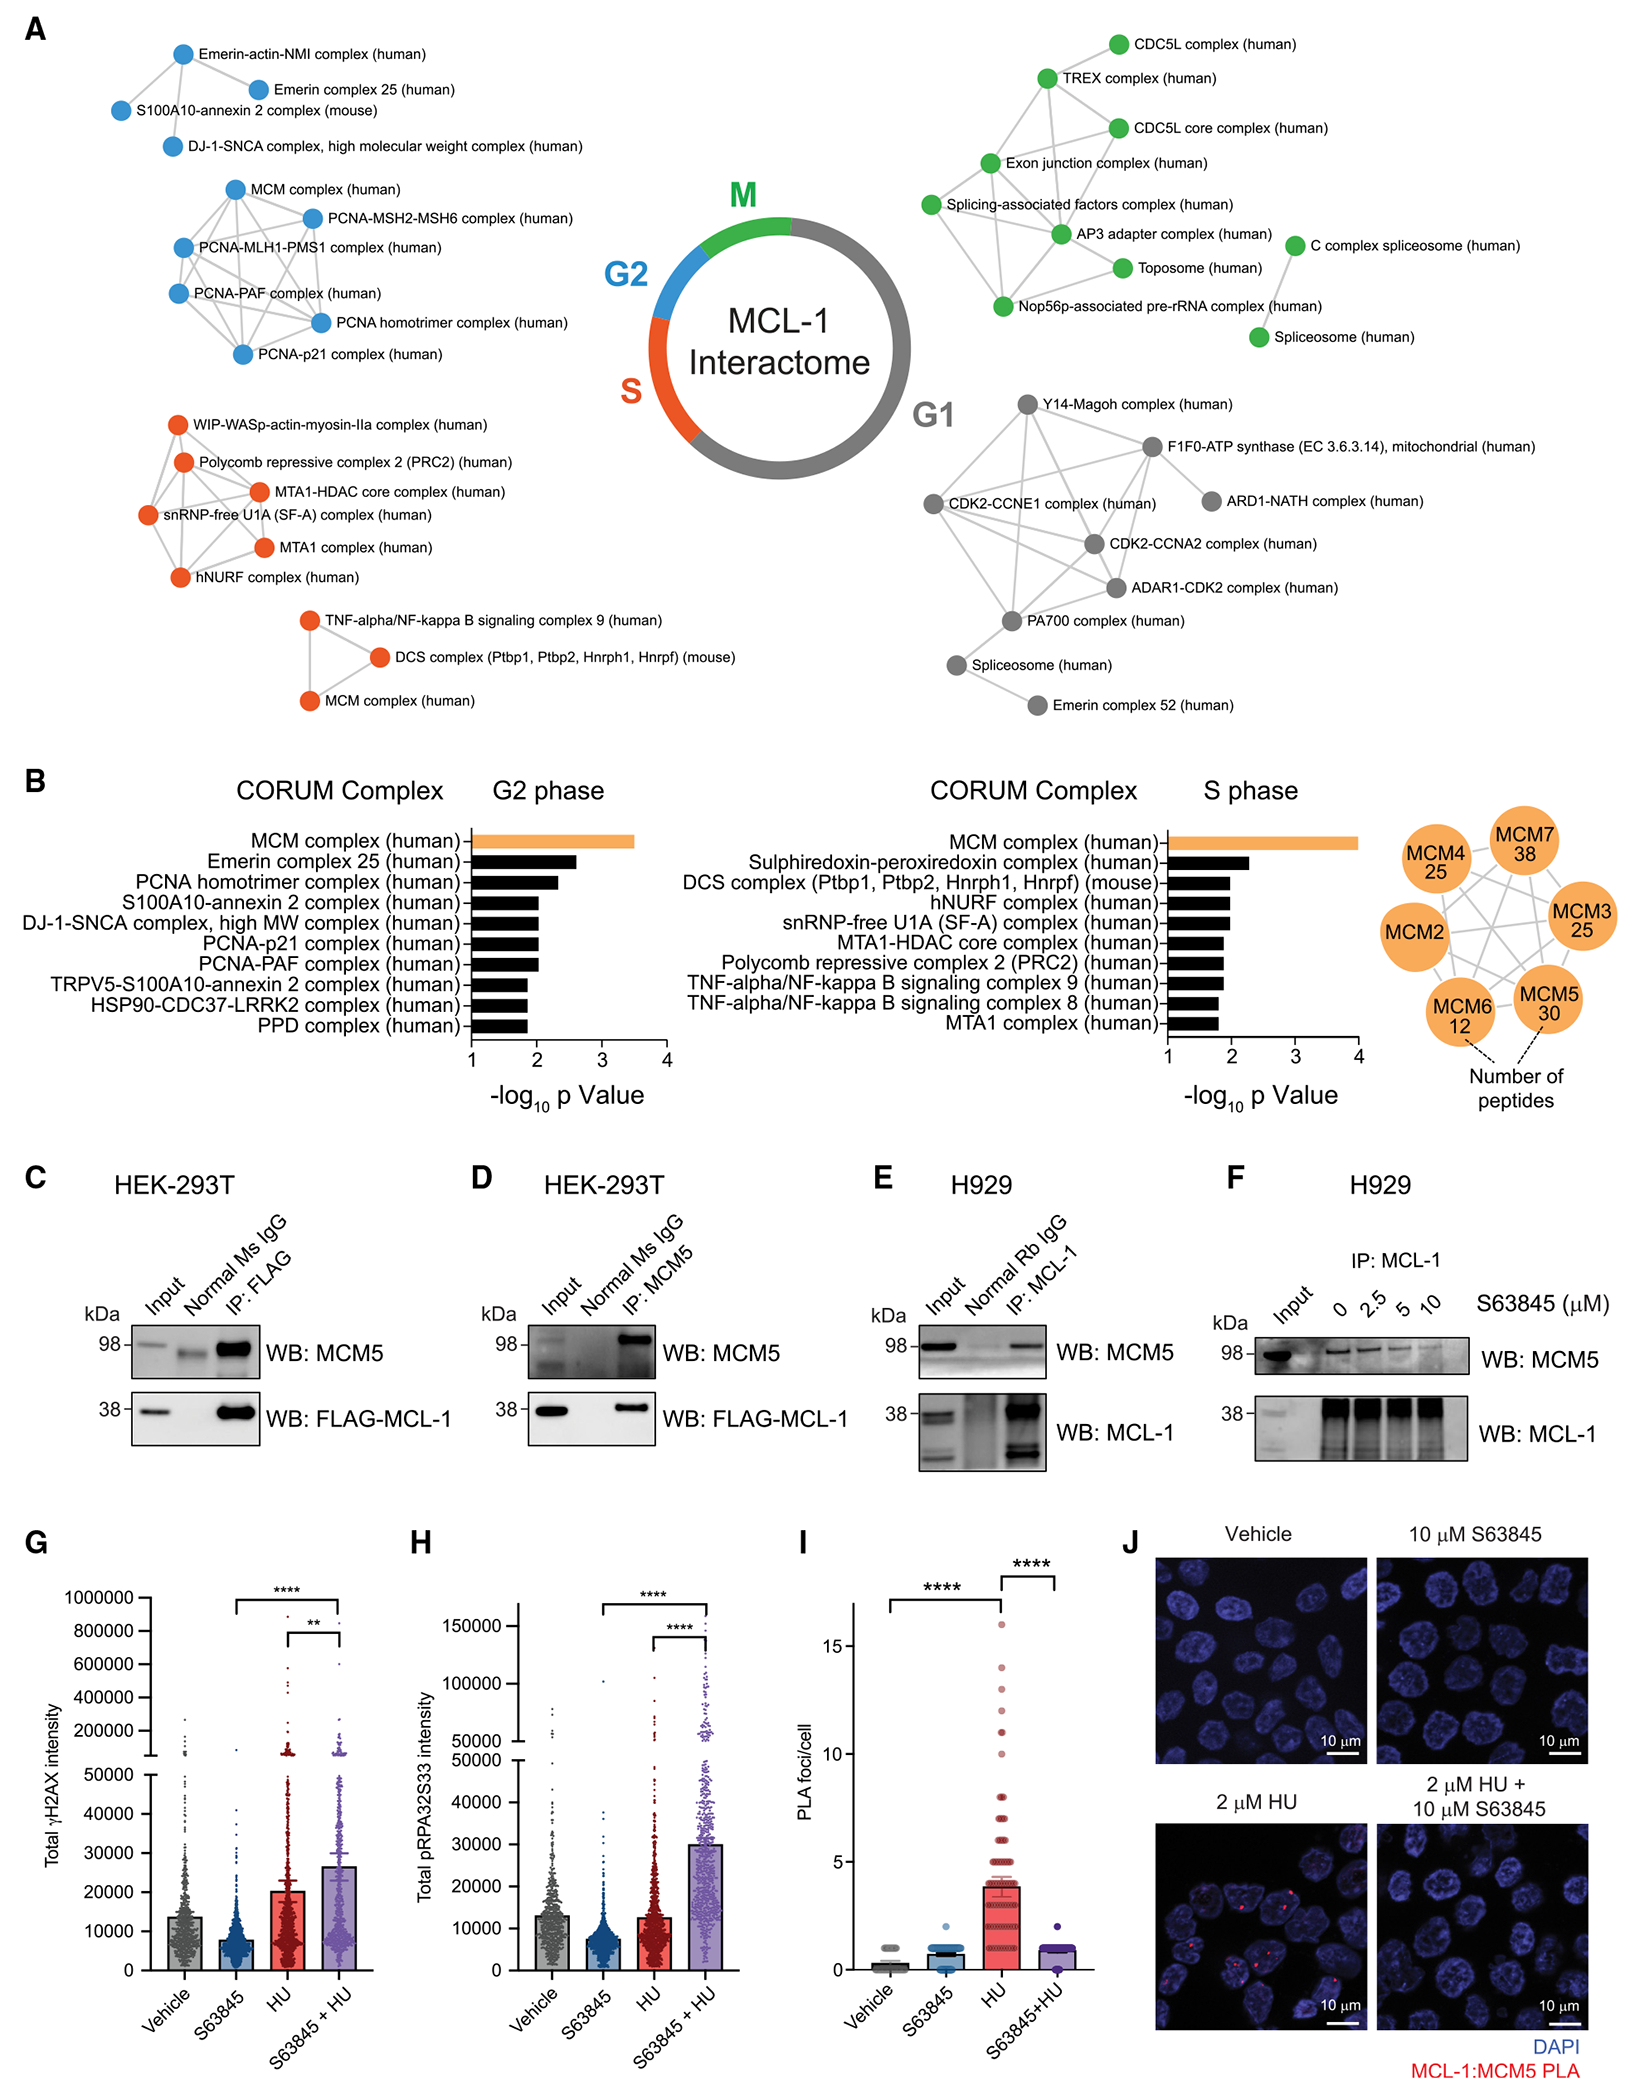
MCL-1 is a high-priority target due to its dominant role in the pathogenesis and chemoresistance of cancer, yet clinical trials of MCL-1 inhibitors are revealing toxic side effects. MCL-1 biology is complex, extending beyond apoptotic regulation and confounded by its multiple isoforms, its domains of unresolved structure and function, and challenges in distinguishing noncanonical activities from the apoptotic response. We find that, in the presence or absence of an intact mitochondrial apoptotic pathway, genetic deletion or pharmacologic targeting of MCL-1 induces DNA damage and retards cell proliferation. Indeed, the cancer cell susceptibility profile of MCL-1 inhibitors better matches that of anti-proliferative than pro-apoptotic drugs, expanding their potential therapeutic applications, including synergistic combinations, but heightening therapeutic window concerns. Proteomic profiling provides a resource for mechanistic dissection and reveals the minichromosome maintenance DNA helicase as an interacting nuclear protein complex that links MCL-1 to the regulation of DNA integrity and cell-cycle progression.

Keywords: BCL-2 family; CP: Cancer; CP: Molecular biology; DNA damage; MCL-1; apoptosis; cancer; cell cycle; cell proliferation; chemotherapy; minichrosome maintenance complex; proteomics.


Conflict of interest statement

Declaration of interests The authors declare no competing interests.

Figures

Figure 1.
Figure 1.. Genetic deletion or pharmacologic targeting of MCL-1 reduces cell proliferation
(A) Chronic deletion of Mcl-1 (red) in mouse embryonic fibroblasts (MEFs) resulted in decreased cell proliferation compared with wild-type cells (black), as monitored by trypan blue staining and cell count. Data are mean ± SD for experiments performed in technical triplicate and conducted twice using independent preparations of cells with similar results. (B). Acute Mcl-1 deletion (red; tamoxifen-treated Mcl-1fl/flRosa-ERCreT2 MEFs) led to a similar decrease in cellular proliferation compared with the corresponding vehicle-treated MEFs (black), as monitored by trypan blue staining and cell count. Reconstitution of MCL-1 restored proliferation to wild-type levels (green). Data are mean ± SD for experiments performed in technical triplicate and conducted twice using independent preparations of cells with similar results. (C) Reconstitution of the outer mitochondrial membrane isoform (MCL-1OMM) (blue) but not the matrix isoform (MCL-1Matrix) (yellow) of MCL-1 in tamoxifen-treated Mcl-1fl/flRosa-ERCreT2 MEFs (red) enhanced cell proliferation, as measured by trypan blue staining and cell count. Of note, the Mcl-1fl/flRosa-ERCreT2 MEF condition shown in (B) (black) was performed simultaneously with (C) experiments and thus serves as the positive control for both (B) and (C). Data are mean ± SD for experiments performed in technical triplicate and conducted twice using independent preparations of cells with similar results. (D–F) Pharmacologic blockade of MCL-1 by S63845 (D) and AMG176 (E), but not BCL-2 by ABT-199 (Venetoclax) (F), caused a dose-responsive decrease in cell proliferation (blue) in Bax−/−Bak−/− MEFs, as measured by trypan blue staining and cell count. Data are mean ± SD for experiments performed in technical triplicate and conducted twice using independent preparations of cells and drug dilutions with similar results. (G–H) Pharmacologic blockade of MCL-1 by S63845 in Bax−/−Bak−/− HCT116 colon carcinoma cells (G) and Bax−/−Bak−/− MV4;11 acute myeloid leukemia cells (H) led to a similar dose- responsive decrease in cell proliferation (blue), as measured by trypan blue staining and cell count. Data are mean ± SD for experiments performed in technical triplicate and conducted twice using independent preparations of cells and S63845 dilutions with similar results. (I) Treatment of wild-type MEFs with S63845 caused a dose-responsive reduction in cell proliferation (blue), whereas Mcl-1−/− MEFs that lack the MCL-1 target were unaffected (red). Data are mean ± SD for experiments performed in technical triplicate and conducted twice using independent preparations of cells and S63845 dilutions with similar results. See also Figures S1 and S2.
Figure 2.
Figure 2.. Correlation between MCL-1 and cell-cycle perturbations across transcriptomic and pharmacologic datasets
(A) Gene expression analysis workflow for comparative analysis of wild-type and Mcl-1 conditionally deleted thymic epithelial cells (GEO dataset GSE102227). (B) Differential gene expression analysis of wild-type and Mcl-1−/− murine cortical thymic epithelial cells, as quantified by log2 fold changes (x axis) and significance (y axis). DNA replication and cell-cycle-related genes with the most differential upregulation upon conditional Mcl-1 deletion are highlighted in green. (C) Clustermap showing the comparative gene expression of select DNA replication and cell-cycle genes in wild-type (WT1-4) vs. Mcl-1−/− (KO) cortical thymic epithelial cells (cTECs). (D) Kyoto Encyclopedia of Genes and Genomes analysis revealed ribosome biogenesis, cell cycle, and DNA replication as the most significantly enriched transcriptomic pathways upon Mcl-1 deletion in murine thymic epithelial cells. (E and F) Selective small-molecule inhibition of MCL-1 by ML311 (E) or S63845 (F) correlates with the pharmacologic profiles of anti-proliferative drugs based on an analysis of sensitivity data of ~500 drugs across the Cancer Cell Line Encyclopedia (CTRP v2.0, Broad Institute). Compounds with established anti-proliferative and anti-mitotic effects are colored in blue. (G) The gene expression signature of conditional Mcl-1 deletion in murine thymic epithelial cells (GEO dataset GSE102227) correlates with that of pharmacologic treatment with microtubule-targeting and anti-mitotic agents (L1000CDS database). See also Figure S3.
Figure 3.
Figure 3.. Hypersensitivity of Mcl-1−/− MEFs to microtubule-targeting agents
(A) The microtubule-targeting agents vinorelbine, vincristine, and paclitaxel (blue) were among the top hits in a screen of FDA-approved chemotherapeutics that demonstrated selectively increased cytotoxicity upon Mcl-1 deletion, clustering with the positive control compoundsABT-737 and bortezomib. Log2 fold change values were generated from the ratio of the mean of technical replicates for cell viability measurements of WT vs. Mcl-1−/− MEFs in response to the indicated chemotherapeutics. (B–D) Heightened susceptibility of Mcl-1−/− MEFs to vinorelbine (B), vincristine (C), and paclitaxel (D) compared with wild-type MEFs by cell viability (Cell TiterGlo) assay measured after 48 h of drug treatments. Data are mean ± SD for experiments performed in technical triplicate and conducted twice using independent preparations of cells and drugs with similar results. (E–G) Reconstitution of Mcl-1−/− MEFs with MCL-1 restored the relative resistance to MTAs seen in wild-type MEFs, as measured by cell viability (Cell TiterGlo) assay after 48 h of drug treatments. Data are mean ± SD for experiments performed in technical triplicate and conducted twice using independent preparations of cells and drugs with similar results. See also Figure S4.
Figure 4.
Figure 4.. Combinatorial targeting of MCL-1 and microtubules causes synergistic cytotoxicity that correlates with mitotic arrest independent of apoptosis induction
(A and B) Pharmacologic inhibition of MCL-1 by S63845 phenocopies Mcl-1 deletion in sensitizing wild-type MEFs to vincristine treatment (A), with Calcusyn analysis documenting a synergistic response (B). Data are mean ± SD for cell viability experiments (Cell TiterGlo assay) performed after 48 h of drug treatments in technical triplicate and conducted twice using independent preparations of cells and drugs with similar results. (C and D) S63845 and vincristine combination treatment (16 h) caused mitotic arrest in wild-type MEFs (C), an effect that was independent of apoptosis, as demonstrated by replication of the finding in Bax−/−Bak−/− MEFs (D). Data are mean ± SD for experiments performed in technical duplicate and conducted twice using independent preparations of cells and drugs with similar results. (E) Synergy scoring of protein abundances in wild-type MEFs treated with the S63845-vincristine combination for 16 h revealed selective upregulation of key proteins involved in the M phase, including KIFC1, TOP2A, AURKA, AURKB, BUB1, and PLK1. (F) Enhanced cytotoxicity, as measured by Cell TiterGlo assay, upon combining a series of MCL-1 inhibitors and MTAs for 48 h of treatment, with relatively increased susceptibility in HeLa (cancer) cells compared with MEFs and HEK293T (non-cancer) cells. The heatmap was generated based on percent cell viability at the indicated doses, with experiments performed in technical triplicate. (G) C57BL/6J 8-week-old female mice (n = 4 per arm) were treated intraperitoneally with either vehicle (PBS), S63845 (25 mg/kg) administered daily for 5 consecutive days, vincristine (1.5 mg/kg) administered once every 3 days (twice weekly), or the drug combination. Mice that received the drug combination demonstrated a statistically significant reduction in body weight compared with mice receiving vehicle or single-agent treatments. Error bars are mean ± SEM of body weights measured in four mice per treatment arm. See also Figures S2N, S5, and S6.
Figure 5.
Figure 5.. Genetic deletion or pharmacologic targeting of MCL-1 induces DNA damage independent of apoptosis resulting in a growth disadvantage in vivo
(A–C) Treatment with the selective MCL-1 inhibitor S63845 dose-responsively induced gH2AX levels in wild-type MEFs (A) but had no such effect in the absence of the MCL-1 target (B). Reconstitution of Mcl-1−/− MEFs with wild-type MCL-1 restored dose-responsive γH2AX induction upon S63845 treatment (C). The experiment was conducted twice using independent preparations of cells and drugs with similar results. (D–F) S63845 induced a dose-responsive increase of γH2AX levels in tamoxifen-treated Mcl-1fl/flRosa-ERCreT2 MEFs reconstituted with either wild-type MCL-1 or its OMM isoform (E), whereas no such effect was observed upon reconstitution with the matrix isoform (F). The experiment was conducted twice using independent preparations of cells and drugs with similar results. (G–H) S63845 likewise induced a dose-responsive increase in γH2AX levels in the absence of an intact mitochondrial apoptosis pathway, as demonstrated in Bax−/−Bak−/− MEFs (G) and Bax−/−Bak−/− HCT116 cells (H). The experiment was conducted twice using independent preparations of cells and drugs with similar results. (I) γH2AX levels were induced upon S63845 treatment of Bax−/−Bak−/− B-ALL (DKO) cells. Upon further deletion of Mcl-1 (TKO), basal levels of γH2AX were markedly increased compared with DKO cells and S63845 treatment had no effect, consistent with the absence of the MCL-1 drug target. The experiment was conducted twice using independent preparations of cells and drugs with similar results. (J) Genetic deletion of Mcl-1 impeded S-to-M progression independent of apoptosis (TKO) (compare solid red and blue lines). Treatment of DKO cells with the selective MCL-1 inhibitor S63845 phenocopied this effect (compare solid blue and dotted blue lines). As a control, S63845 treatment had no effect on the TKO cells that lack the MCL-1 drug target (compare solid red and dotted red lines). Data are mean ± SD for experiments performed in technical duplicate and conducted twice using independent preparations of cells and drugs with similar results. (K) DKO or TKO B-ALL cells (2.5 × 10⁵) were injected by tail vein into C57BL/6J 8-week-old female mice (n = 10 per arm) and complete blood counts (CBCs) performed on terminal bleeds at the time of euthanasia (period of 25–50 days post injection for DKO and day 105 for TKO), revealing markedly elevated white blood cell counts in DKO compared with TKO mice (n = 10 mice per arm, p < 0.0001). (L) Kaplan-Meier plots demonstrated that mice injected with DKO B-ALL cells (250,000 cells) died between 25 and 50 days post injection, whereas no evidence of leukemia was detected in mice injected with TKO B-ALL cells even after 15 weeks, as monitored by weekly CBC (n = 10 mice per arm, p < 0.0001). (M) Injection with higher doses of leukemia cells (5 × 10⁵ and 1 × 10⁶) resulted in an even earlier onset of leukemic death for mice injected with DKO B-ALL cells, whereas no leukemia was evident by 30 days in mice injected with TKO B-ALL cells, as monitored by weekly CBC (n = 3 mice per arm, p < 0.01). See also Figures S7 and S8.
Figure 6.
Figure 6.. Chemotherapy-induced DNA damage is compounded by genetic deletion or pharmacologic targeting of MCL-1
(A and B) p185+Arf−/−Bax−/−Bak−/−Mcl-1−/− B-ALL cells (TKO) were more susceptible than p185+Arf−/−Bax−/−Bak−/− B-ALL cells (DKO) to DNA damage upon treatment with hydroxyurea (A) and camptothecin (B) for 24 h, as demonstrated by relatively increased levels of pRPA32, pCHK1, and γH2AX levels. The experiment was conducted twice using independent preparations of cells and drugs with similar results. (C) Comparative phosphorylation profiling of DKO vs. TKO cells treated with 50 μM hydroxyurea for 8 h. TKO samples were notably enriched for phosphopeptides that correspond to phosphorylation sites on key proteins that respond to DNA damage and replicative stress, such as CHK1 and p53. The experiment was performed in technical sextuplicate. (D and E) Pharmacologic inhibition of MCL-1 in combination with vincristine for 16 h increased γH2AX levels compared with single-agent treatments in HUCCT1 (D) and KPNYN (E) cancer cells, which express MCL-1 but are not exclusively dependent on MCL-1 for survival. The experiment was conducted twice using independent preparations of cells and drugs with similar results. (F and G) Pharmacologic inhibition of MCL-1 in combination with camptothecin for 16 h likewise increased gH2AX levels compared with single-agent treatments in HUCCT1 (F) and KPNYN (G) cancer cells. The experiment was conducted twice using independent preparations of cells and drugs with similar results. (H and I) Combination treatment with S63845 and vincristine for 48h resulted in enhanced cytotoxicity compared with single-agent treatments of HUCCT1 (H) and KPNYN (I) cell lines. Data are mean ± SD for cell viability (Cell TiterGlo assay) experiments performed in technical triplicate and conducted twice using independent preparations of cells and drugs with similar results. (J and K) Combination treatment with S63845 and camptothecin for 48 h resulted in enhanced cytotoxicity compared with single-agent treatments of HUCCT1 (J) and KPNYN (K) cell lines. Data are mean ± SD for cell viability (Cell TiterGlo assay) experiments performed in technical triplicate and conducted twice using independent preparations of cells and drugs with similar results. See also Figure S7.
Figure 7.
Figure 7.. The MCL-1 interactome across stages of the cell cycle reveals candidate complexes that regulate DNA replication and cell division
(A) Analysis of AE-MS data identified established MCL-1 interactors such as BAX, BAK, PCNA, and CDK1 (Figure S9A), as well as a series of unanticipated MCL-1 interactors, including nuclear complexes, across distinct stages of the cell cycle. Four biological replicates of the AE-MS experiments were performed. (B) Cross-referencing AE-MS interaction data for each cell-cycle stage with the CORUM complex database revealed the minichromosome maintenance (MCM) complex as one of the most enriched complexes associated with MCL-1 in the S and G2 phases. All six members of the MCM complex (MCM27) co-immunoprecipitated with FLAG-MCL-1 from HEK293T cellular lysates. (C and D) Reciprocal co-immunoprecipitation of FLAG-MCL-1 and MCM5 from HEK293T lysates using either FLAG (D) or MCM5 (E) antibodies. (E) Co-immunoprecipitation of native MCL-1 and MCM5 from lysates of MCL-dependent H929 cells using an MCL-1 antibody. (F) S36845 treatment dose-responsively disrupted co-immunoprecipitation of native MCL-1 and MCM5 from lysates of H929 cells using an MCL-1 antibody. (G and H) S63845 and hydroxyurea co-treatment exacerbated replicative stress independent of apoptosis, as demonstrated by increased induction of γH2AX (E) and S33 phoshorylation of RPA32 (H) relative to single-agent treatments in Bax−/−Bak−/− HCT116 cells. Data are mean ± 95% CI for gH2AXand pRPA32S33 intensity values from >500 individual cells per treatment condition. The experiment was conducted twice using independent preparations of cells and drugs, with similar results. (I) MCL1 interacts with MCM5 upon hydroxyurea treatment of Bax−/−Bak−/− HCT116 cells, as demonstrated by increased number of MCL-1:MCM5 proximity ligation assay (PLA) foci. The interaction was blocked upon pharmacologic inhibition of MCL-1 by S63845, resulting in ~80% reduction in the average number of PLA foci per cell. Data are mean ± 95% CI for γH2AX and pRPA32S33 intensity values from >50 individual cells per treatment condition. (J) Representative images of MCL-1:MCM5 PLA foci (red) in Bax−/−Bak−/− HCT116 cells subjected to vehicle (0.1% DMSO), 10 μM S63845, 2 μM hydroxyurea, or co-treatment with 10 μM S63845 and 2 μM hydroxyurea. See also Figures S9–S13.

References

    1. Green DR (2022). The Mitochondrial Pathway of Apoptosis Part II: The BCL-2 Protein Family. Cold Spring Harb. Perspect. Biol 14, a041046. 10.1101/cshperspect.a041046. - DOI - PMC - PubMed
    1. Reynolds JE, Yang T, Qian L, Jenkinson JD, Zhou P, Eastman A, and Craig RW (1994). Mcl-1, a member of the Bcl-2 family, delays apoptosis induced by c-Myc overexpression in Chinese hamster ovary cells. Cancer Res. 54, 6348–6352. - PubMed
    1. Day CL, Chen L, Richardson SJ, Harrison PJ, Huang DCS, and Hinds MG (2005). Solution structure of prosurvival Mcl-1 and characterization of its binding by proapoptotic BH3-only ligands. J. Biol. Chem 280, 4738–4744. 10.1074/jbc.M411434200. - DOI - PubMed
    1. Cheng EH, Wei MC, Weiler S, Flavell RA, Mak TW, Lindsten T, and Korsmeyer SJ (2001). BCL-2, BCL-X(L) sequester BH3 domain-only molecules preventing BAX- and BAK-mediated mitochondrial apoptosis. Mol. Cell 8, 705–711. 10.1016/s1097-2765(01)00320-3. - DOI - PubMed
    1. Letai A, Bassik MC, Walensky LD, Sorcinelli MD, Weiler S, and Korsmeyer SJ (2002). Distinct BH3 domains either sensitize or activate mitochondrial apoptosis, serving as prototype cancer therapeutics. Cancer Cell 2, 183–192. 10.1016/s1535-6108(02)00127-7. - DOI - PubMed

Publication types

MeSH terms

Substances

LinkOut - more resources