Single-cell analysis of 5-aminolevulinic acid intraoperative labeling specificity for glioblastoma
- PMID: 37773782
- PMCID: PMC10535619
- DOI: 10.3171/2023.7.JNS23122
Single-cell analysis of 5-aminolevulinic acid intraoperative labeling specificity for glioblastoma
Abstract
Objective: Glioblastoma (GBM) is the most common and aggressive malignant primary brain tumor, and resection is a key part of the standard of care. In fluorescence-guided surgery (FGS), fluorophores differentiate tumor tissue from surrounding normal brain. The heme synthesis pathway converts 5-aminolevulinic acid (5-ALA), a fluorogenic substrate used for FGS, to fluorescent protoporphyrin IX (PpIX). The resulting fluorescence is believed to be specific to neoplastic glioma cells, but this specificity has not been examined at a single-cell level. The objective of this study was to determine the specificity with which 5-ALA labels the diversity of cell types in GBM.
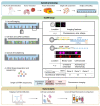
Methods: The authors performed single-cell optical phenotyping and expression sequencing-version 2 (SCOPE-seq2), a paired single-cell imaging and RNA sequencing method, of individual cells on human GBM surgical specimens with macroscopically visible PpIX fluorescence from patients who received 5-ALA prior to surgery. SCOPE-seq2 allowed the authors to simultaneously image PpIX fluorescence and unambiguously identify neoplastic cells from single-cell RNA sequencing. Experiments were also conducted in cell culture and co-culture models of glioma and in acute slice cultures from a mouse glioma model to investigate cell- and tissue-specific uptake and secretion of 5-ALA and PpIX.
Results: SCOPE-seq2 analysis of human GBM surgical specimens revealed that 5-ALA treatment resulted in labeling that was not specific to neoplastic glioma cells. The cell culture further demonstrated that nonneoplastic cells could be labeled by 5-ALA directly or by PpIX secreted from surrounding neoplastic cells. Acute slice cultures from mouse glioma models showed that 5-ALA preferentially labeled GBM tumor tissue over nonneoplastic brain tissue with significant labeling in the tumor margins, and that this contrast was not due to blood-brain barrier disruption.
Conclusions: Together, these findings support the use of 5-ALA as an indicator of GBM tissue but question the main advantage of 5-ALA for specific intracellular labeling of neoplastic glioma cells in FGS. Further studies are needed to systematically compare the performance of 5-ALA to that of potential alternatives for FGS.
Keywords: fluorescence-guided surgery; glioblastoma; glioma; oncology; single-cell genomics; tumor.
Conflict of interest statement
Ms. Liu reported a patent for WO/2020/264387 pending. Dr. Sims reported personal fees from Guardant Health outside the submitted work; in addition, Dr. Sims has a patent for WO/2020/264387 pending, a patent for WO/2016/191533A1 pending, and a patent for WO/2019/104337A1 pending.
Figures


Comment in
-
Letter to the Editor. ALA in the treatment of glioblastoma.J Neurosurg. 2024 Jan 19;140(5):1511-1512. doi: 10.3171/2023.11.JNS232472. Print 2024 May 1. J Neurosurg. 2024. PMID: 38241668 No abstract available.
-
Letter to the Editor. Decoding GBM: a singular insight into the precision of 5-ALA through single-cell analysis.J Neurosurg. 2024 Feb 9;140(5):1512-1513. doi: 10.3171/2023.12.JNS232708. Print 2024 May 1. J Neurosurg. 2024. PMID: 38335516 No abstract available.
References
-
- Stupp R, Mason WP, van den Bent MJ, et al. Radiotherapy plus concomitant and adjuvant temozolomide for glioblastoma. N Engl J Med. 2005;352(10):987–996. - PubMed
-
- Lacroix M, Abi-Said D, Fourney DR, et al. A multivariate analysis of 416 patients with glioblastoma multiforme: prognosis, extent of resection, and survival. J Neurosurg. 2001;95(2):190–198. - PubMed
-
- Sanai N, Polley MY, McDermott MW, Parsa AT, Berger MS. An extent of resection threshold for newly diagnosed glioblastomas. J Neurosurg. 2011;115(1):3–8. - PubMed
Publication types
MeSH terms
Substances
Grants and funding
LinkOut - more resources
Full Text Sources
Medical

