

Global burden and inequality of maternal and neonatal disorders: based on data from the 2019 Global Burden of Disease study
- PMID: 37773990
- PMCID: PMC10849872
- DOI: 10.1093/qjmed/hcad220
Global burden and inequality of maternal and neonatal disorders: based on data from the 2019 Global Burden of Disease study
Abstract
Background: Maternal and neonatal disorders account for substantial health loss across the lifespan from early childhood. These problems may be related to health inequality.
Aim: To provide evidence for improvement in health policies regarding maternal and neonatal disorder inequity.
Design: This was a population-based cross-sectional study based on 2019 Global Burden of Disease data.
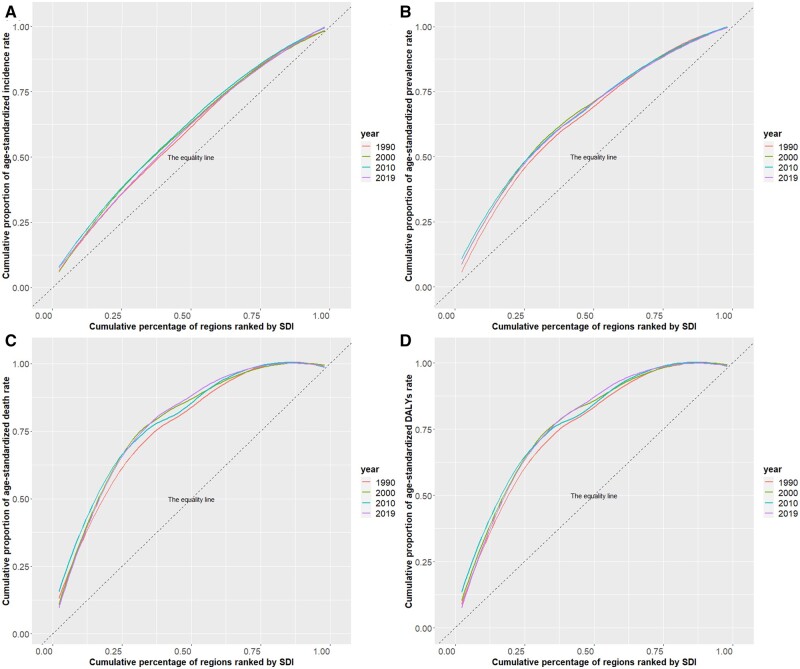
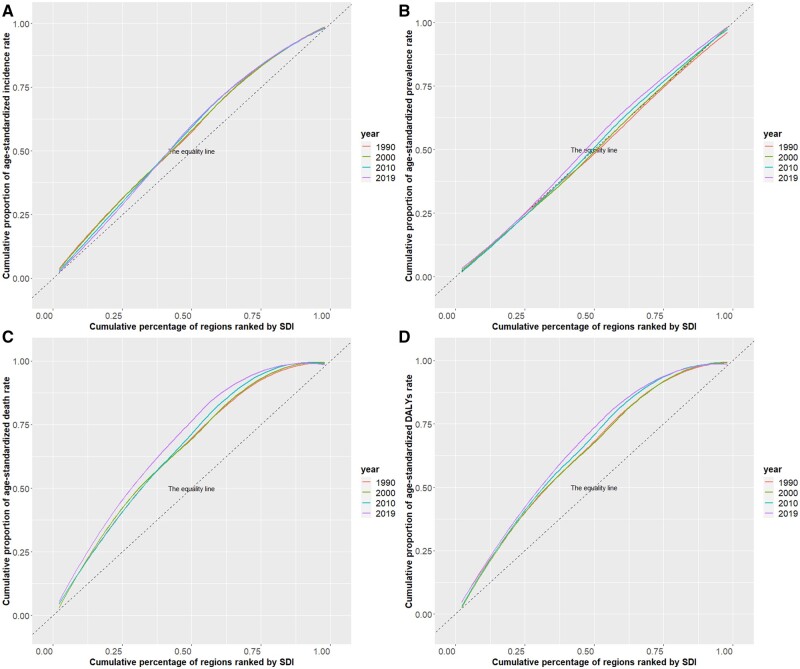
Methods: Annual cases and age-standardized rates (ASRs) of incidence, prevalence, death, and disability-adjusted life-years (DALYs) in maternal and neonatal disorders between 1990 and 2019 were collected from the 2019 Global Burden of Disease study. Concentration curves and concentration indices were used to summarize the degree of socioeconomic-related inequality.
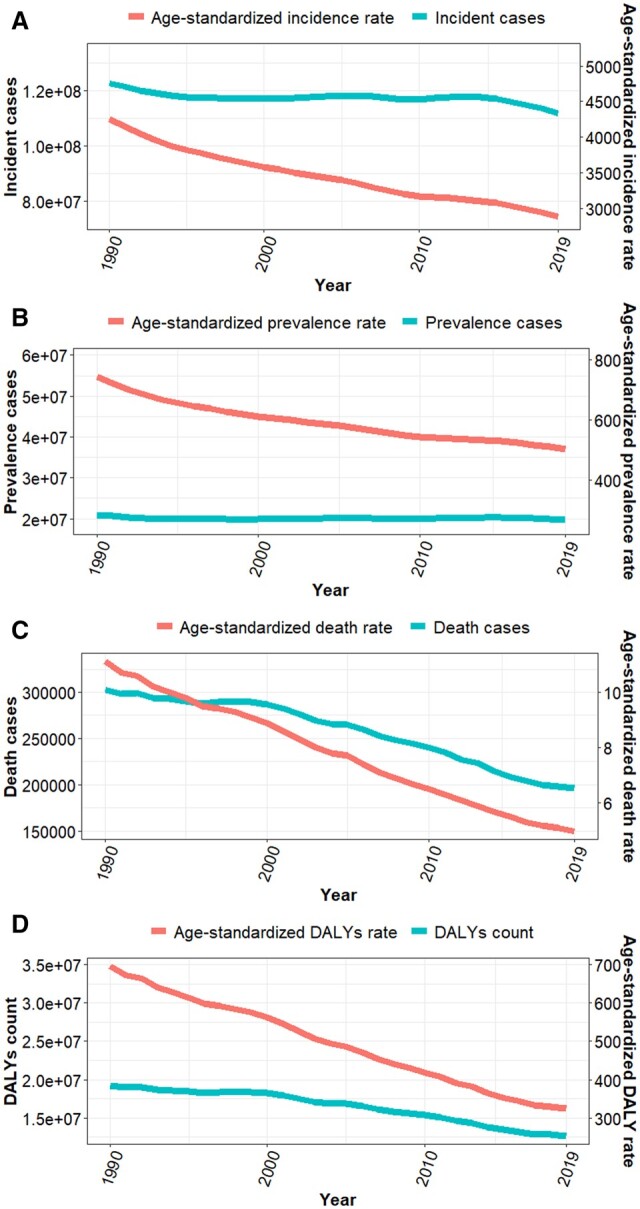
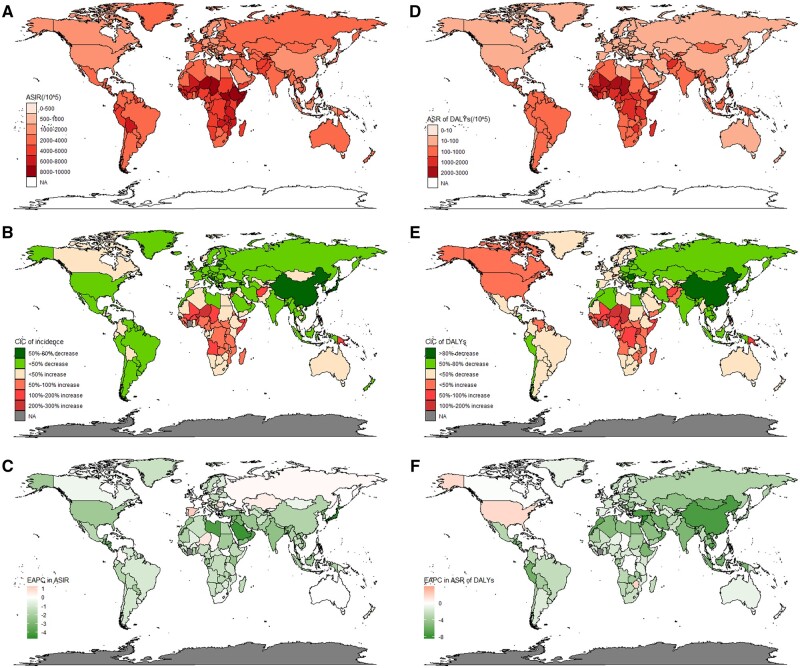
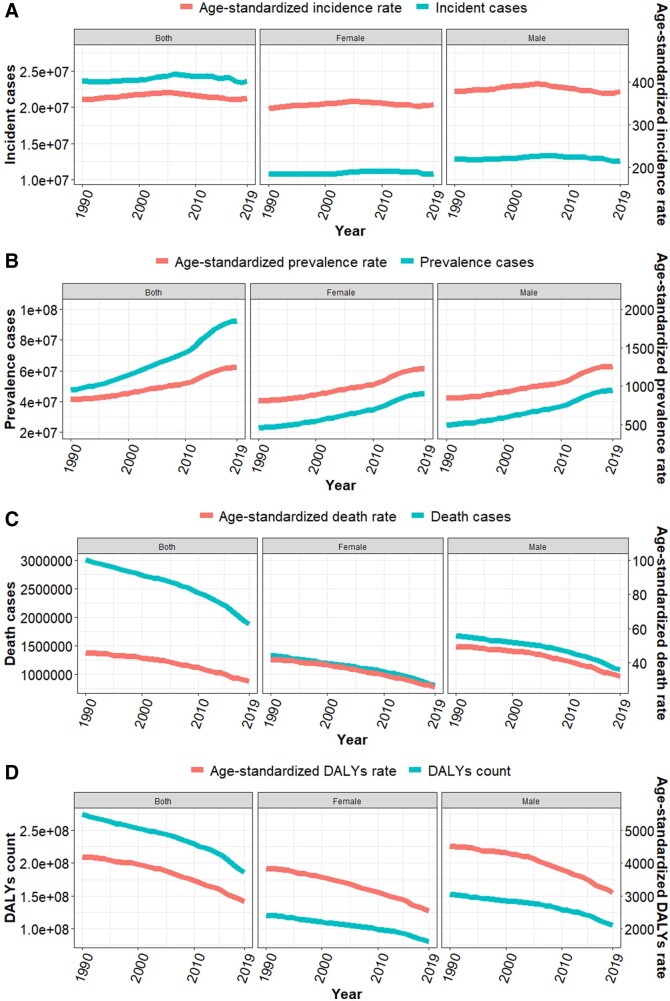
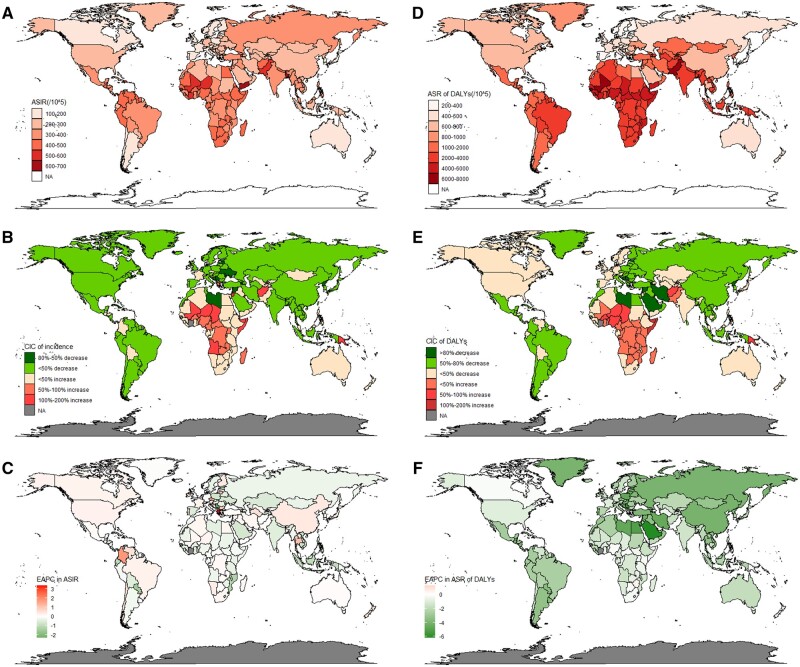
Results: For maternal disorders, the global ASRs of incidence, prevalence, death and DALYs were 2889.4 (95% uncertainty interval (UI), 2562.9-3251.9), 502.9 (95% UI 418.7-598.0), 5.0 (95% UI 4.4-5.8) and 324.9 (95% UI 284.0-369.1) per 100 000 women in 2019, respectively. The ASRs of maternal disorders were all obviously reduced and remained pro-poor from 1990 to 2019. In neonatal disorders, the global ASRs of incidence, prevalence, death and DALYs were 363.3 (95% UI 334.6-396.8), 1239.8 (95% UI 1142.1-1356.7), 29.1 (95% UI 24.8-34.5) and 2828.3 (95% UI 2441.6-3329.6) per 100 000 people in 2019, respectively. The global ASRs of incidence, death and DALYs in neonatal disorders have remained pro-poor. However, the socioeconomic-related fairness in the ASR of neonatal disorder prevalence is being levelled.
Conclusions: The global burden of maternal and neonatal disorders has remained high, and socioeconomic-related inequality (pro-poor) tended not to change between 1990 and 2019.
© The Author(s) 2023. Published by Oxford University Press on behalf of the Association of Physicians.
Conflict of interest statement
All authors declare that there is no conflict of interest.
Figures
Similar articles
-
The global burden, risk and inequality of maternal obstructed labor and uterine rupture from 1990 to 2019.BMC Public Health. 2024 Jul 29;24(1):2017. doi: 10.1186/s12889-024-19429-2. BMC Public Health. 2024. PMID: 39075414 Free PMC article.
-
Trends in the prevalence and disability-adjusted life years of eating disorders from 1990 to 2017: results from the Global Burden of Disease Study 2017.Epidemiol Psychiatr Sci. 2020 Dec 7;29:e191. doi: 10.1017/S2045796020001055. Epidemiol Psychiatr Sci. 2020. PMID: 33283690 Free PMC article.
-
Global, regional, and national burden of 12 mental disorders in 204 countries and territories, 1990-2019: a systematic analysis for the Global Burden of Disease Study 2019.Lancet Psychiatry. 2022 Feb;9(2):137-150. doi: 10.1016/S2215-0366(21)00395-3. Epub 2022 Jan 10. Lancet Psychiatry. 2022. PMID: 35026139 Free PMC article.
-
Prevalence, Deaths, and Disability-Adjusted Life Years Due to Musculoskeletal Disorders for 195 Countries and Territories 1990-2017.Arthritis Rheumatol. 2021 Apr;73(4):702-714. doi: 10.1002/art.41571. Epub 2021 Feb 22. Arthritis Rheumatol. 2021. PMID: 33150702
-
Burden of Neurological Disorders Across the US From 1990-2017: A Global Burden of Disease Study.JAMA Neurol. 2021 Feb 1;78(2):165-176. doi: 10.1001/jamaneurol.2020.4152. JAMA Neurol. 2021. PMID: 33136137 Free PMC article.
Cited by
-
The global burden of maternal disorders attributable to iron deficiency related sub-disorders in 204 countries and territories: an analysis for the Global Burden of Disease study.Front Public Health. 2024 Sep 5;12:1406549. doi: 10.3389/fpubh.2024.1406549. eCollection 2024. Front Public Health. 2024. PMID: 39310906 Free PMC article.
-
Global burden, trends and inequalities of maternal hypertensive disorders among reproductive-age women of advanced maternal age, 1990-2021: a population-based study.Front Glob Womens Health. 2025 Mar 6;6:1513909. doi: 10.3389/fgwh.2025.1513909. eCollection 2025. Front Glob Womens Health. 2025. PMID: 40115386 Free PMC article.
-
Disability-adjusted life years, years lived with disability, and years of life lost of diseases among children and adolescents in national and subnational levels of Iran, 1990-2021: A systematic analysis for the Global Burden of Disease 2021.PLoS One. 2025 Jun 23;20(6):e0325085. doi: 10.1371/journal.pone.0325085. eCollection 2025. PLoS One. 2025. PMID: 40549740 Free PMC article.
-
The global burden, risk and inequality of maternal obstructed labor and uterine rupture from 1990 to 2019.BMC Public Health. 2024 Jul 29;24(1):2017. doi: 10.1186/s12889-024-19429-2. BMC Public Health. 2024. PMID: 39075414 Free PMC article.
-
Global, regional, and national burden of maternal disorders, 1990-2021: a systematic analysis from the global burden of disease study 2021.BMC Public Health. 2025 Jul 29;25(1):2576. doi: 10.1186/s12889-025-23814-w. BMC Public Health. 2025. PMID: 40730990 Free PMC article.
References
-
- United Nations. Millennium Development Goals. http://www.un.org/millenniumgoals/bkgd.shtml (10 December 2015, date last accessed).
-
- Centers for Disease Control and Prevention (US). Maternal and Infant Health. http://www.cdc.gov/reproductivehealth/maternalinfanthealth/ (17 December 2015, date last accessed).
-
- UNFPA, World Health Organization, UNICEF, World Bank Group, the United Nations Population Division. Trends in Maternal Mortality 2000-2017. Estimates by WHO, UNICEF, UNFPA, World Bank Group and the United Nations Population Division. 2019, 104.
-
- Lawn JE, Cousens S, Zupan J; Lancet Neonatal Survival Steering Team. 4 Million neonatal deaths: when? Where? Why? Lancet 2005; 365:891–900. - PubMed
MeSH terms
Grants and funding
- CDFYCX202202/Clinical Medical college & Affiliated hospital of Chengdu University
- Y202232/Clinical Medical college & Affiliated hospital of Chengdu University
- 2023073/Chengdu Municipal Health Commission
- 22NZZH0031/Sichuan Provincial Science and Technology Foundation
- Excellent Talents in Clinical Medical college & Affiliated hospital of Chengdu University
LinkOut - more resources
Full Text Sources
Medical
