. 2023 Sep 29;9(39):eadh9704.
doi: 10.1126/sciadv.adh9704. Epub 2023 Sep 29.

Aquatic plant wax hydrogen and carbon isotopes in Greenland lakes record shifts in methane cycling during past Holocene warming

Affiliations

Aquatic plant wax hydrogen and carbon isotopes in Greenland lakes record shifts in methane cycling during past Holocene warming

Jamie M McFarlin et al. Sci Adv. .

Abstract

Predicting changes to methane cycling in Arctic lakes is of global concern in a warming world but records constraining lake methane dynamics with past warming are rare. Here, we demonstrate that the hydrogen isotopic composition (δ2H) of mid-chain waxes derived from aquatic moss clearly decouples from precipitation during past Holocene warmth and instead records incorporation of methane in plant biomass. Trends in δ2Hmoss and δ13Cmoss values point to widespread Middle Holocene (11,700 to 4200 years ago) shifts in lake methane cycling across Greenland during millennia of elevated summer temperatures, heightened productivity, and lowered hypolimnetic oxygen. These data reveal ongoing warming may lead to increases in methane-derived C in many Arctic lakes, including lakes where methane is not a major component of the C cycle today. This work highlights a previously unrecognized mechanism influencing δ2H values of mid-chain wax and draws attention to the unquantified role of common aquatic mosses as a potentially important sink of lake methane across the Arctic.


Figures

Fig. 1.
Fig. 1.. Map of Greenland with sites discussed in text.
Red circles are lakes with sedimentary plant wax isotope data included here. Black circles are lakes with published temperature reconstructions referenced in this text. Black diamonds represent locations of ice core records discussed in this text. Lake name abbreviations: WLL, Wax Lips Lake (25); TS, Trifna Sø (26); N3, Lake N3 (27); PL, Pluto Lake (28); SL, Secret Lake (43); DS, Delta Sø (80); NL, North Lake (29); LCL, Last Chance Lake (81).
Fig. 2.
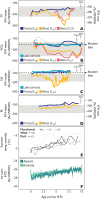
Fig. 2.. Holocene reconstructed water isotopes and climate.
At (A) TS, with estimated δ2Hprecip values from long-chain alkanes [C29, dark blue, ‰ relative to Vienna Standard Mean Ocean Water (VSMOW)] and estimated δ2Hmoss values from mid-chain alkanes (C23, orange and C21, red), with additional scaled y axis demonstrating raw δ2Hwax values on right. (B) WLL, with estimated δ2Hlakewater values from δ18Ochiron (bright blue), estimated δ2Hprecip values from long-chain alkanes (C29, dark blue) and estimated δ2Hmoss values from mid-chain alkanes (C23, orange and C21, red). (C) N3, with estimated δ2Hlakewater values from δ18Ochiron (bright blue), estimated δ2Hprecip values from long-chain alkanoic acids (C28, dark blue) and estimated δ2Hmoss values from mid-chain alkanoic acids (C24, orange) (27, 28, 38). (D) PL, with estimated δ2Hprecip values from long-chain alkanoic acids (C28, dark blue) and estimated δ2Hmoss values from mid-chain alkanoic acids (C24, orange), with additional scaled y axis demonstrating raw δ2Hwax values on right (28). (E) Summer air temperature anomalies relative to 20th century (pre-1950) from lakes on northwest (WLL, SL, and DS), west (NL), and east Greenland (LCL) (25, 29, 43, 80, 81). (F) δ18Oice values from the nearby Agassiz (dark green) and Renland (light green) ice caps (31, 32). Light gray bands in (A) to (D) encompass the range of modern precipitation isotopes at each site (upper bound, most 2H-enriched summer month average value; lower bound, most 2H-depleted winter month average value) estimated using the Online Isotopes of Precipitation Calculator (OIPC) (35). Dashed black line in (B) and (C) shows the measured modern δ2Hlakewater value. Error bars in upper right of (A) to (D) represent the average point propagated error for estimates on wax and chironomid water isotope reconstructions, respectively, including 1σ error from the calibration data and analytical error on the measurements. cal kyr B.P., calibrated thousand years before the present.
Fig. 3.
Fig. 3.. Hydrogen isotope mass balance models for WLL, TS, and N3.
Including proxy-inferred δ2Hprecip values (WLL, TS, and N3; dark blue), proxy-inferred δ2Hlakewater values (WLL and N3; bright blue), proxy-inferred δ2Hmoss values (WLL, TS, and N3; orange), and modeled δ2H values of lake water using 100% cold-season endmember (“winter”) precipitation (light green), 75% winter precipitation (dashed, light gray), and 50% winter precipitation (dotted, dark gray) input into the model as maximum contribution to lake water when mid-chain waxes have the lowest δ2H value relative to long-chain wax (i.e., the greatest offset between the two proxy values; Materials and Methods). Shading around proxy-inferred δ2Hprecip values (dark blue) and proxy-inferred δ2Hmoss values (orange) represents uncertainty around the inferred value (Materials and Methods).
Fig. 4.
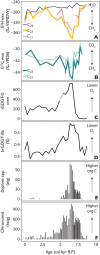
Fig. 4.. Holocene proxy data from TS.
Showing (A) δ2Hwax values of sedimentary long-chain (C29, dark blue) and mid-chain alkanes (C23, orange and C21, red), (B) δ13Cwax values of sedimentary mid-chain alkanes [C21, light green and C23, dark green, ‰ relative to Vienna Pee Dee Belemnite-LVSEC scale (VPDB)], (C) ratio of iGDGT-0 to crenarchaeol (higher values indicate greater methanogenesis and thus lower O2), (D) fractional abundance of brGDGT IIIa (%) (higher values indicate lower O2), concentration of (E) aquatic invertebrate remains from Daphnia spp. in ephippia per gram dry sediment (e/g) (higher values indicate higher productivity), and (F) chironomid larvae in head capsules per gram dry sediment (hc/g) (higher values indicate higher productivity) (26).
Fig. 5.
Fig. 5.. Correlation matrix showing Pearson’s r between variables at TS with proxy data grouped by category.
Showing elemental data, including total nitrogen (TN), total sulfur (TS), total organic carbon (TOC), and total inorganic carbon (TIC); indicators of general productivity rates, including abundances of ephippia of Daphnia spp. carapaces and chironomid head capsules per gram sediment; redox indicators sensitive to hypolimnetic oxygen, including the ratio of iGDGT-0 to crenarchaeol (0:cren), fractional abundances of brGDGT-IIIa as a percent relative to all brGDGT isomers (IIIa %) (26); and plant wax measurements, including abundance of C23 and C29 n-alkanes in μg/g TOC, and δ2H values of C23 and C29 n-alkanes; where dark brown represents r = −1, white represents r = 0, bright blue represents r = 1, and an “x” over the box indicates the relationship is not significant (P > 0.05).
Fig. 6.
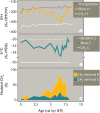
Fig. 6.. Sedimentary plant wax Holocene carbon isotopic compositions at TS.
Including (A) long-chain (C27, light green and C29, dark blue) and (B) mid-chain (C21, red and C23, orange) alkanes from TS (‰ relative to VPDB-LVSEC).
Fig. 7.
Fig. 7.. Hydrogen and carbon stable isotope mass balance models for TS.
Demonstrating (A) proxy-inferred δ2Hprecip values (C29 alkane; dotted, dark blue), proxy-inferred δ2Hmoss values (C23 alkane, orange), and δ2HCH4 model values (white); (B) δ13Cmoss values (C23 alkane, dark green) and δ13C model baseline values (dashed, white), and δ13CCH4 model values (white); and (C) modeled % input of CH4-derived H (orange) and CH4-derived C (dark green) to moss biomass (Materials and Methods).
Fig. 8.
Fig. 8.. Flow chart of the proposed system changes hypothesized for TS, WLL, and N3 driven by warming air temperatures in the Early-Middle Holocene.
Dotted white lines extending from roman numerals identify areas where proxy data from TS provide a sedimentary indicator of the proposed change, with those indicators listed in the panel on the right. Within flow chart, up arrow symbols to the left denote an increase or strengthening of variable, and down arrow symbols denote a decrease or weakening of variable. [CH4], concentration of methane.

References

    1. Wik M., Varner R. K., Anthony K. W., MacIntyre S., Bastviken D., Climate-sensitive northern lakes and ponds are critical components of methane release. Nat. Geosci. 9, 99–105 (2016).
    1. M. Collins, R. Knutti, J. Arblaster, T. Fichefet, P. Friedlingstein, X. Gao, W. J. Gutowski, T. Johns, G. Krinner, M. Shongwe, C. Tebaldi, A. J. Weaver, M. Wehner, 2013: Long-term Climate Change: Projections, Commitments and Irreversibility, in Climate Change 2013: The Physical Science Basis. Contribution of Working Group 1 to the Fifth Assessment Report of the Intergovernmental Panel on Climate Change, T.F. Stocker, D. Qin, G.-K.Plattner, M. Tignor, S.K. Allen, J. Boschung, A. Nauels, Y. Xia, V. Bex and P.M. Midgley, Eds. (Cambridge Univ. Press, 2014), pp. 1029–1136.
    1. Verpoorter C., Kutser T., Seekell D. A., Tranvik L. J., A global inventory of lakes based on high-resolution satellite imagery. Geophys. Res. Lett. 41, 6396–6402 (2014).
    1. Wik M., Thornton B. F., Bastviken D., MacIntyre S., Varner R. K., Crill P. M., Energy input is primary controller of methane bubbling in subarctic lakes. Geophys. Res. Lett. 41, 555–560 (2014).
    1. Walter K. M., Smith L. C., Chapin F. S., Methane bubbling from northern lakes: Present and future contributions to the global methane budget. Philos. Trans. Royal Soc. A. 365, 1657–1676 (2007). - PubMed