. 2023 Sep 28;186(20):4365-4385.e27.
doi: 10.1016/j.cell.2023.08.039.

Single-cell atlas reveals correlates of high cognitive function, dementia, and resilience to Alzheimer's disease pathology

Affiliations

Single-cell atlas reveals correlates of high cognitive function, dementia, and resilience to Alzheimer's disease pathology

Hansruedi Mathys et al. Cell. .

Abstract

Alzheimer's disease (AD) is the most common cause of dementia worldwide, but the molecular and cellular mechanisms underlying cognitive impairment remain poorly understood. To address this, we generated a single-cell transcriptomic atlas of the aged human prefrontal cortex covering 2.3 million cells from postmortem human brain samples of 427 individuals with varying degrees of AD pathology and cognitive impairment. Our analyses identified AD-pathology-associated alterations shared between excitatory neuron subtypes, revealed a coordinated increase of the cohesin complex and DNA damage response factors in excitatory neurons and in oligodendrocytes, and uncovered genes and pathways associated with high cognitive function, dementia, and resilience to AD pathology. Furthermore, we identified selectively vulnerable somatostatin inhibitory neuron subtypes depleted in AD, discovered two distinct groups of inhibitory neurons that were more abundant in individuals with preserved high cognitive function late in life, and uncovered a link between inhibitory neurons and resilience to AD pathology.

Keywords: Alzheimer's disease; DNA damage response; cognitive impairment; cognitive resilience; cohesin complex; inhibitory neurons; neurodegeneration; single-cell transcriptomic atlas.


Conflict of interest statement

Declaration of interests L.-H.T. is a member of the Scientific Advisory Boards of Cognito Therapeutics, 4M Therapeutics, Cell Signaling Technology, and Souvien Therapeutics, which have no association to the work described in this manuscript.

Figures
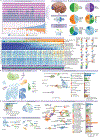
Figure 1.
Figure 1.. Single-nucleus RNA-seq interrogation of prefrontal cortex tissue from 427 ROSMAP study participants, see also Figure S1 and Data S1, page 1
(A) Cohort and snRNA-seq profiling summary, covering prefrontal cortex samples from 427 ROSMAP study participants along a spectrum of Alzheimer’s disease progression. (B) Study cohort composition. (C) Cohort metadata overview. The heatmap shows measures of AD pathology, cognitive function, sex, age at death, and post-mortem interval (rows) for the 427 study participants (columns), ordered by global AD pathology. (D) Joint UMAP of 2.3M cells across 7 major cell classes including excitatory neurons (Exc), inhibitory neurons (Inh), oligodendrocytes (Oli), oligodendrocyte precursor cells (OPC), astrocytes (Ast), immune cells (Immune), and vascular and epithelial cells (Vasc). (E) Barplot showing the number of cells per major cell class. (F-J) UMAPs of excitatory neuron subtypes (F), inhibitory neuron subtypes (G), astrocyte subtypes (H), immune cell subsets (I), and vascular and epithelial cell subtypes (J). Barplots show the number of cells for excitatory (F) and inhibitory (G) neuronal subtypes.
Figure 2.
Figure 2.. Gene expression changes associated with AD pathology are shared across excitatory neuron subtypes, see also Figure S2 and Data S1, pages 2-5 and Methods S1, pages 1, 6, and 7
(A) Heatmap showing the number significantly differentially expressed genes (adjusted P value <0.05) across 54 cell types (rows) and 36 variables (columns). (B-E) Venn diagrams showing the number of genes significantly positively associated with global AD pathology, neuritic plaque burden, neurofibrillary tangle burden, and tangle density in the excitatory neuron subtype Exc L2-3 CBLN2 LINC02306 (B), the inhibitory neuron subtype Inh LAMP5 NRG1 (Rosehip) (C), astrocytes (D), and oligodendrocytes (E). (F) Heatmaps showing the overlap (odds ratio (OR), one-sided Fisher’s exact test) of genes significantly positively associated with the variables indicated. **: −log10(P value) > 200, *: −log10(P value) > 100 (one-sided Fisher’s exact test). (G) Circos plot showing the overlap of genes positively associated with global AD pathology between excitatory neuron subtypes. (H) Heatmaps showing the overlap (odds ratio (OR), one-sided Fisher’s exact test) of genes significantly positively (left panel) or negatively (right panel) associated with global AD pathology between the excitatory neuron subtypes indicated. **: −log10(P value) > 200, *: −log10(P value) > 100 (one-sided Fisher’s exact test).
Figure 3.
Figure 3.. Gene expression changes associated with AD pathology, see also Figure S3 and Data S1, pages 6-8 and Methods S1, pages 2-4
(A and B) Selected gene ontology (GO) terms enriched among genes significantly positively (A) or negatively (B) associated with global AD pathology. (C, E, and G) Association between the expression level of genes (rows) and global AD pathology across the cell types indicated (columns). Differential gene expression analysis results for genes involved in mRNA metabolic processes (C), lipid metabolism (E), and mitochondrial function (G) are displayed. The heatmap shows association scores (signed negative log10 FDR-adjusted P value, where the sign was determined by the direction (positive or negative) of the association) and significant scores (FDR-adjusted P value < 0.05) are indicated by a rhombus shape. (D) Confirmation of DGE results in a separate data set derived from the middle temporal gyrus. The heatmap shows association scores (signed negative log10 FDR-adjusted P value, where the sign was determined by the direction (positive or negative) of the association) and significant scores (FDR-adjusted P value < 0.05) are indicated by a rhombus shape. (F) Negative association between the expression level of cholesterol biosynthesis genes and global AD pathology in astrocytes (boxes are colored by the association scores). (H) Association between the expression level of MIB complex genes and global AD pathology in layer 4/5 excitatory neurons (Exc L4-5 RORB IL1RAPL2). The bar plot shows association scores.
Figure 4.
Figure 4.. Coordinated elevation of cohesin complex expression and DNA damage response in AD, see also Figure S4 and Data S1, page 9
(A) Association (association scores) between the expression of 14 protein complexes (rows) and global AD pathology across the cell types (columns) and brain regions indicated. (B and C) Confirmation of increased cohesin complex expression in AD based on (B) bulk RNA sequencing data from the dorsal lateral prefrontal cortex of 638 ROSMAP study participants and (C) quantitative proteomics . Bar plots show association scores. (D) Left: Correlation (association scores) between the cohesin complex and consensus signature genes positively associated with global AD pathology across excitatory neuron subtypes. Right: k-means clustering of genes based on the Pearson correlation of the association scores across excitatory neurons shown in the left panel. (3) Module of genes exhibiting a positive correlation with the cohesin complex across multiple excitatory neuron subtypes. (E) Correlation (association scores) between genes positively associated with global AD pathology (in oligodendrocytes) and the protein complexes indicated (columns) in oligodendrocytes. (4) Module of genes positively correlated with the cohesin-SA1/SA2 complex in oligodendrocytes. (F) Left: Correlation between the expression level of the protein complexes (columns) and genes (rows) indicated in oligodendrocytes. (5) Genes involved in cellular response to DNA damage and DNA repair are positively correlated with cohesin complex expression in oligodendrocytes. Middle: Association between global AD pathology and the expression level of genes co-regulated with the cohesin complex (rows) across the cell types indicated (columns). (6) DNA damage response genes are positively associated with global AD pathology in oligodendrocytes. Right: Association between the expression level of genes co-regulated with the cohesin complex (rows) and the variables indicated (columns) in oligodendrocytes. (G) Correlation between the expression level of the cohesin-SA1 complex and the genes indicated (rows) across four glial cell types and four distinct regions of the human brain.
Figure 5.
Figure 5.. Temporal changes in gene expression across multiple stages of Alzheimer’s disease progression, see also Figure S5 and Data S1, page 10
(A) Schematic illustration of differential expression analysis approach. (B and C) Selected gene ontology (GO) terms (rows) enriched among genes significantly (B) positively or (C) negatively associated with global AD pathology across the cell types indicated. Upper panels: early changes (second versus first group), lower panels: late changes (third versus second group). (D) Box plots show the distribution of the average cohesin complex expression (module score) per individual in the cell types indicated. Within each box, horizontal lines denote median values; boxes extend from the 25th to the 75th percentile of each group's distribution of values; whiskers extend from the 5th to the 95th percentile. ****P < 0.0001, ***P < 0.001, **P < 0.01, *P < 0.05; ns, P > 0.05 (ordinary one-way ANOVA corrected for multiple comparisons using Tukey's multiple comparisons test). (E and F) Association between the expression level of selected genes involved in the biological processes indicated (rows) and global AD pathology and continuous pseudo-progression score in the prefrontal cortex (E) and middle temporal cortex (F) respectively. Left column: early changes; right column: late changes. Significant scores (FDR-adjusted P value < 0.05) are indicated by an asterisk symbol. (G) Overlapping fraction of genes positively associated at the different stages of disease progression in the prefrontal cortex with genes positively associated at the different stages of disease progression in the middle temporal gyrus. Left: early stage genes in the PFC; right: late changes in the PFC.
Figure 6.
Figure 6.. Molecular correlates of cognitive impairment in the aged human brain, see also Figure S6 and Data S1, page 11 and Methods S1, page 5
(A) Heatmap showing the number significantly differentially expressed genes (adjusted P value < 0.05). (B) Heatmaps showing the overlap (odds ratio, one-sided Fisher’s exact test) of genes significantly associated with the variables indicated in L4-5 excitatory neurons (Exc L4-5 RORB IL1RAPL2). **: −log10(P value) > 200, *: −log10(P value) > 100 (one-sided Fisher’s exact test). (C) The sunburst plot showing the synaptic localization of genes positively associated with global cognitive function (number of genes). (D) Association (association scores) between the expression level of synaptic genes (rows) and global cognitive function across the cell types indicated (columns). (E) Association (association scores) between the synaptic genes (rows) and variables indicated (columns) in L4-5 excitatory neurons (Exc L4-5 RORB IL1RAPL2). (F) RNA in situ hybridization with an RNAscope probe for NPTX2 (red) in the grey matter of the prefrontal cortex of an individual without cognitive impairment (left) and an individual with cognitive impairment (right). The tissue was counterstained with haematoxylin. Scale bar = 100μm. Right: quantification of the number of cells detectably expressing NPTX2. Data are mean ± s.e.m.; **p=0.0031 (Student’s two tailed t-test). n=6 individuals without cognitive impairment and n=6 individuals with a cognitive diagnosis of AD (cognitive impairment); n=4 images per individual. (G) Immunohistochemistry with an anti-NPTX2 (turquoise) antibody in the grey matter of the prefrontal cortex of an individual without cognitive impairment (top) and an individual with a cognitive diagnosis of AD (cognitive impairment) (bottom) (scale bar = 100μm). DNA (nuclei) was stained with Hoechst 33342. Bottom: Quantification of NPTX2 immunostaining. Bottom left: fraction of cells detectably expressing NPTX2. Bottom middle: immunostaining signal intensity in cells detectably expressing NPTX2. Bottom right: total number of Hoechst positive nuclei. Data are mean ± s.e.m.; *p=0.0142 (Student’s two tailed t-test). n=6 individuals without cognitive impairment and n=6 individuals with a cognitive diagnosis of AD (cognitive impairment); n=2 images per individual.
Figure 7.
Figure 7.. Cell type composition alterations associated with AD pathology and cognitive impairment, see also Figure S7 and Data S1, pages 12-19
(A) Box plots showing the relative abundance of major cell types along disease progression. Within each box, horizontal lines denote median values; boxes extend from the 25th to the 75th percentile of each group's distribution of values; whiskers extend from the 5th to the 95th percentile. *P < 0.05; ns, P > 0.05 (Kruskal-Wallis test followed by Dunn's multiple comparison test). (B) Association (association scores) between the relative abundance of major cell types and the measures of AD pathology indicated. The dotted lines indicate the significance level threshold of an FDR-corrected P value of 0.05. (C and G) Overrepresentation within each inhibitory neuron subtype of cells isolated from individuals with varying degrees of (C) AD pathology or (G) cognitive function (hypergeometric test; the P values have been adjusted for multiple hypothesis testing; −log10(Bonferroni-corrected P values) are shown). (D) UMAP of inhibitory neurons colored by subtype. Dashed line surrounds the group of vulnerable SST inhibitory neuron subtypes and the subtypes of the LAMP5 RELN group, respectively. (E) Relative abundance of inhibitory neuron subclasses and SST inhibitory neuron subtypes comparing individuals with high- versus low Alzheimer’s disease pathology. The cohort was split into quarters based on the pathology measures indicated. **P < 0.01, *P < 0.05; ns, P > 0.05 (multiple Mann-Whitney tests corrected for multiple hypothesis testing using the Holm-Šídák method). (F) Association between relative abundance of inhibitory neuron subclasses and the measures of AD pathology indicated. (H) Relative abundance of the LAMP5 RELN group of inhibitory neurons comparing individuals with high-versus low cognitive function. **P < 0.01, *P < 0.05; ns, P > 0.05 (multiple Mann-Whitney tests corrected for multiple hypothesis testing using the Holm-Šídák method). (I) Association (quasi-binomial regression) between the relative abundance of inhibitory neuron subclasses and measures of cognitive function. Significant positive association between the relative abundance of the LAMP5 (1) and SST (2) subclasses of inhibitory neurons and the measures of cognitive function. (J) Relative abundance of inhibitory neuron subtypes (LAMP5 RELN group) comparing individuals with high- versus low cognitive function. The cohort was split into quarters based on the cognitive domains indicated. **P < 0.01, *P < 0.05; ns, P > 0.05 (multiple Mann-Whitney tests corrected for multiple hypothesis testing using the Holm-Šídák method). (K, M, O) Relative abundance of (K) major cell types, (M) inhibitory neuron subclasses, or (O) inhibitory neuron subtypes (LAMP5 RELN group) in study participants with a pathologic diagnosis of AD comparing individuals with or without a cognitive diagnosis of AD. *P < 0.05; ns, P > 0.05 (multiple Mann-Whitney tests corrected for multiple hypothesis testing using the Holm-Šídák method). (3) Significantly higher relative abundance of inhibitory neurons in individuals without cognitive impairment compared to individuals with a diagnosis of AD dementia (in the subset of individuals with a pathologic diagnosis of AD). (L) RNA in situ hybridization with an RNAscope probe for the inhibitory neuron marker gene GAD2 (red) in the grey matter of the prefrontal cortex of an individual with no cognitive impairment (left) and an individual with a cognitive diagnosis of AD (cognitive impairment) (right). Scale bar = 100μm. Right: Fraction of cells detectably expressing GAD2. Data are mean±s.e.m.; *p=0.0178 (Student’s two tailed t-test). n=5 individuals with no cognitive impairment and n=5 individuals with a cognitive diagnosis of AD; n=4 images per individual. All the individuals considered in this analysis had a pathologic diagnosis of AD. (N) Relative abundance of the LAMP5 RELN group of inhibitory neurons comparing individuals with high-versus low cognitive resilience scores. **P < 0.01, *P < 0.05; ns, P > 0.05 (multiple Mann-Whitney tests corrected for multiple hypothesis testing using the Holm-Šídák method).

Comment in

References

    1. Wilson RS, Segawa E, Boyle PA, Anagnos SE, Hizel LP, and Bennett DA (2012). The Natural History of Cognitive Decline in Alzheimer’s Disease. Psychol. Aging 27, 1008. 10.1037/A0029857. - DOI - PMC - PubMed
    1. Johnson ECB, Dammer EB, Duong DM, Ping L, Zhou M, Yin L, Higginbotham LA, Guajardo A, White B, Troncoso JC, et al. (2020). Large-scale proteomic analysis of Alzheimer’s disease brain and cerebrospinal fluid reveals early changes in energy metabolism associated with microglia and astrocyte activation. Nat. Med 2020 265 26, 769–780. 10.1038/S41591-020-0815-6. - DOI - PMC - PubMed
    1. Scheltens P, Blennow K, Breteler MMB, De Strooper B, Frisoni GB, Salloway S, and Van Der Flier WM (2016). Alzheimer’s disease, www.thelancet.com. 10.1016/S0140-6736(15)01124-1. - DOI - PubMed
    1. Masters CL, Bateman R, Blennow K, Rowe CC, Sperling RA, and Cummings JL (2015). Alzheimer’s disease. Nat. Publ. Gr 10.1038/nrdp.2015.56. - DOI - PubMed
    1. Serrano-Pozo A, Frosch MP, Masliah E, and Hyman BT (2011). Neuropathological alterations in Alzheimer disease. Cold Spring Harb. Perspect. Med 1, a006189. 10.1101/cshperspect.a006189. - DOI - PMC - PubMed

Publication types

LinkOut - more resources