. 2023 Sep 28;186(20):4386-4403.e29.
doi: 10.1016/j.cell.2023.08.037.

Human microglial state dynamics in Alzheimer's disease progression

Affiliations

Human microglial state dynamics in Alzheimer's disease progression

Na Sun et al. Cell. .

Abstract

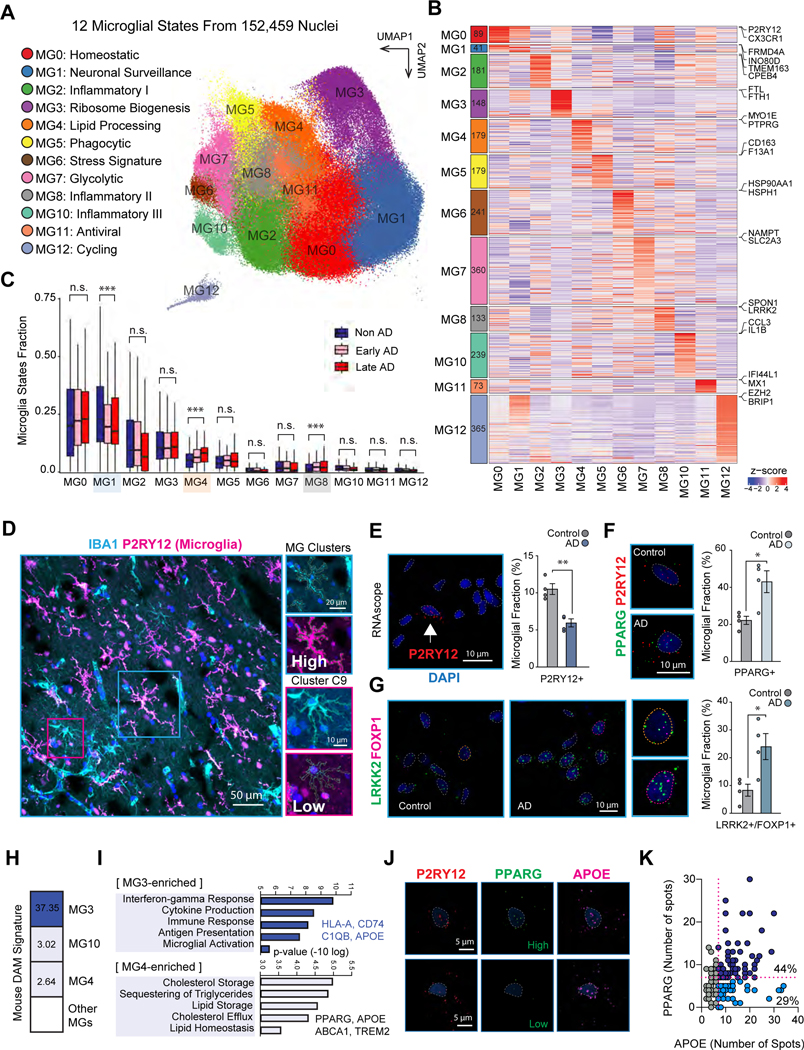
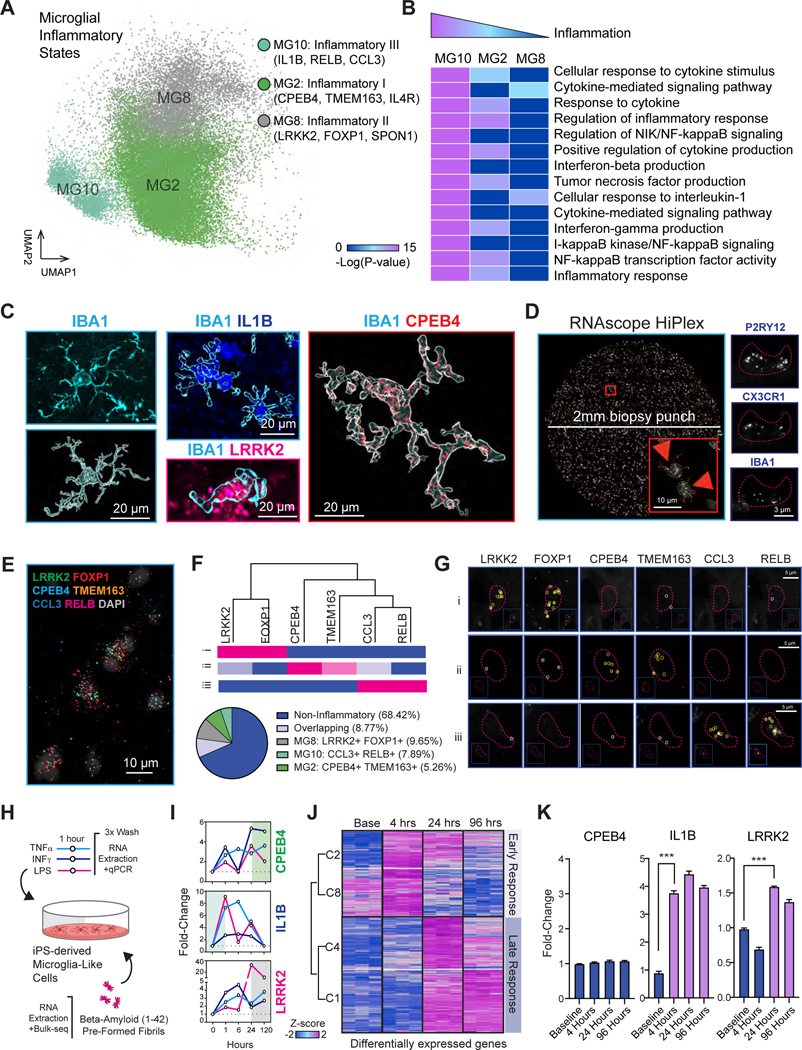
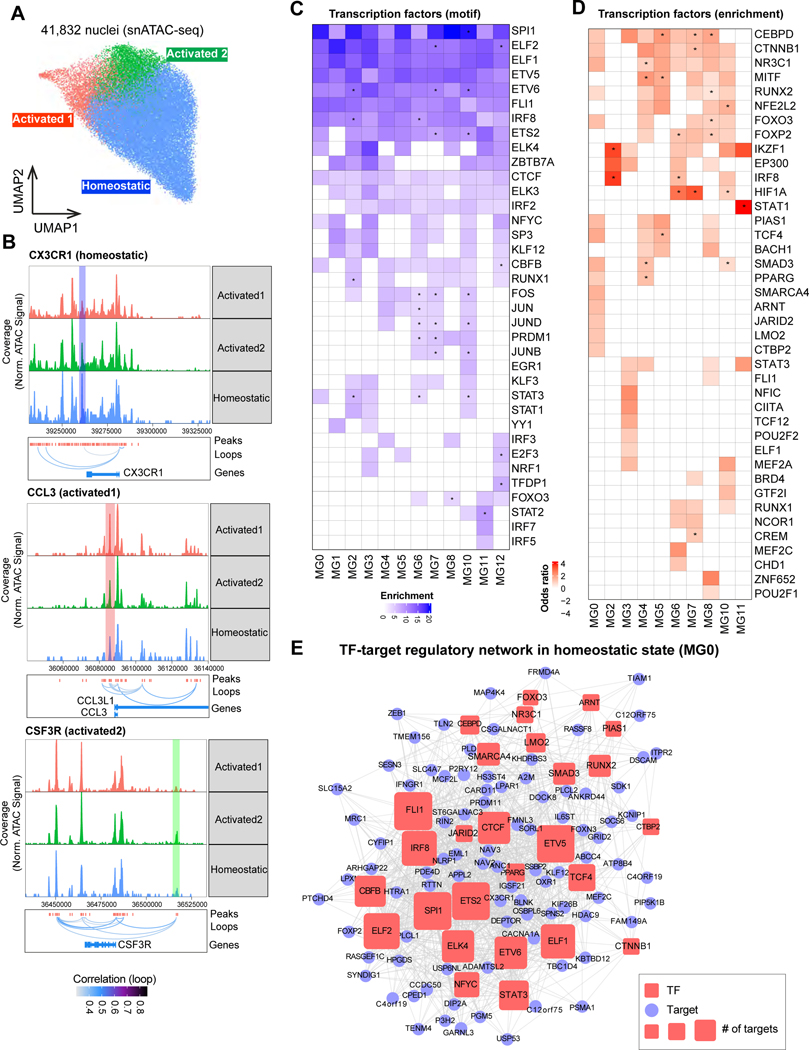
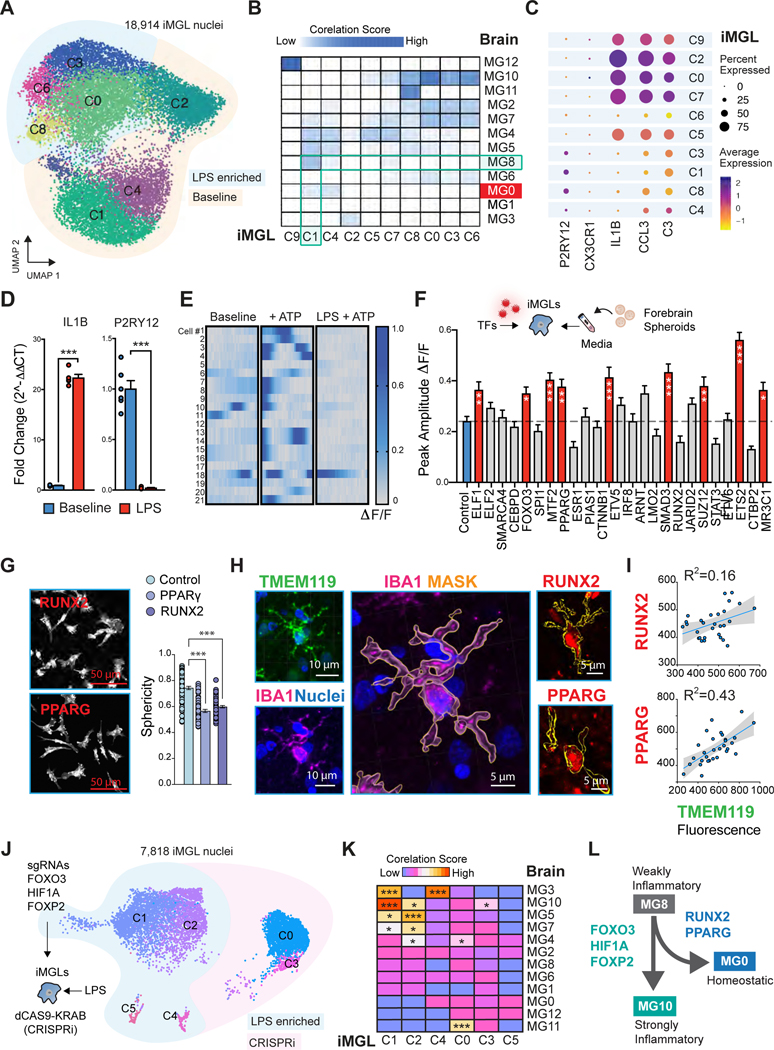
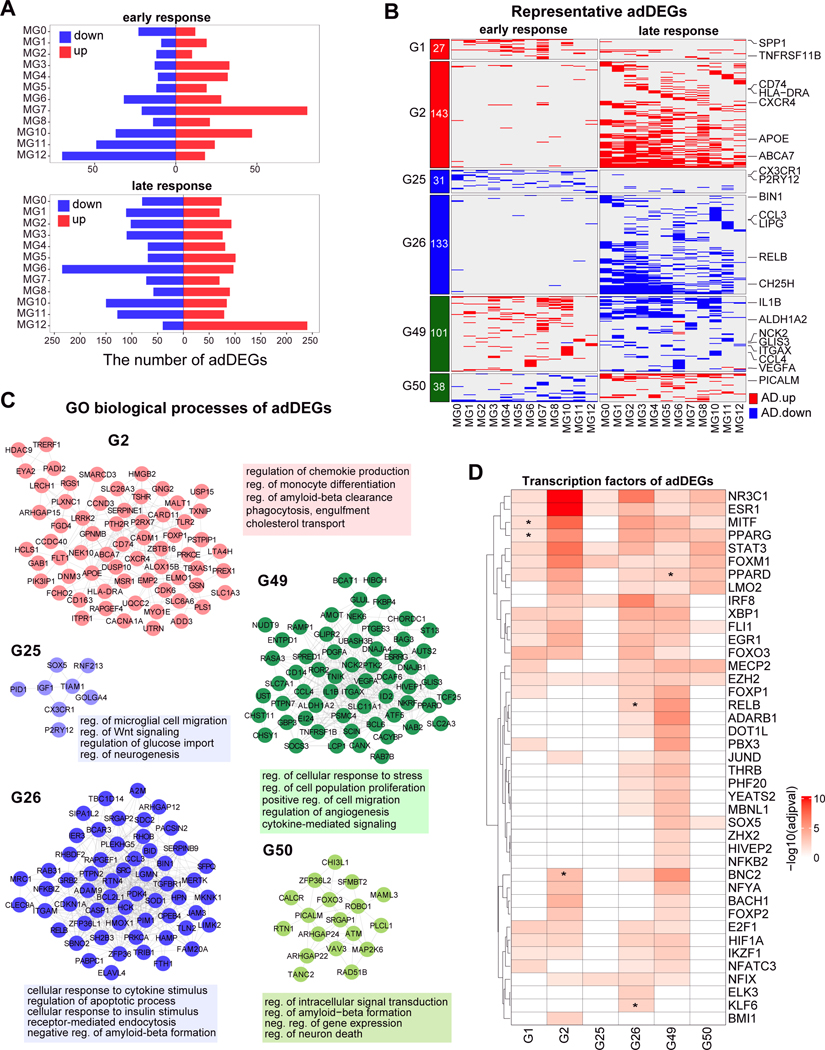
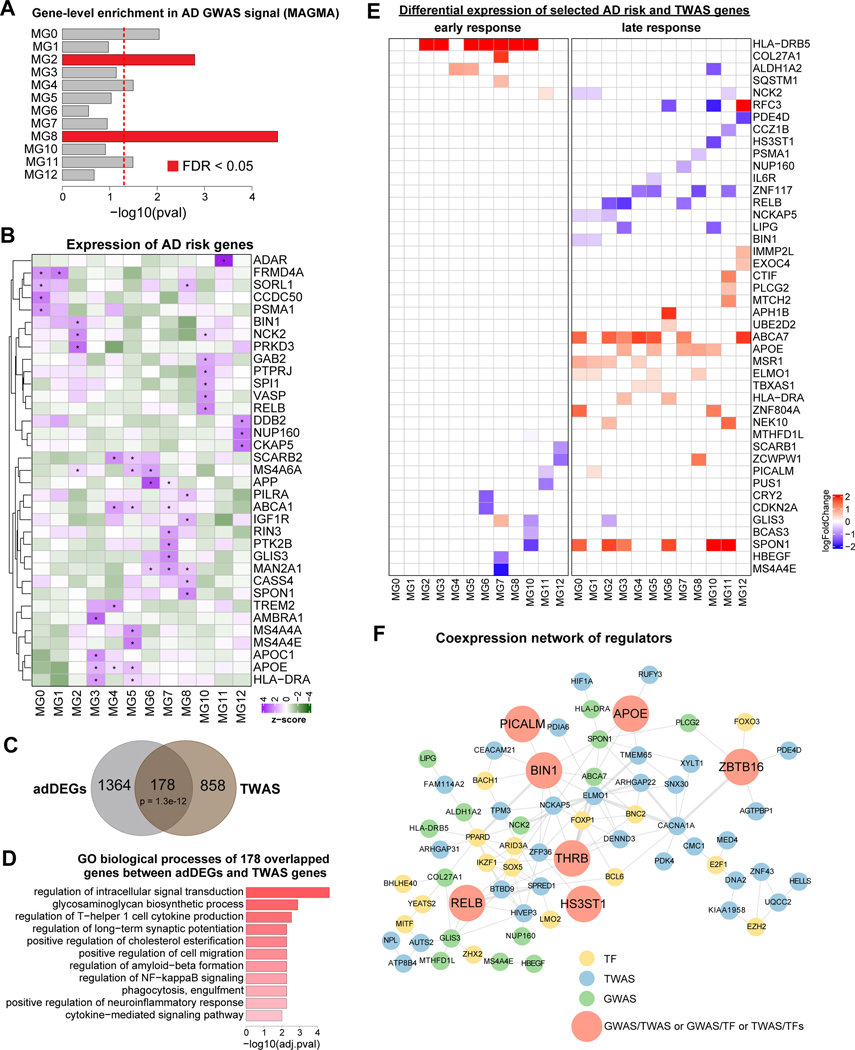
Altered microglial states affect neuroinflammation, neurodegeneration, and disease but remain poorly understood. Here, we report 194,000 single-nucleus microglial transcriptomes and epigenomes across 443 human subjects and diverse Alzheimer's disease (AD) pathological phenotypes. We annotate 12 microglial transcriptional states, including AD-dysregulated homeostatic, inflammatory, and lipid-processing states. We identify 1,542 AD-differentially-expressed genes, including both microglia-state-specific and disease-stage-specific alterations. By integrating epigenomic, transcriptomic, and motif information, we infer upstream regulators of microglial cell states, gene-regulatory networks, enhancer-gene links, and transcription-factor-driven microglial state transitions. We demonstrate that ectopic expression of our predicted homeostatic-state activators induces homeostatic features in human iPSC-derived microglia-like cells, while inhibiting activators of inflammation can block inflammatory progression. Lastly, we pinpoint the expression of AD-risk genes in microglial states and differential expression of AD-risk genes and their regulators during AD progression. Overall, we provide insights underlying microglial states, including state-specific and AD-stage-specific microglial alterations at unprecedented resolution.

Keywords: Alzheimer's; cell states; disease-stage response; iPSCs; inflammation; microglia; single-cell; transcription factors.


Conflict of interest statement

Declaration of interests L.-H.T. is a member of the Scientific Advisory Board of Cognito Therapeutics, 4M Therapeutics, Cell Signaling Technology, and Souvien Therapeutics, which has no association to this study.

Figures

Figure 1.
Figure 1.. Microglial transcriptional states in aged human brains.
A. UMAP of 152,459 microglia nuclei with annotated microglial states in snRNA-seq data. B. Heatmap to show 2,228 highly expressed genes in 12 microglial states. The left block with matched colors shows the number of genes in each state. The right shows the representative genes. Z-scores across microglia states are used for the plot. C. Cell fraction distribution in AD pathological groups. Propeller analysis to determine the statistical significance highlighted with ***. D. Immunostaining of human postmortem brain tissue for the pan-macrophage marker IBA1 in cyan and the microglial homeostatic marker P2RY12 in magenta. E. RNAscope in situ hybridization of postmortem prefrontal cortex tissue probed for the microglial marker P2RY12 (red) and counterstained with the nuclei marker DAPI. F. Microglial fraction of P2RY12+ with co-detected MG4 marker, PPARG. G. Microglial fraction of P2RY12+ with co-detected MG2 markers, LRRK2 and FOXP1. E-G. Quantification shown from 8 subjects, averages from microglial fractions of total DAPI nuclei shown for 4 AD and 4 controls. Student’s t-test, ** p-value <0.01. n=91 to 149 cells per group. H. Enrichment analysis of mouse DAM signature across human microglial states. I. Enriched GO terms of highly expressed genes in MG3 vs. all states (upper panel), and MG4 vs. all states (lower panel). J. Co-detection analysis of PPARG and APOE in P2RY12+ microglia from 4 AD subjects with RNAscope. K. APOE and PPARG detection greater than 7 dots reveals discrete APOE+ populations. n= 152 P2RY12+ cells. See also Figure S1–3 and Table S1, pages 1–4.
Figure 2.
Figure 2.. Microglial inflammatory states capture an inflammatory continuum.
A. UMAP of three inflammatory states of microglia. B. Enrichment of inflammation-related biological processes in three inflammatory states, represented by the -log10(p-value) in heatmap. C. Multiplexed immunostaining of top inflammatory state markers. IBA1 labeled for CNS resident macrophages and derived 3D rendering of cell morphologies, ILB1 for MG10, LRRK2 for MG8 and CPEB4 for MG2 microglia. D. Maximum projection of tile scan from a 2mm biopsy punch of prefrontal cortex tissue after alignment of 4 iterative rounds of RNAscope with inflammatory-state and microglial-specific probes. Inset shows 2 microglia nuclei marked by red arrows, and representative image of detection of microglial-specific probes (right panel). E. Higher magnification of composite image with inflammatory-state probe detection. F. Dendrogram and representative cells for inflammatory state probe detection of heatmap in Figure S4D (upper panel). Cell fraction analysis of 291 microglia for 4 AD subjects. Number of RNAscope dots Z-scored across all cells (lower panel). G. Images from representative microglia nuclei with signatures of discrete inflammatory states. H-J. Transcriptional kinetics of inflammatory state markers in iPS-derived microglia-like cells (iMGLs). I. Treatment with TNFα (40 ng/mL), INFγ (30ng/mL), or LPS (10 ng/mL) for 1 hour and profiled by qPCR. J. Treatment with pre-formed amyloid beta (1–42) fibrils and profiled by RNA-seq; Heatmap of early and late response up-regulated genes. K. Levels of CPEB4, IL1B and LRRK2 expression in response to amyloid treatment. n= 3 biological replicates per group. ANOVA with post-hoc Tukey test. *** p-value <0.001. See also Figure S3–4 and Table S1, pages 4–6.
Figure 3.
Figure 3.. Transcription factors regulate microglial states.
A. UMAP of 41,832 microglia nuclei with annotated epigenetic states in snATAC-seq data. B. Examples of co-accessible links between gene promoters and distal peaks to represent the epigenetic state specific peaks. C. Motif enrichment in the microglial transcriptional state marker genes associated accessible peaks. The -log10(p-value) represents the enrichment. Stars show the TFs that were highly expressed in the corresponding microglial state. D. Heatmap to show the TF enrichment of marker genes in each microglial transcriptional state. Odds ratio represents the enrichment. Stars show the TFs that were highly expressed in the corresponding microglial state. E. TF-target regulatory network in MG0 (homeostatic state). The TFs are combined from gene-set enrichment based and motif based analyses shown in C-D. The pink squared nodes represent the TFs. The light blue circle nodes represent the targets. The size of nodes represents the number of targets. See also Figure S5 and Table S1, pages 7–8.
Figure 4.
Figure 4.. TF-driven regulation of microglial state dynamics in iMGLs.
A. UMAP of 18,914 iPSC-derived microglia (iMGL) nuclei, labeled by clusters. LPS enriched clusters shaded in light blue. UMAP with all clusters can be found in Figure S6. B. Enrichment of iMGL marker genes of each cluster in microglial transcriptional states from human post-mortem snRNA-seq data. C. Dotplot to show the expression of marker genes in iMGLs clusters. The size represents the percentage of cells with expression. The color represents the scaled average expression level. D. qPCR analysis of IL1B and P2RY12 expression in iMGLs following 12 hours of 10ng/mL of LPS treatment. Student’s t-test, *** p-value <0.001. n= the mean of 6 biological replicates per group. E. Raster plots for calcium transients in monocultures of iMGLs at baseline or upon ATP uncaging with 405nm stimulation. Peak amplitude change in fluorescent intensity (ΔF/F) is displayed from low (gray) to high (dark blue) in 15 second bins over 33 frames. n= 21 cells. F. TF overexpression screen 8 days post viral infection exposed to neuronal spheroid conditioned media to evoke calcium transients. ANOVA with post-hoc Tukey test. *** p-value <0.001; ** p-value <0.01; * p-value <0.05. n= 80 to 199 cells per group. Red filled bars represent statistically significant changes in contrast to control, while gray-filled bars represent non-significant differences. G. Actin stained iMGLs from RUNX2 and PPARG overexpression and morphology quantification. Image of control sample (iMGLs infected with empty-mCherry lentivirus) in Figure S6H. ANOVA with post-hoc Tukey test. *** p-value <0.001. n= 55 to 76 cells per group. H. Immunostaining of human brain tissue for homeostatic marker TMEM119 and pan-macrophage marker, IBA1. 3D rendering of IBA1 signal was performed on IMARIS and used to generate a mask delineating cell body, shown in yellow. Immunostaining for homeostatic TFs in IBA1 positive cells across the human brain. I. Regression analysis correlating levels of PPARG and RUNX2 in IBA1-positive cells with the homeostatic marker TMEM119. J-K. UMAP from CRISPRi iMGLs treated with LPS carrying sgRNAs targeting FOXO3, HIF1A and FOXP2. K. Enrichment of LPS-treated iMGLs genes for each cluster in microglial transcriptional states from human post-mortem snRNA-seq data. L. Diagram of microglial state transition dynamics. See also Figure S6 and Table S1, page 9.
Figure 5.
Figure 5.. Transcriptional changes of microglial states in AD.
A. Barplot showing the number of down-regulated and up-regulated DEGs for each microglial state in early response and late response. B. Transcriptional changes of 473 DEGs in eight groups during AD progression. Red in heatmap represents up-regulated in AD progression, i.e. up-regulated in early AD compared to non-AD and upregulated in late AD compared to early AD, and blue represents down-regulation in AD progression. The numbers in the left block show the number of DEGs per group. The right shows the representative DEGs including known microglia markers, cytokines and their receptors, and top AD risk genes (see more in Figure 6). The heatmap with all DEGs is in Figure S8. C. Gene-gene occurrence network per group of genes in Figure 5B. The edge represents that the two genes are involved in the same Gene Ontology terms. The representative enriched GO terms are shown along with the network. D. Heatmap to show the TF enrichment of DEGs in each group. Odds ratio represents the enrichment. Stars show the TFs that were also differentially expressed and belong to the corresponding group. See also Figure S7–9 and Table S1, pages 10–11.
Figure 6.
Figure 6.. Association of microglial transcriptional states with AD genetics.
A. Gene-level enrichment in GWAS signals to associate microglial states with AD genetics using MAGMA. The -log10 (p-value) is shown in the barplot. The red dashed line shows the p-value < 0.05 as a cutoff. The red bars show FDR < 0.05 as a cutoff. B. Expression patterns of top AD risk genes (GWAS p-value < 10e-8) in 12 microglial states. The stars highlight the genes with specifically high expression in the corresponding state. C. Venn diagram showing the significant overlap between DEGs and TWAS genes, evaluated by Fisher’s exact test. D. The representative enriched Gene Ontology biological process of 178 overlapping genes between DEGs and TWAS genes. The -log10(p-value) is shown in the barplot. E. Transcriptional changes of 44 AD risk genes or TWAS genes in the early and late stages of AD in each microglial state. The logFoldChange calculated by edgeR shows the up-/down-regulation in AD progression. The red represents the up-regulation and the blue represents the down-regulation in AD progression. F. Co-expression network of regulators. The regulators include AD risk genes, TWAS genes, and TFs, denoted by nodes. The size of nodes represents the number of categories that one node belongs to. The edge represents the co-expression in at least one comparison (early or late) in each state, weighted by the times of co-expression occurrence. See also Figure S10 and Table S1, pages 12–13.

Comment in

References

    1. Butovsky O, and Weiner HL (2018). Microglial signatures and their role in health and disease. Nat. Rev. Neurosci. 19, 622–635. - PMC - PubMed
    1. Ellwanger DC, Wang S, Brioschi S, Shao Z, Green L, Case R, Yoo D, Weishuhn D, Rathanaswami P, Bradley J, et al. (2021). Prior activation state shapes the microglia response to antihuman TREM2 in a mouse model of Alzheimer’s disease. Proc. Natl. Acad. Sci. U. S. A. 118. 10.1073/pnas.2017742118. - DOI - PMC - PubMed
    1. Friedman BA, Srinivasan K, Ayalon G, Meilandt WJ, Lin H, Huntley MA, Cao Y, Lee S-H, Haddick PCG, Ngu H, et al. (2018). Diverse Brain Myeloid Expression Profiles Reveal Distinct Microglial Activation States and Aspects of Alzheimer’s Disease Not Evident in Mouse Models. Cell Rep. 22, 832–847. - PubMed
    1. Hammond TR., Dufort C., Dissing-Olesen L., Giera S., Young A., Wysoker A., Walker AJ., Gergits F., Segel M., Nemesh J., et al.. (2019). Single-Cell RNA Sequencing of Microglia throughout the Mouse Lifespan and in the Injured Brain Reveals Complex Cell-State Changes. Immunity 50, 253–271.e6. - PMC - PubMed
    1. Keren-Shaul H, Spinrad A, Weiner A, Matcovitch-Natan O, Dvir-Szternfeld R, Ulland TK, David E, Baruch K, Lara-Astaiso D, Toth B, et al. (2017). A Unique Microglia Type Associated with Restricting Development of Alzheimer’s Disease. Cell 169, 1276–1290.e17. - PubMed

Publication types

Substances

LinkOut - more resources