. 2023 Sep 28;186(20):4404-4421.e20.
doi: 10.1016/j.cell.2023.08.038.

Neuronal DNA double-strand breaks lead to genome structural variations and 3D genome disruption in neurodegeneration

Affiliations

Neuronal DNA double-strand breaks lead to genome structural variations and 3D genome disruption in neurodegeneration

Vishnu Dileep et al. Cell. .

Abstract

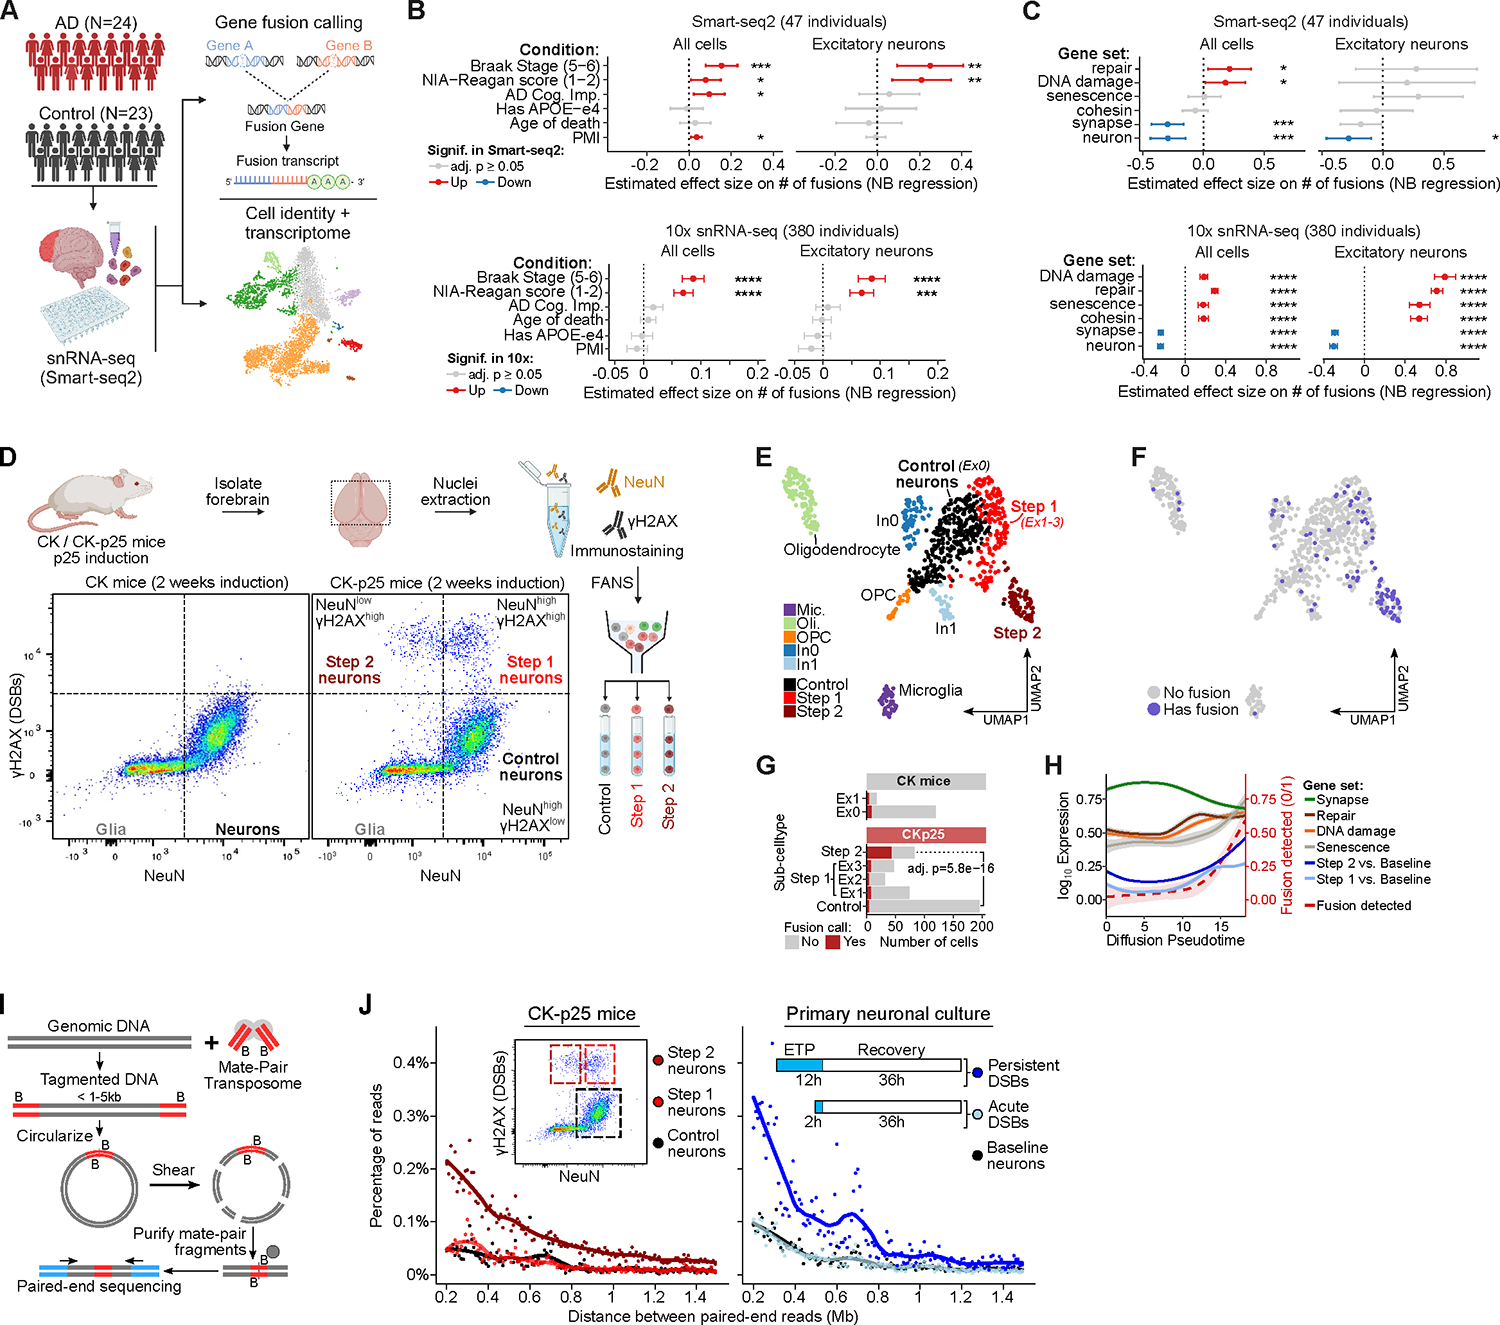
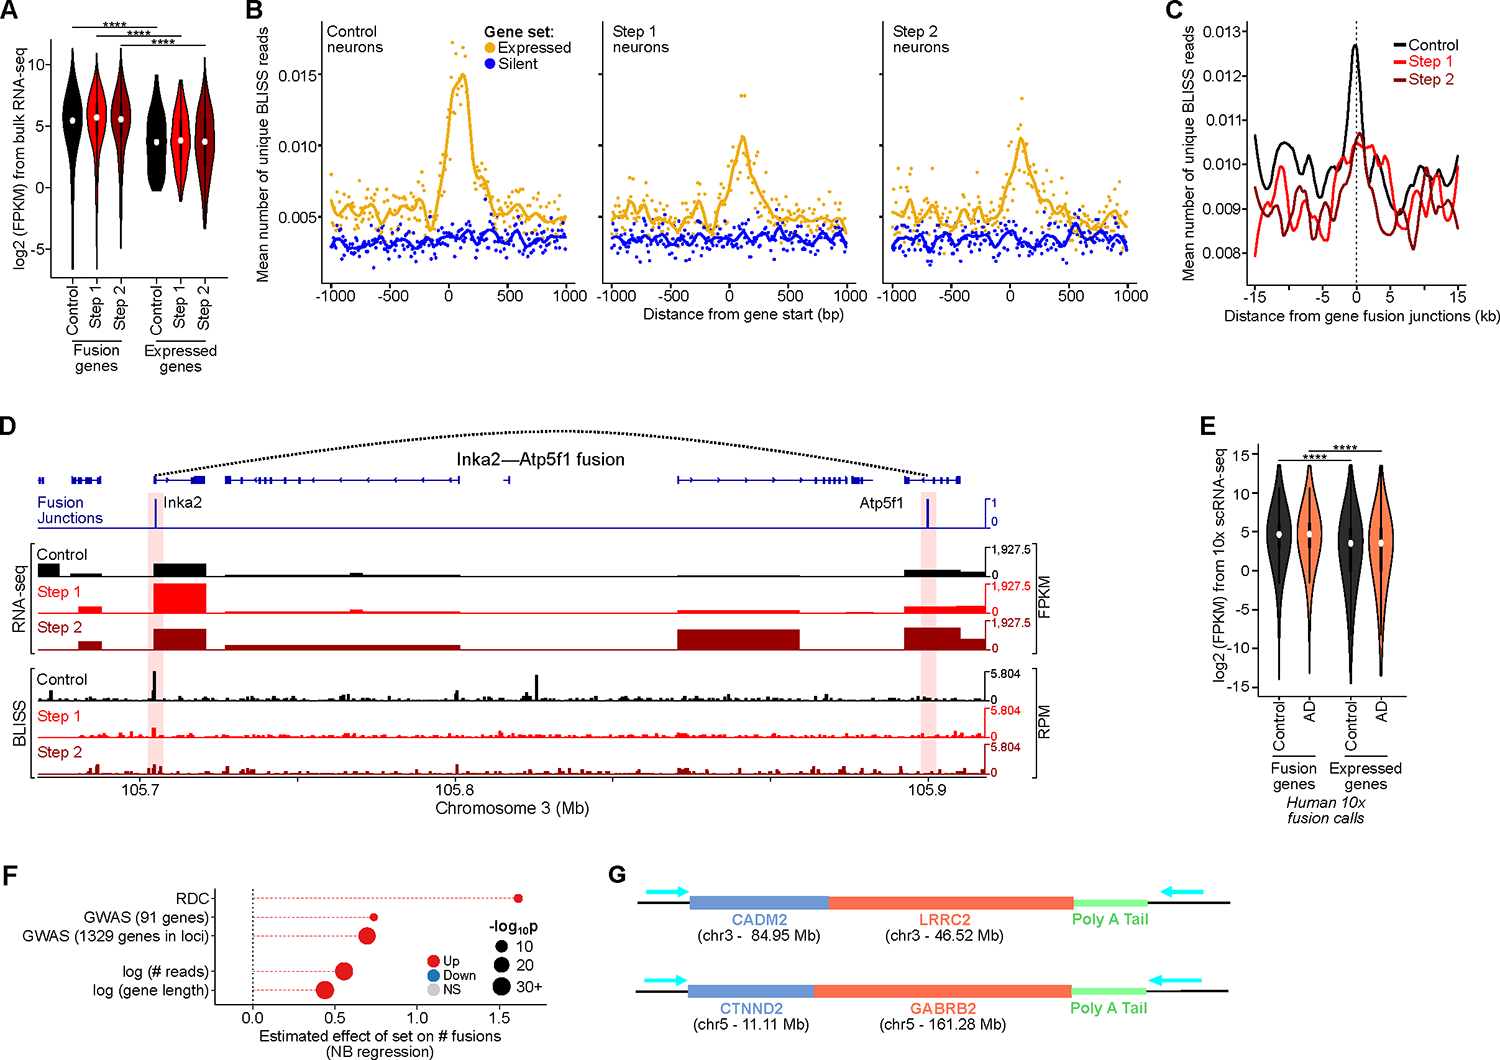
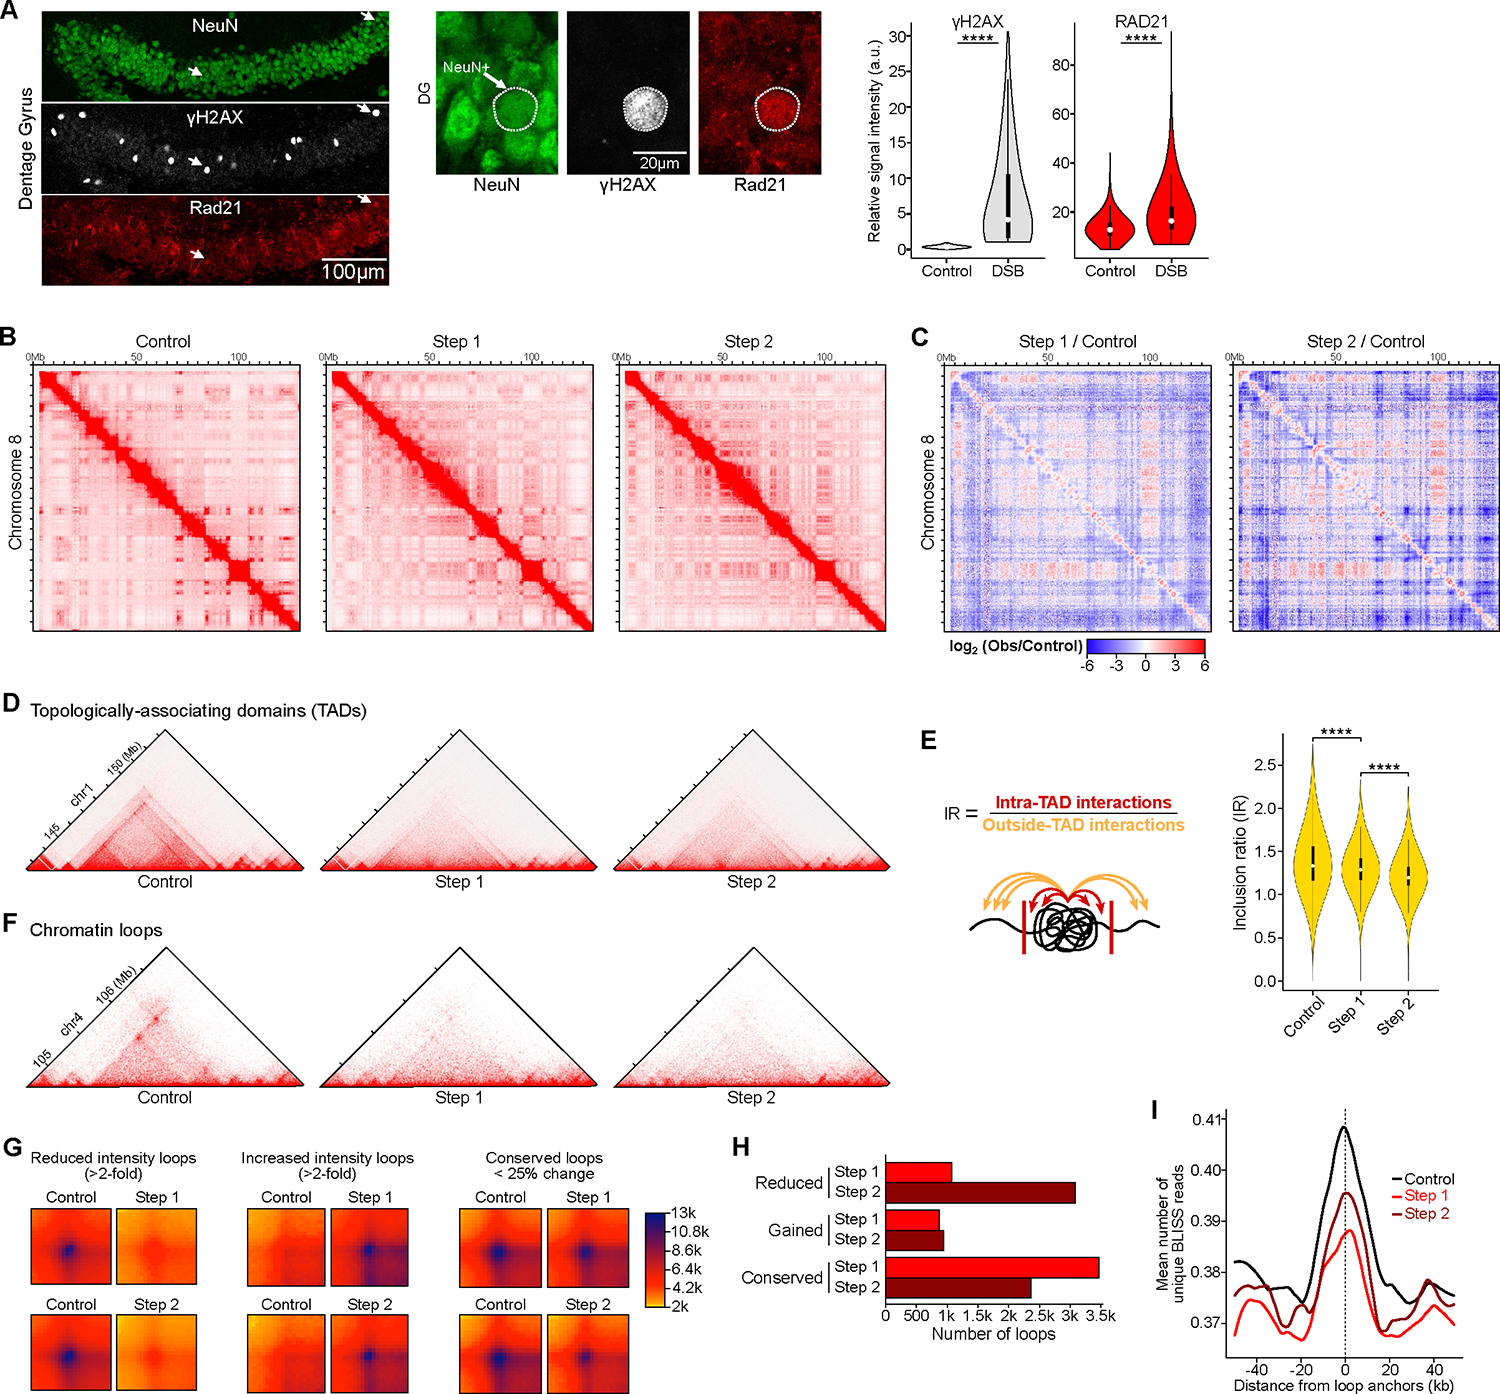
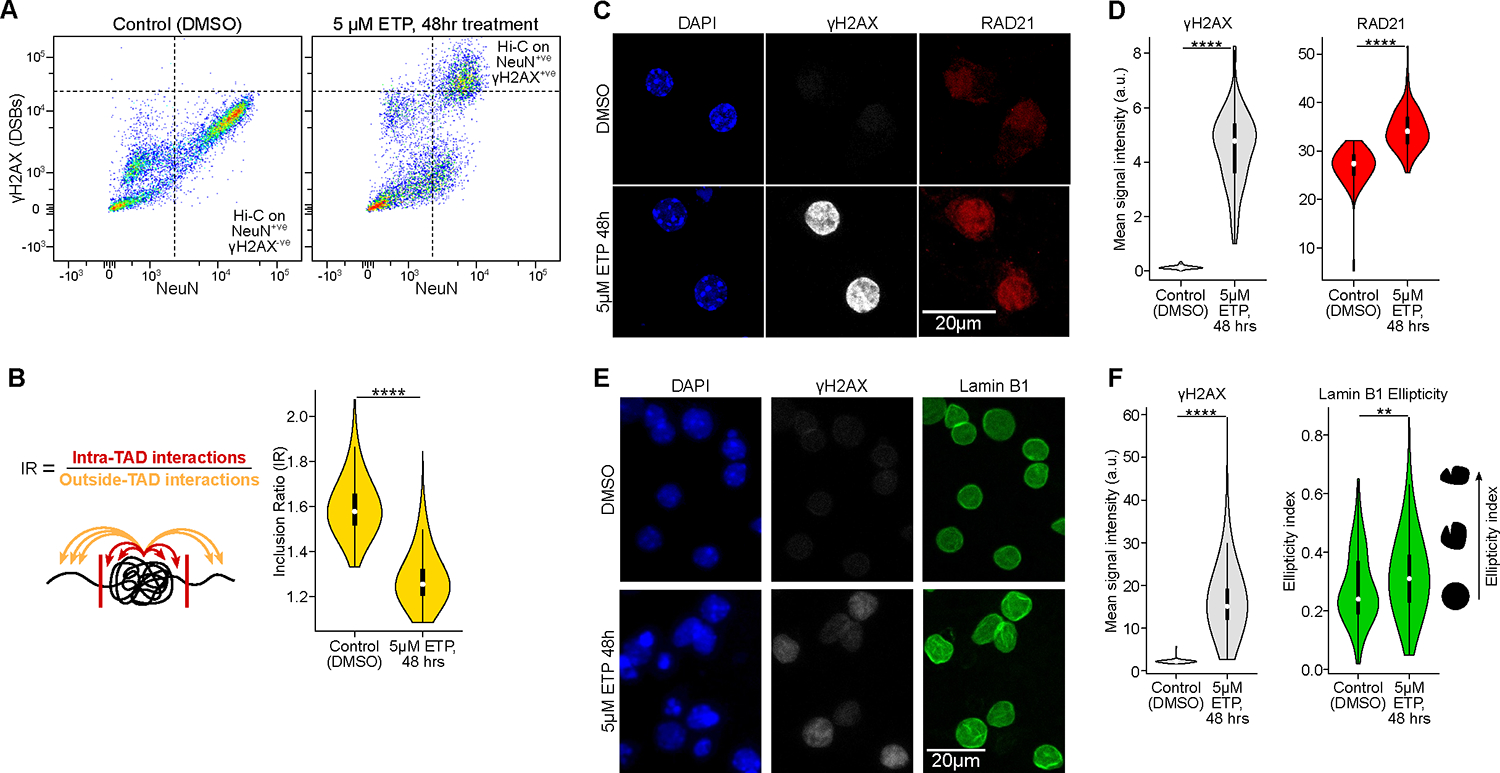
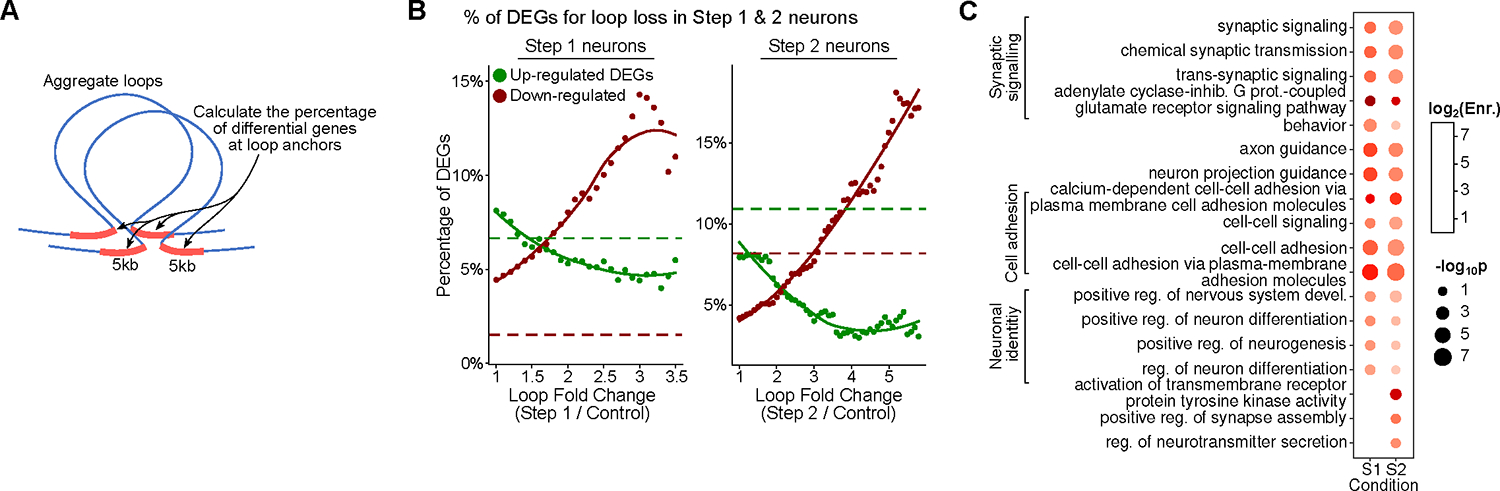
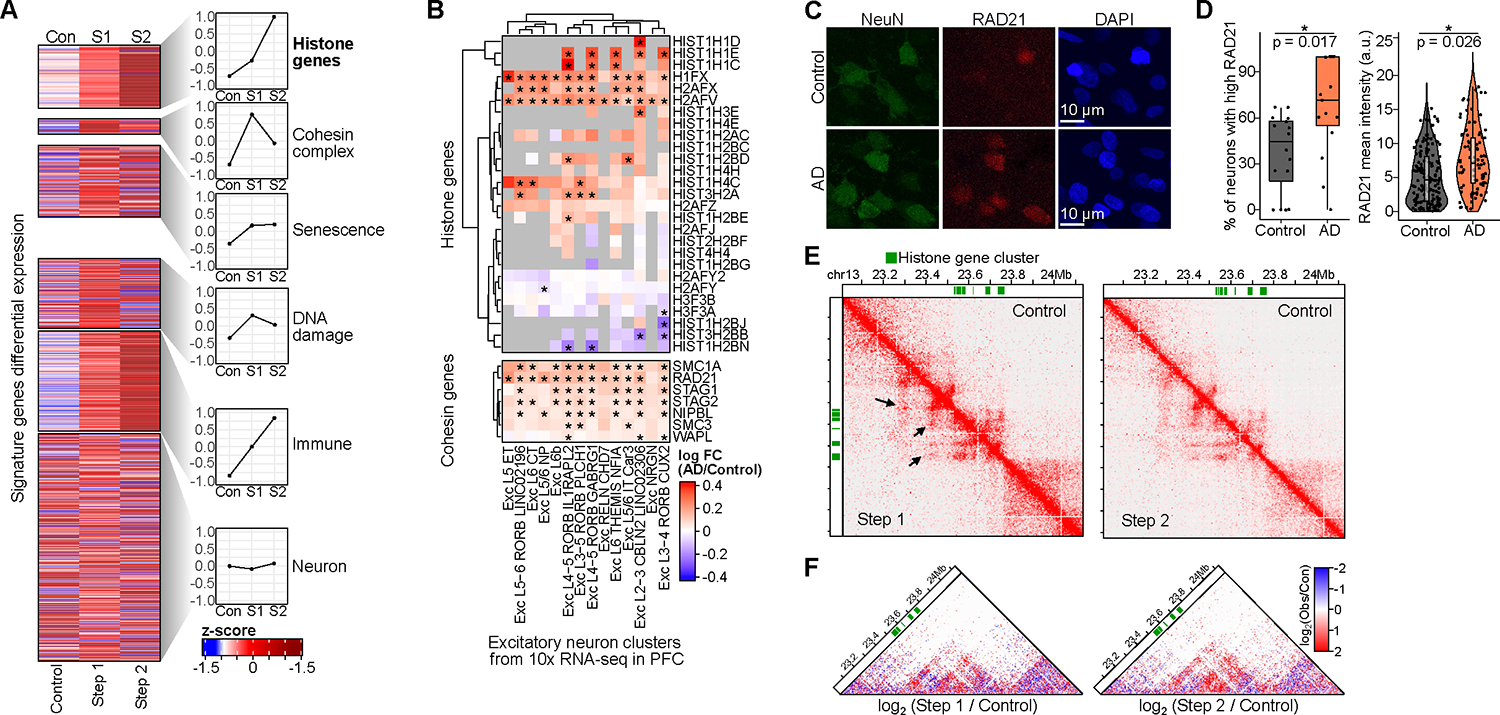
Persistent DNA double-strand breaks (DSBs) in neurons are an early pathological hallmark of neurodegenerative diseases including Alzheimer's disease (AD), with the potential to disrupt genome integrity. We used single-nucleus RNA-seq in human postmortem prefrontal cortex samples and found that excitatory neurons in AD were enriched for somatic mosaic gene fusions. Gene fusions were particularly enriched in excitatory neurons with DNA damage repair and senescence gene signatures. In addition, somatic genome structural variations and gene fusions were enriched in neurons burdened with DSBs in the CK-p25 mouse model of neurodegeneration. Neurons enriched for DSBs also had elevated levels of cohesin along with progressive multiscale disruption of the 3D genome organization aligned with transcriptional changes in synaptic, neuronal development, and histone genes. Overall, this study demonstrates the disruption of genome stability and the 3D genome organization by DSBs in neurons as pathological steps in the progression of neurodegenerative diseases.

Keywords: 3D genome organization; Alzheimer’s disease; DNA double-strand breaks; epigenome; genome rearrangements; genomic mosaicism; neurodegeneration; senescence; structural variations; transcriptome.


Conflict of interest statement

Declaration of interests L.-H.T. is a member of the Scientific Advisory Board of Cognito Therapeutics, 4M Therapeutics, Cell Signaling Technology, and Souvien Therapeutics, which has no association to the work described in this manuscript.

Figures

Figure 1:
Figure 1:. DSBs in neurons lead to mosaic genome structural variations. See also Figure S1, S2 and Table S1, pages 1–6.
A) Schematic of snRNA-seq (Smart-seq2) analysis in human post-mortem brains. B) The effect size of the number of gene fusions using human snRNA-seq as a function of human sample covariates. Significantly increased (red) or decreased (blue) gene fusions shown for adjusted p-value ≤ 0.05. Human sample covariates include AD cognitive impairment score (AD Cog, Imp) and post-mortem interval (PMI). C) The effect size of the number of gene fusions as a function of gene sets associated with different Gene Ontology (GO) terms, similar to panel B. D) Representative FANS dot-plot of CK/CK-p25 forebrain after 2 weeks induction using NeuN (neuron) and γH2AX (DSB) marker. E) UMAP embedding of CK/CK-p25 snRNA-seq after 1 or 2 weeks of induction. Colors indicate cell-type annotations. Control neurons (Ex0) and Step 1 neurons are represented by clusters Ex1, Ex2, and Ex3. F) Overlay of cells containing at least 1 gene fusion event (blue) on the snRNA-seq UMAP embedding. G) Quantification of the number of cells with at least one gene fusion and the total number of cells for Control, Step 1 (Ex1, Ex2, Ex3 clusters), and Step 2. Significance from Fisher’s exact test between Control and Step 2 in CKp25 mice. H) Trajectory analysis of Control, Step 1, and Step 2. Lines indicate the fraction of cells with gene fusions (dotted red lines) or smoothed expression of gene sets along the pseudo-time trajectory. Step 1 and Step 2 gene sets are defined as significantly upregulated genes from Step 1 vs. Control and Step 2 vs. Control comparisons from bulk RNA-seq (Welch et al.,2022) respectively (adjusted p-value<0.05, log2 fold-change≥1.0). I) Schematic of mate-pair sequencing. Genomic DNA is tagmented to sizes between 1 – 5 kb with Tn5 transposase carrying biotinylated adaptors. The fragments are circularized and then sheared into 200–300 bp fragments. The ligation junctions are then enriched through biotin pull-down and paired-end sequenced. Mapped read pairs will be separated by 1– 5 kb and large deviations from the expected separation indicates genome structural variation events. J) Plots of mate-pair sequencing quantifying the percentage of read pairs separated by large genomic distances greater than 200 kb that indicate genome structural variation events.
Figure 2:
Figure 2:. Highly expressed genes and long genes are vulnerable sites for genome structural variations in neurons. See also Figure S3, Table S1, pages 1–4, 6, 7, and 17.
A) Expression level of genes involved in CK-p25 gene fusions (Wilcoxon test with Benjamini–Hochberg correction). B) Aggregate plots of BLISS reads centered at gene starts for the top 2500 expressed (yellow) and the bottom 2500 silent genes (blue), for Control, Step 1, and Step 2 neurons. C) Aggregate plots of BLISS reads centered at gene fusion junctions called by snRNA-seq in CK-p25 neurons. D) Genome browser snapshot of example gene fusion in CK-p25 mice Step 2 neurons. Panels show fusion junctions (top), bulk RNA-seq signal (panels 2–4), and BLISS in the three populations (panels 5–7). E) Expression level of genes involved in human gene fusions (10x snRNA-seq) vs all expressed genes (Wilcoxon test with BH correction). F) Effect size of the number of gene fusions as a function of: genes identified as RDC gene, AD GWAS genes, gene expression level (reads), and gene length (bp). G) Schematics of example gene fusions identified through ONT long-read cDNA sequencing.
Figure 3:
Figure 3:. Neurons burdened with DSBs exhibit global disruption of the 3D genome organization at multiple scales. See also Figure S4, Table S1, pages 8–10 and 16.
A) Representative immunohistochemistry images and quantification of RAD21 (cohesin subunit) in 2-week induced CK-p25 mice, comparing neurons with baseline DSBs to neurons enriched for DSBs. Representative images show dentate gyrus (left) and higher-magnification images (right). Violin plots quantify RAD21 levels between neuronal nuclei with baseline DSBs (ϒH2AX relative intensity < 1) and neurons enriched for DSBs (ϒH2AX relative intensity > 1) (Wilcoxon test). The mean relative intensity of ϒH2AX (gray) and RAD21 (red) was measured within NeuN surfaces. Control (n=5,316 cells), DSB (n=725 cells). B) Full chromosome (chr8) Hi-C chromatin interaction heatmaps. C) Differential heatmaps comparing Step 1/Control and Step 2/Control, colored by increased (red) or decreased (blue) interactions over control. D) Representative Hi-C interaction plots showing the disruption of TADs. Hi-C heatmaps were rotated 45 degrees and only the upper triangle is shown. E) Quantification of TAD disruption through Inclusion Ratio (IR). IR is the ratio of intra-TAD interactions to outside-TAD interactions (Wilcoxon test with BH correction). F) Representative Hi-C interaction plots showing the disruption of chromatin loops. G) Aggregate heatmaps of reduced intensity (>2-fold), increased intensity (>2-fold), and conserved (<25% change) chromatin loops for Step 1 vs. Control and Step 2 vs. Control. H) Bar plot indicating quantification of chromatin loop disruption in Step 1 (red) and Step 2 (dark red). I) Aggregate plots of BLISS reads centered at loop anchors in CK-p25 neurons.
Figure 4:
Figure 4:. DSBs in neurons are sufficient to disrupt the 3D genome organization. See also Figures S5, Table S1, page 11 and 16.
A) FANS dot-plots of NeuN versus ϒH2AX immunoreactivity after etoposide (5μM for 48 hours) or vehicle (DMSO) treatment in primary neuronal culture. B) Quantification of TAD disruption (IR, Wilcoxon test). C) Representative images and quantification of RAD21 (cohesin subunit) IHC in primary culture neurons (DIV 12) after Etoposide (5μM for 48 hours) or vehicle treatment (DMSO). D) Violin plots quantifying the images for ϒH2AX levels (gray) and RAD21 levels (red) in control neurons and etoposide-treated neurons (Wilcoxon test). The mean relative intensity of ϒH2AX and RAD21 was measured within NeuN surfaces. Control (n=111 cells), ETP (n=112 cells). E) Representative images of Lamin B1 IHC in primary culture neurons (DIV 12) after Etoposide (5μM for 48 hours) or vehicle treatment (DMSO). F) Violin plots quantifying the images for ϒH2AX levels (red) and Lamin B1 ellipticity (green) in control neurons and etoposide-treated neurons (Wilcoxon test). The mean relative intensity of ϒH2AX was measured within Lamin B1 surfaces that were positive for NeuN. Control (n=78), ETP (n=809).
Figure 5:
Figure 5:. DSB-associated dysregulation of the 3D genome aligns with the differential gene expression. See also Figure S6, Table S1, page 10, 14 and 16.
A) Schematic for comparison of differential loops to differential gene expression in neurons with DSBs. Differential loops were identified for increasing fold change thresholds of loop score. For each differential loop, genes within +/− 5 kb of the loop base were identified and the percentage of differentially expressed genes (DEGs) was calculated. Percentage DEGs were then plotted against the thresholds used for calling the differential loops. B) Percentage of up (green) and down (red) DEGs vs loop fold change for loop loss in both Step 1 and 2. Red and green dotted lines are the baseline percentage of up and down DEGs genome-wide, respectively. C) Gene ontology analysis (GORILLA) of loop loss-associated down-regulated genes.
Figure 6:
Figure 6:. Up-regulation of cohesin and histone genes in Alzheimer’s Disease. See also Figure S6 and Table S1, page 5, 15, and 16.
A) Heatmap of differential gene expression as z-scores from bulk RNA-seq in Control, Step 1, and Step 2 for signature gene sets. The right panels show average values for each set. B) Heatmap of differential expression of histone and cohesin genes across excitatory subtypes in 10x snRNA-seq from Mathys et al. (*differential). C) Representative immunostaining images of RAD21 in AD and Control human post-mortem tissue. D) RAD21 staining was quantified as the percentage of neurons with high RAD21 (mean intensity > 50th percentile) per image (left) or using RAD21 mean intensity (right). Significance was calculated using a linear mixed-model approach across 3 AD and 3 Control individuals (Table S15). E) Hi-C interaction matrix for histone gene cluster (green blocks, chr13). The lower diagonal is Step 1 or 2, upper is Control. F) Differential Hi-C heatmaps comparing Step 1/Control and Step 2/Control, colored by increased (red) or decreased (blue) interactions over control. Hi-C heatmaps were rotated 45 degrees and only the upper triangle is shown.

Comment in

References

    1. Lu T, Pan Y, Kao SY, Li C, Kohane I, Chan J, and Yankner BA (2004). Gene regulation and DNA damage in the ageing human brain. Nature 429, 883–891. 10.1038/nature02661. - DOI - PubMed
    1. Madabhushi R, Pan L, and Tsai LH (2014). DNA damage and its links to neurodegeneration. Neuron 83, 266–282. 10.1016/j.neuron.2014.06.034. - DOI - PMC - PubMed
    1. Provasek VE, Mitra J, Malojirao VH, and Hegde ML (2022). DNA Double-Strand Breaks as Pathogenic Lesions in Neurological Disorders. Int. J. Mol. Sci. 23. 10.3390/ijms23094653. - DOI - PMC - PubMed
    1. Adamec E, Vonsattel JP, and Nixon RA (1999). DNA strand breaks in Alzheimer’s disease. Brain Res. 849, 67–77. 10.1016/S0006-8993(99)02004-1. - DOI - PubMed
    1. Thadathil N, Delotterie DF, Xiao J, Hori R, McDonald MP, and Khan MM (2020). DNA Double-Strand Break Accumulation in Alzheimer’s Disease: Evidence from Experimental Models and Postmortem Human Brains. Mol. Neurobiol, 1–14. 10.1007/s12035-020-02109-8. - DOI - PubMed

Publication types