. 2023 Sep 28;186(20):4422-4437.e21.
doi: 10.1016/j.cell.2023.08.040.

Epigenomic dissection of Alzheimer's disease pinpoints causal variants and reveals epigenome erosion

Affiliations

Epigenomic dissection of Alzheimer's disease pinpoints causal variants and reveals epigenome erosion

Xushen Xiong et al. Cell. .

Abstract

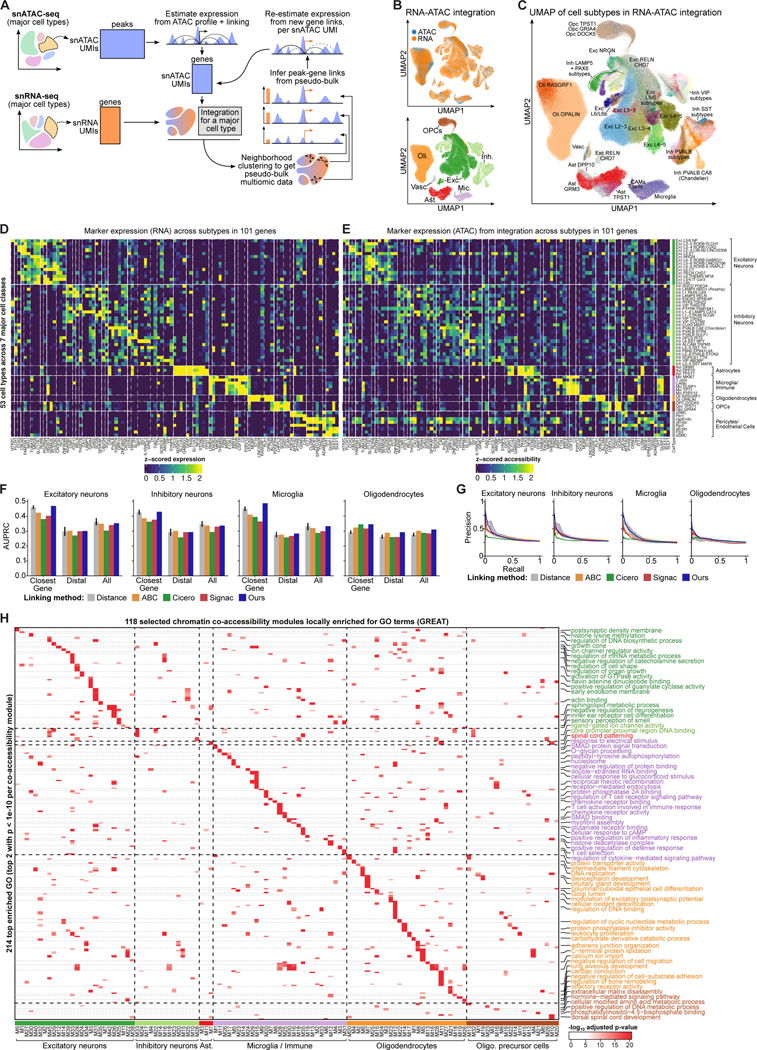
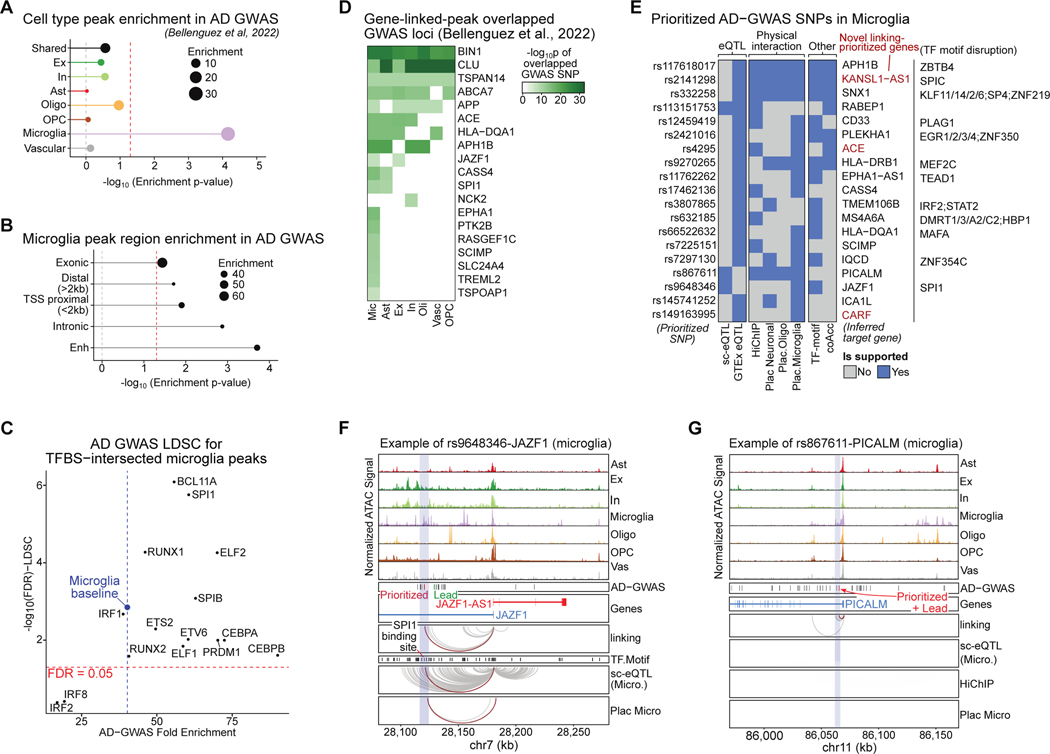
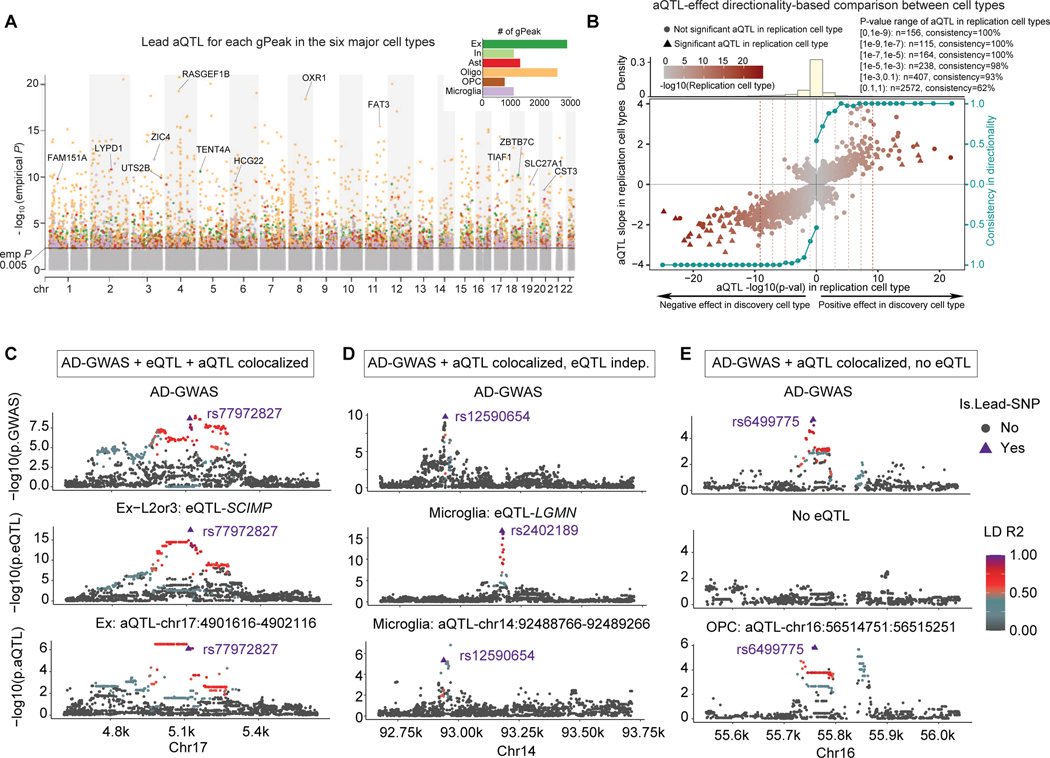
Recent work has identified dozens of non-coding loci for Alzheimer's disease (AD) risk, but their mechanisms and AD transcriptional regulatory circuitry are poorly understood. Here, we profile epigenomic and transcriptomic landscapes of 850,000 nuclei from prefrontal cortexes of 92 individuals with and without AD to build a map of the brain regulome, including epigenomic profiles, transcriptional regulators, co-accessibility modules, and peak-to-gene links in a cell-type-specific manner. We develop methods for multimodal integration and detecting regulatory modules using peak-to-gene linking. We show AD risk loci are enriched in microglial enhancers and for specific TFs including SPI1, ELF2, and RUNX1. We detect 9,628 cell-type-specific ATAC-QTL loci, which we integrate alongside peak-to-gene links to prioritize AD variant regulatory circuits. We report differential accessibility of regulatory modules in late AD in glia and in early AD in neurons. Strikingly, late-stage AD brains show global epigenome dysregulation indicative of epigenome erosion and cell identity loss.

Keywords: ATAC-QTL; Alzheimer’s disease; GWAS; epigenome; epigenome erosion; fine-mapping; multimodal integration; peak-to-gene linking.


Conflict of interest statement

Declaration of interests L.-H.T. is a member of the Scientific Advisory Boards of Cognito Therapeutics, 4M Therapeutics, Cell Signaling Technology, and Souvien Therapeutics, which have no association to the work described in this manuscript.

Figures

Figure 1.
Figure 1.. Study design and epigenomic landscape across human brain cell types.
A. Overview of study design, sample collection, single-cell profiling and analyses. B. UMAP for snRNA-seq across major brain cell types. C. UMAP for snATAC-seq across major brain cell types based on the 500 bp tile matrix. D. ATAC-inferred gene expression across the marker gene sets from major cell types curated by PsychENCODE (mean, column-scaled). E. Number of peaks per cell type (union: peaks in 1+ cell types). TSS proximal defined as regions within 2 kb of TSS , distal as intergenic regions >2kb from TSSes. F. GREAT enrichment annotation of cell-type-specific peaks. G. ChromVar motif enrichment of the 44 candidate TF regulators identified across cell types. Left panel shows Pearson correlation between chromVar and ATAC-inferred TF expression. H. Inferred gene expression of the regulators (ATAC gene-score using ArchR). I. Regulator expression (snRNA-seq) across cell types. Right panel shows Pearson correlation between expression and ATAC-inferred TF expression. J. Motif enrichment (left) and inferred gene expression (right) of candidate TF regulators (NeuroD6 in excitatory neurons, SOX10 in oligodendrocytes, and SPI1 in microglia). See also Figure S1, Tables S1 and S2.
Figure 2.
Figure 2.. snATAC and snRNA integration enables peak-to-gene link calling
A. Schematic for the cell-type-specific integration framework. B. UMAP of joint ATAC and RNA cell embedding (top) with major cell type assignments (bottom). C. UMAP of joint embedding colored with the high-resolution sub-cell-type annotation. D. Gene expression of marker genes across sub-cell-types in snRNA. E. Estimated gene-score of marker genes across sub-cell-types in snATAC. F. Recovery (AUPRC) of cell-type-specific PLAC-seq by inferred links (ABC: activity-by-contact method). G. Precision-recall curves for cell-type-specific PLAC-seq. H. GREAT enrichment of cell-type-specific ATAC modules. See also Figure S2, Tables S3 and S4.
Figure 3.
Figure 3.. AD-GWAS enrichment and variant prioritization in microglia
A. Heritability enrichment of peaks in each cell type (using stratified-LDSC; shared peaks: 5+ cell types). B. Heritability enrichment of microglia peaks partitioned by genomic location. C. Scatterplot of heritability enrichment of TFBS-intersected microglia peaks (blue dotted line is overall microglia enrichment). D. AD-GWAS loci located in gene-linked peaks for each cell type. E. Multiple lines of evidence supporting prioritized SNP-gene pairs in microglia. TFBS containing the prioritized variants are shown on the right. F. Example of prioritized AD-GWAS variant rs9648346 predicted to target JAZF1 in microglia. rs9648346 is in microglia-specific peak, interferes with SPI1 binding sites, and the link is supported by microglia eQTL and microglia PLAC-seq. G. Example of prioritized variant rs867611 that is predicted to target PICALM in microglia. rs867611 is a AD-GWAS lead variant at the locus and is prioritized by the multi-evidence framework. See also Figure S3, Table S5.
Figure 4.
Figure 4.. ATAC-QTL analysis and colocalization with AD-GWAS
A. ATAC-QTL (aQTL) Manhattan plot (lead SNP shown), colored by cell types. Nearest genes of the top aQTL loci from each cell type are indicated. Barplot inset shows the number of genetically-associated peaks (gPeak) discovered in each cell type. B. Directionality consistency (shown by the right axis) analysis of aQTL effect size (left y-axis) between cell types. For the significant aQTLs in the discovery cell type, the consistency increases as the p-value significance (x-axis) of the replication cell type increases for aQTLs with both positive-effect (right half-plane) and negative-effect (left half-plane). The top panel represents the distribution of aQTL loci within each p-value bin. Separated plots that show the pairwise cell-type comparison are shown in Figure S4C. C. Example of consistent genetic colocalization across AD-GWAS, cell-type-specific eQTL, and aQTL for the SCIMP locus in excitatory neurons (lead variant shown as triangle). D. Example of aQTL-AD-GWAS colocalization near the LGMN locus in microglia, with a non-colocalized eQTL in the locus. E. Example of aQTL-AD-GWAS colocalized locus without any eQTL signal observed in the locus. See also Figure S4, Table S5.
Figure 5.
Figure 5.. AD-differential cell composition and ATAC changes
A. GREAT functional enrichments of AD-differentially accessible (*p<0.05, **p<0.01, ***p<0.001). B. Major cell type compositional changes in snRNA-seq comparing non-AD, early-AD and late-AD participants (Anova using propeller). Right panel is the total number of cells. C. Major cell type compositional changes in snATAC-seq. D. Sub-cell-type compositional changes in snATAC-seq between non-AD, early-AD and late-AD participants (fractions within each major cell type). See also Figure S5, Table S6.
Figure 6.
Figure 6.. Cell identity loss and epigenome erosion in late-stage AD
A. UMAP for snATAC-seq (TSS-enrichment>1), colored by major cell types. B. Major and de-identified cell type compositional changes in snATAC-seq comparing late-stage AD to control and early-stage AD (Anova using propeller, inset for magnification). C. Scatterplot of the fraction of de-identified oligodendrocytes in this study versus the fraction of undetermined/dying snRNA cells from Kousi et al.46 for the 9 individuals shared between the two studies. Boxplots show cell-fraction comparisons between AD groups within each study (Wilcoxon). D. Log fold change of the fraction of reads in chromatin states (ChromHMM) between de-identified cells vs. the corresponding normal cells for four major cell types. E. Example pseudo-bulk ATAC signal for normal and de-identified cells in cell-type-specific peaks (blue box) and constitutive peaks (yellow). Right panels show the signal distribution in intergenic regions. F. UMAP of cell-level erosion scores, quantified based on the distribution of reads in ChromHMM states (higher score represents increased erosion). G. Erosion score comparison between different AD groups in each cell type (Wilcoxon). H. Average oligodendrocyte ATAC profiles at compartment A/B boundaries (left/right) for non-AD, early-AD and late-AD participants. Barplots show difference of means within compartments after/before A/B boundaries (insets) and the difference between the aggregate signals (bottom panels). I. Difference between boundary A and B for each AD group in each cell type. J. Joint immunostaining of Lamin-B1 and NeuN on a low-erosion MFC sample. The inset shows a single z-stack with LaminB1/NeuN/Hoechst together (top left), NeuN (bottom left), Lamin B1 (top right) and Hoechst (bottom right) in the bottom panel. K. Examples of low and high erosion samples at two magnifications (left and center, Lamin B1 and Hoechst). Intensity of Lamin B1 expression was measured on masks created around NeuN-positive cell surfaces. Quantification of LaminB1 intensity (right) across 5 low (n= 91 to 164 NeuN-positive cell surfaces) and 5 high erosion samples (n= 85 to 173) (t-test). L. Differential TF motif enrichments between de-identified cells versus normal cells for excitatory neurons (green), inhibitory neurons (light green) and oligodendrocytes (orange) based on chromVar (from TF regulators in Figure 1G). See also Figure S6, Table S7.

Comment in

References

    1. Wilson RS, Boyle PA, Yu L, Barnes LL, Sytsma J, Buchman AS, Bennett DA, and Schneider JA (2015). Temporal course and pathologic basis of unawareness of memory loss in dementia. Neurology 85, 984–991. - PMC - PubMed
    1. Bennett DA, Wilson RS, Schneider JA, Evans DA, Beckett LA, Aggarwal NT, Barnes LL, Fox JH, and Bach J. (2002). Natural history of mild cognitive impairment in older persons. Neurology 59, 198–205. - PubMed
    1. Bennett DA, Schneider JA, Wilson RS, Bienias JL, and Arnold SE (2004). Neurofibrillary tangles mediate the association of amyloid load with clinical Alzheimer disease and level of cognitive function. Arch. Neurol 61, 378–384. - PubMed
    1. Braak H, and Braak E. (1995). Staging of Alzheimer’s disease-related neurofibrillary changes. Neurobiol. Aging 16, 271–278; discussion 278–284. - PubMed
    1. Querfurth HW, and LaFerla FM (2010). Alzheimer’s disease. N. Engl. J. Med 362, 329–344. - PubMed

Publication types

LinkOut - more resources