. 2023 Oct 9;41(10):1731-1748.e8.
doi: 10.1016/j.ccell.2023.09.006. Epub 2023 Sep 28.

Loss of p53 and mutational heterogeneity drives immune resistance in an autochthonous mouse lung cancer model with high tumor mutational burden

Affiliations

Loss of p53 and mutational heterogeneity drives immune resistance in an autochthonous mouse lung cancer model with high tumor mutational burden

Mingrui Zhu et al. Cancer Cell. .

Abstract

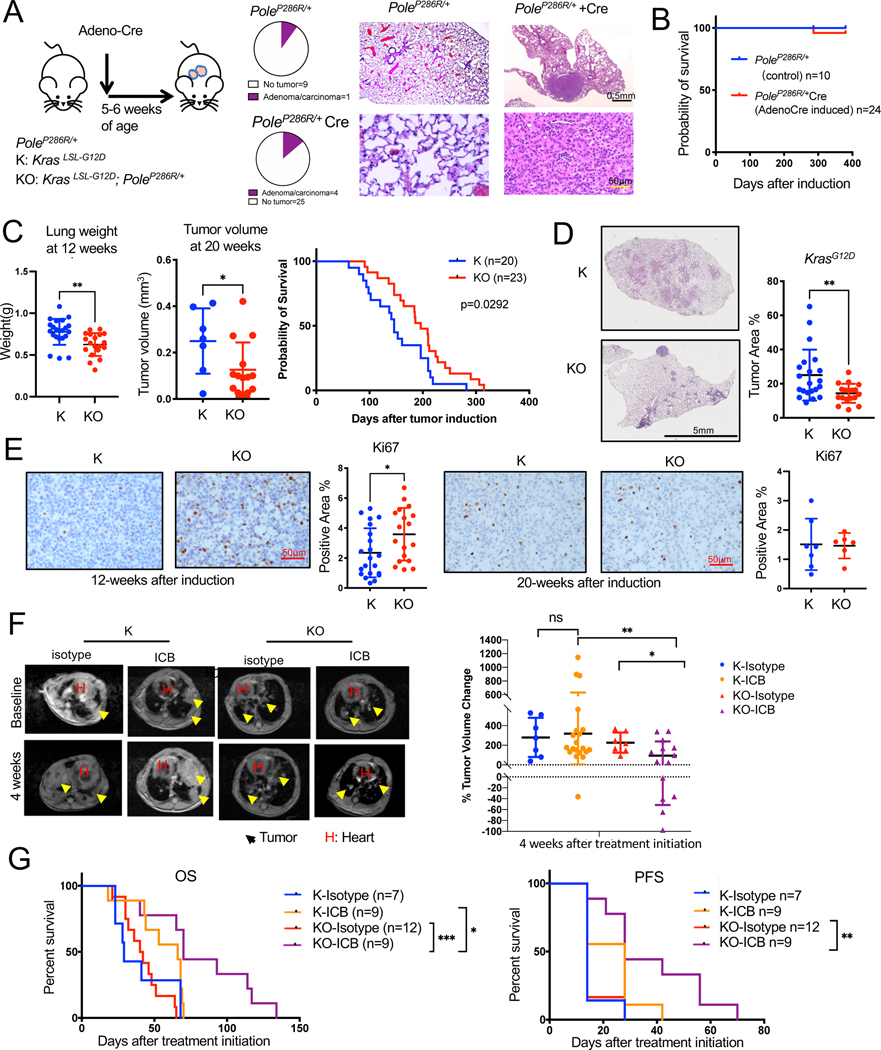
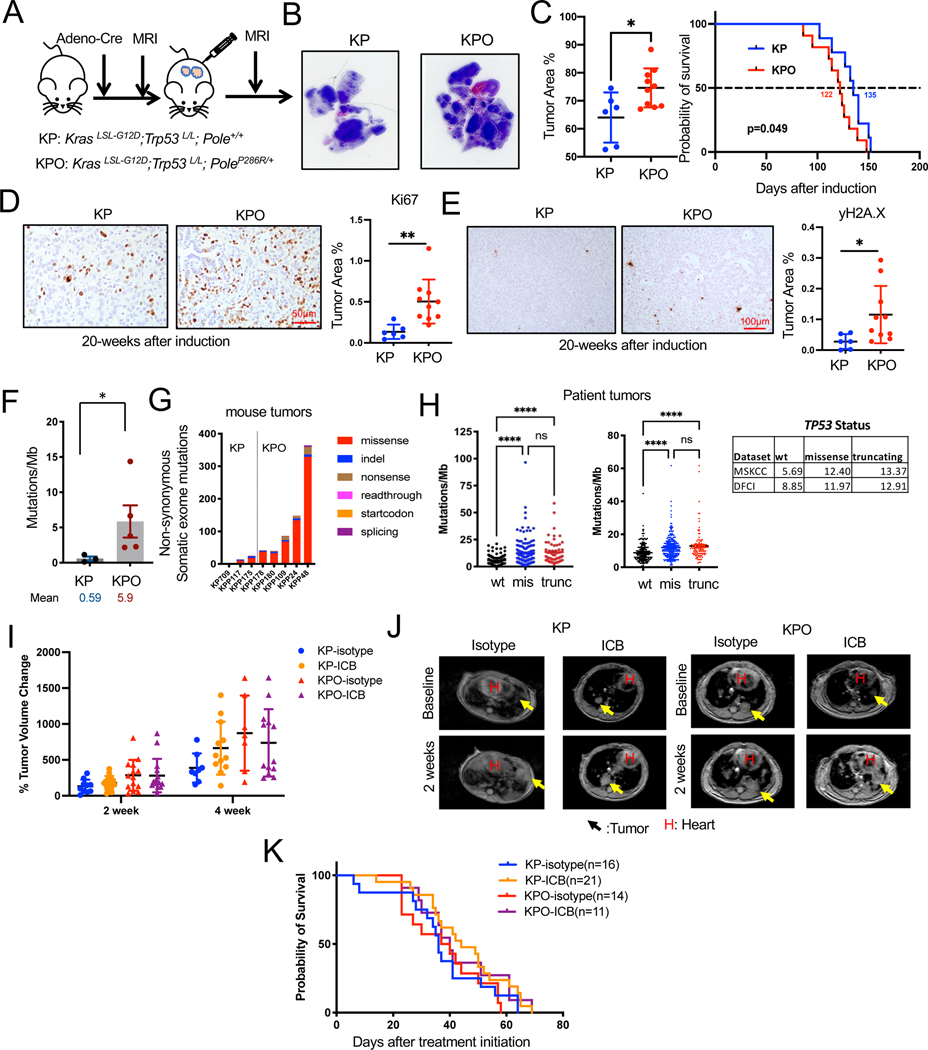
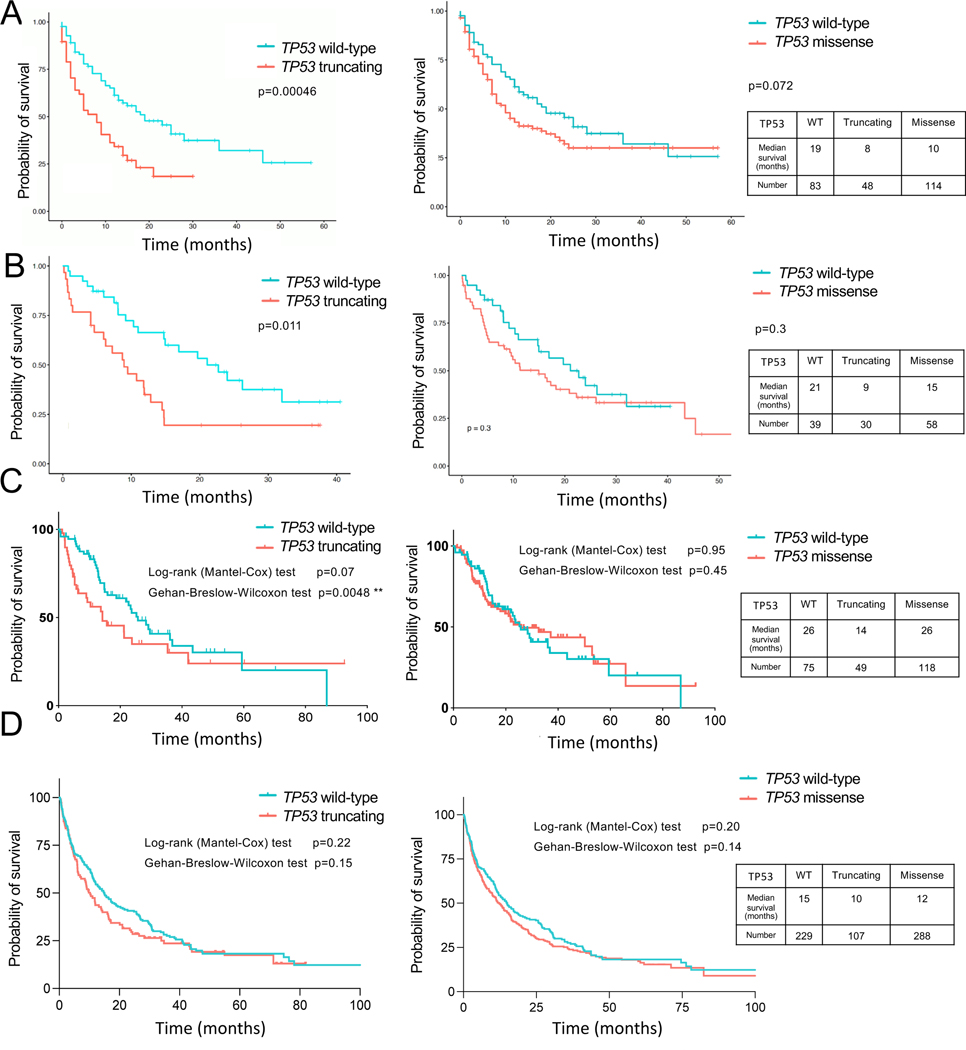
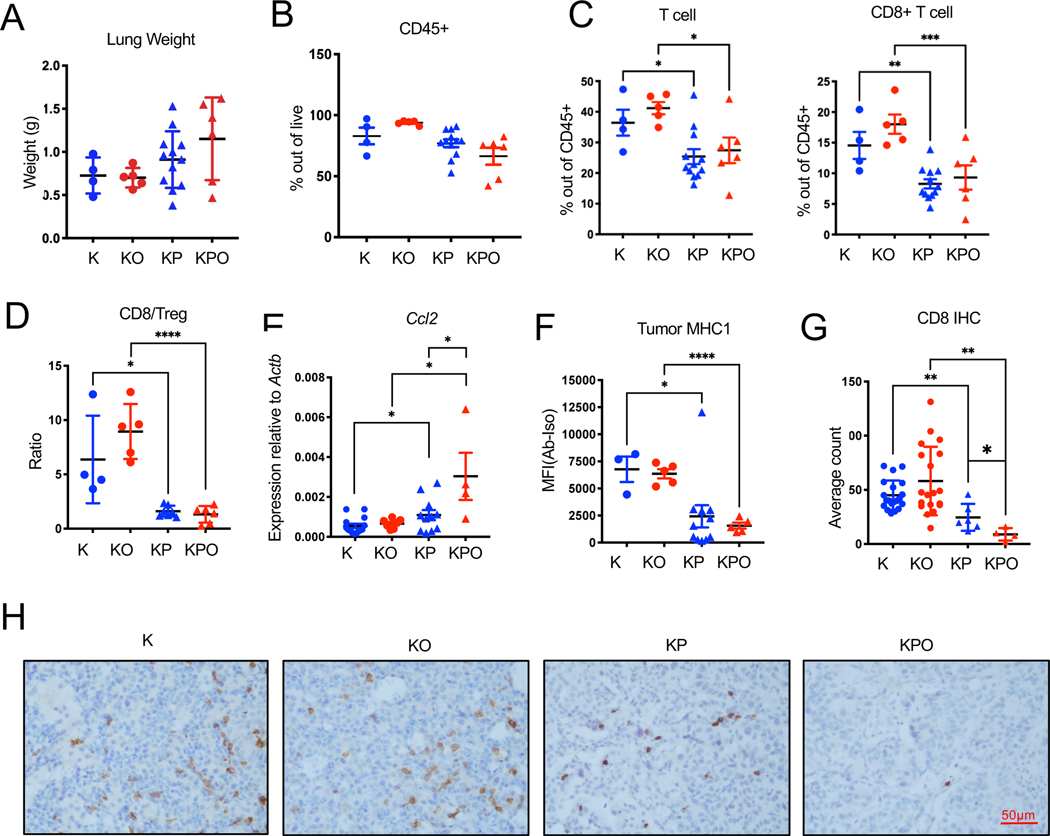
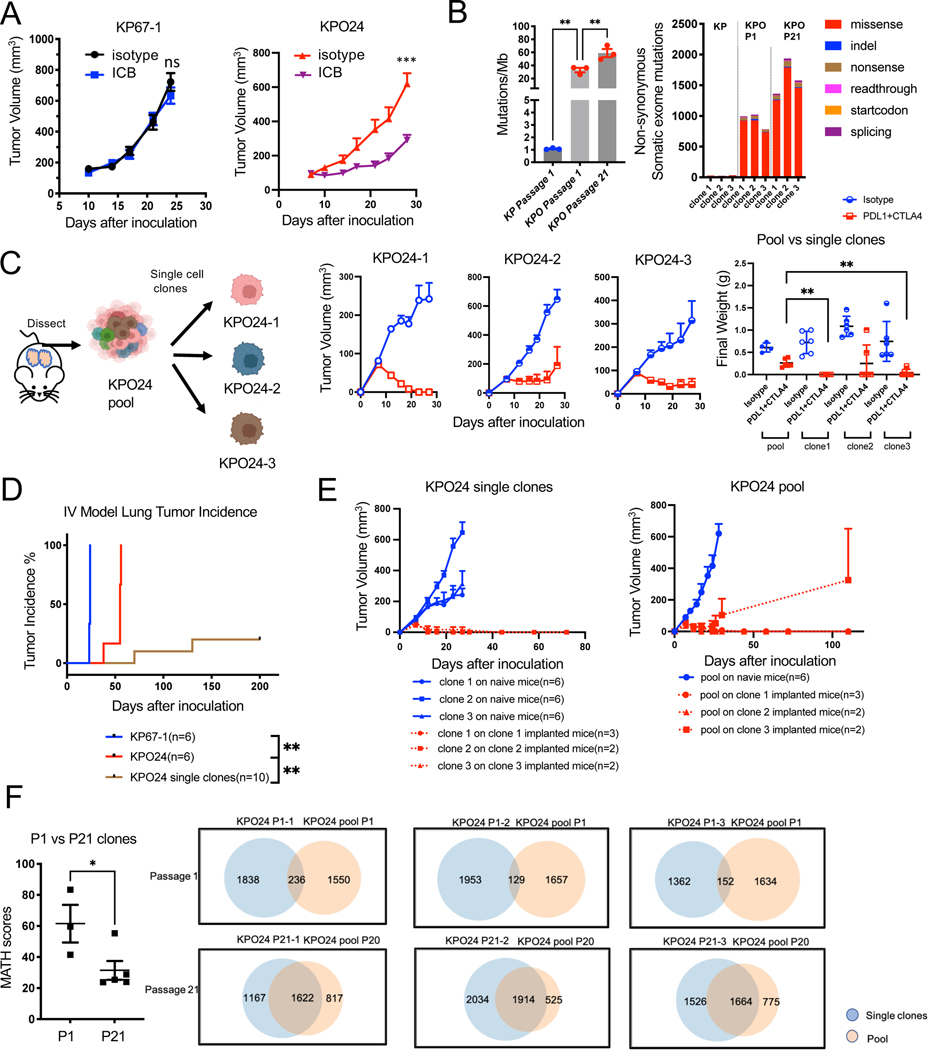
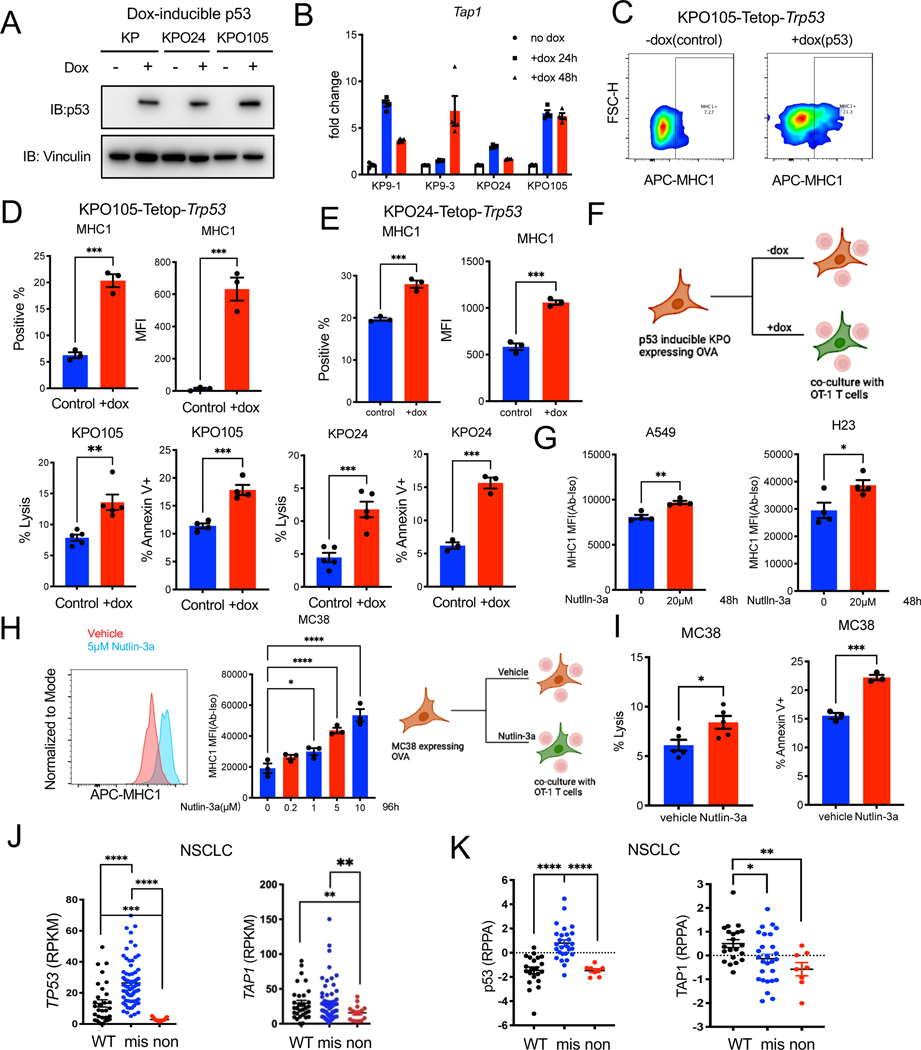
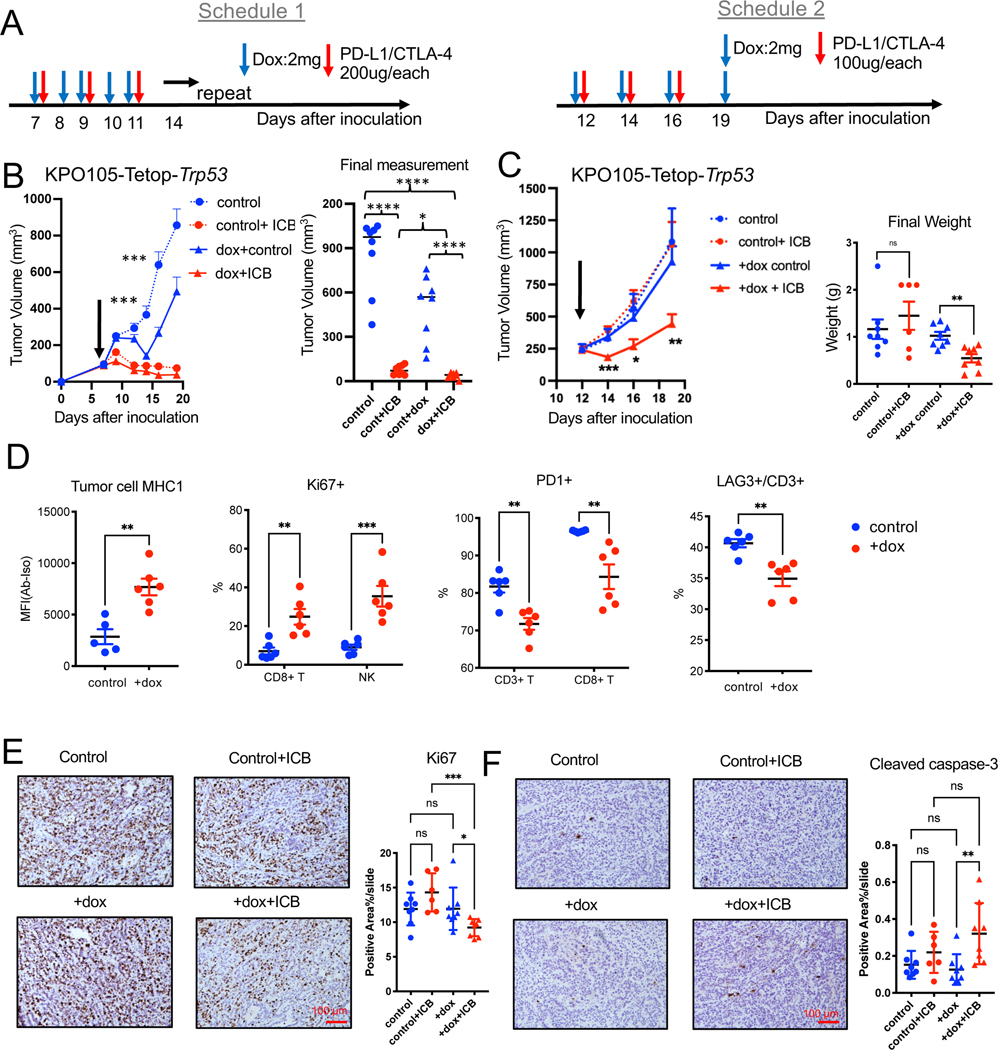
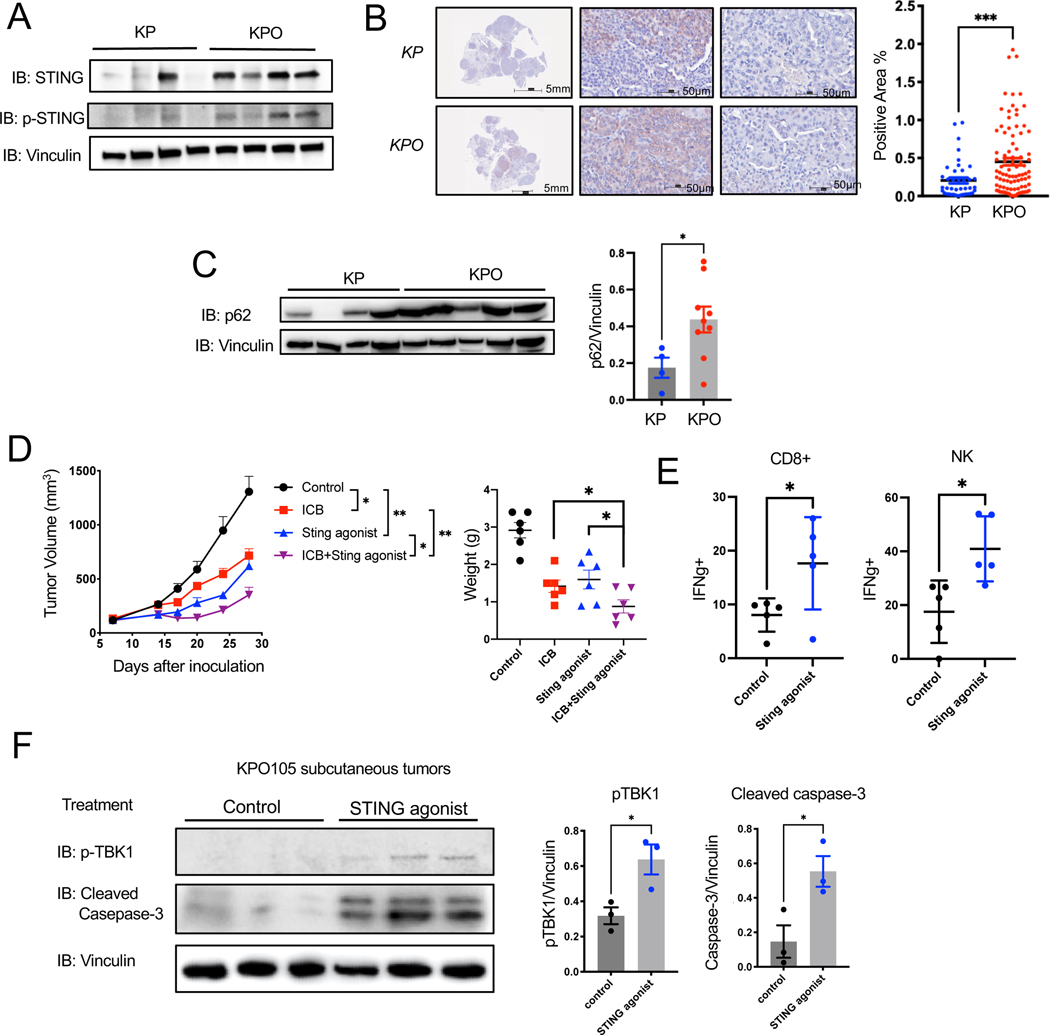
The role of tumor mutational burden (TMB) in shaping tumor immunity is a key question that has not been addressable using genetically engineered mouse models (GEMMs) of lung cancer. To induce TMB in lung GEMMs, we expressed an ultra-mutator variant of DNA polymerase-E (POLE)P286R in lung epithelial cells. Introduction of PoleP286R allele into KrasG12D and KrasG12D; p53L/L (KP) models significantly increase their TMB. Immunogenicity and sensitivity to immune checkpoint blockade (ICB) induced by Pole is partially dependent on p53. Corroborating these observations, survival of NSCLC patients whose tumors have TP53truncating mutations is shorter than those with TP53WT with immunotherapy. Immune resistance is in part through reduced antigen presentation and in part due to mutational heterogeneity. Total STING protein levels are elevated in Pole mutated KP tumors creating a vulnerability. A stable polyvalent STING agonist or p53 induction increases sensitivity to immunotherapy offering therapeutic options in these polyclonal tumors.

Keywords: GEMM; Immunotherapy; Kras; TMB; TP53; antigen presentation; clonality; heterogeneity; mice; patient survival.


Conflict of interest statement

Declaration of interests J.G. has patents related to this work and is scientific co-founder and advisor of OncoNano Medicine, Inc. J.D.M. receives licensing fees from the NCI and UT Southwestern to distribute cell lines. J.V.A. receives Advisory Board fee from BMS. B.R. served as consultant/advisory board for Regeneron, AMGEN, and AstraZeneca and received honoraria from Targeted Oncology. M.M.A. reports serving as a consultant to Merck, Bristol-Myers Squibb, Genentech, AstraZeneca, Nektar, Maverick, Blueprint Medicine, Syndax, AbbVie, Gritstone, ArcherDX, Mirati, NextCure, and EMD Serono; receiving research funding from Bristol-Myers Squibb, Eli Lilly, Genentech, and AstraZeneca.

Figures

Figure 1.
Figure 1.. PoleP286R is not a driver of lung tumor initiation by itself but addition of PoleP286R to KrasG12D/+ increases their TMB.
(A) Schema for GEMM tumor induction by intranasal Adeno-Cre. Pie chart showing incidence of tumors in the lung of uninduced PoleLSL-P286R/+ control and induced PoleP286R/+ mice. Representative H&E staining of tumor free lung and a tumor in the lung of uninduced PoleLSL-P286R/+ control and induced PoleP286R/+ mice. Control n=10, induced n=29. (B) Survival curves for PoleLSL-P286R/+ control and induced PoleP286R/+ animals analyzed by Log-rank test. All animals except for the one that died were euthanatized at ~70 weeks for observation of tumors in the lungs. Control n=10, induced n=24. (C) Tumor progression of K and KO GEMMs was measured by lung weight (left) and MRI (middle) at 12 (n=22 for K, n=19 for KO) and 20 weeks (n=7 for K, n=14 for KO) respectively (Unpaired t-test, Error bar: SD). 12-week tumors were not always detectable my MRI. Survival curves for K/KO mice are on the right (n=20 for K, n=23 for KO, Log-rank test). Mice were recorded as dead when they either died or reached euthanasia point. (D) Representative H&E-stained lung sections of K and KO GEMMs (12-week: n=21 for K, n=18 for KO. Unpaired t-test was utilized. Error bar: standard deviation (SD)). Tumor area is quantified on the right. (E) Ki67 immunohistochemistry (IHC) on K and KO GEMM lung tissues (12-week: n=21 for K, n=18 for KO. 20-week: n=7 for K, n=6 for KO, Unpaired t-test. Error bar: SD). Representative images (left) and quantification of staining (right) shown. (F) Combination of PD-L1 and CTLA-4 antibodies immune checkpoint blockade (ICB) treatment of K and KO GEMMs. Representative MRI images (left) and quantification of lung tumors at 4 weeks after treatment initiation (right). Yellow arrows point to tumors. H: heart. N=8 for K-isotype, n=12 for K-ICB, n=7 for KO-isotype, n=14 for KO-ICB. Unpaired t-test. Error bar: SD. (G) Overall survival (OS) and progression-free survival (PFS) of K/KO mice under isotype or ICB treatment analyzed by Log-rank test. Progression is defined by the timepoint when tumor volume increases more than 20% of baseline tumor volume. N=7 for K-isotype, n=9 for K-ICB, n=12 for KO-isotype, n=9 for KO-ICB. Log-rank test. For all figures, *: p<0.05, **: p<0.01, ***: p<0.001, ****: p<0.0001. Also see Figure S1.
Figure 2.
Figure 2.. Addition of PoleP286R accelerated the progression of KrasG12D/+;p53−/− tumors.
(A) Schema for GEMM tumor induction by intranasal Adeno-Cre. (B) Representative H&E stains of lungs from KP and KPO GEMMs with tumor area quantification as % of normal area quantified on the right. N=6 for KP, n=10 for KPO, Unpaired t-test, Error bar: SD. (C) Survival of KP and KPO GEMMs after tumor induction. N=9 for KP, n=11 for KPO, Log-rank test. (D) Ki67 IHC on KP and KPO GEMM lung tissues. Representative image is shown on the left and stained area is quantified on the right. N=6 for KP, n=10 for KPO. Statistical test: Unpaired t-test, Error bar: SD. (E) γH2AX IHC on KP and KPO GEMM lung tissues. Representative images are shown on the left and quantification of stained area is shown on the right. N=6 for KP, n=10 for KPO. Statistical test: Unpaired t-test, Error bar: SD. (F) Total mutations/MB determined by whole exome sequencing of KP vs KPO tumors. N=3 for KP, n=5 for KPO, Mann Whitney test, Error bar: standard error of the mean (SEM). (G) Distribution of the type of mutations in KP vs KPO tumors. (H) TMB (Tumor Mutational Burden) in NSCLC (Non-Small Cell Lung Carcinoma) patients classified based on TP53 status from MSKCC and DFCI cohort. Sample n: sample number. (I) Lung tumor volume quantification of KP and KPO mice treated with ICB after tumor confirmation by MRI. Changes in tumor volumes at indicated timepoints after treatment initiation is shown. N=10 for KP-isotype, n=14 for KP-ICB, n=14 for KPO-isotype, n=15 for KPO-ICB, Error bar: SD. (J) Representative MRI images from the mice in H, 2 weeks after treatment initiation. Arrows point to tumors. H: heart. (K) Survival of treated mice in H. Also see Figure S1.
Figure 3.
Figure 3.. TP53 truncating mutations decrease overall survival of NSCLC patients receiving ICB.
Overall survival of NSCLC patients carrying TP53 wild-type, TP53 truncating mutations (nonsense and frameshift mutations combined) and TP53 missense mutations after receiving ICB. STK11/KEAP1 WT cases were included in the analysis. Source of the data are as follows. (A) Samstein et al, Nature Genetics, 2019. Log-rank test. (B) AACR Genie, patients treated with pembrolizumab. Log-rank test. (C) Ravi et al , Nature Genetics, 2023. (D) NSCLC patients from DFCI cohort.
Figure 4.
Figure 4.. Immune profile of Pole+/+ or PoleP286R/+ GEMMs.
Tumor microenvironment of K/KO, KP/KPO mouse lungs were analyzed by flow cytometry and immunohistochemistry. (A) Lung weights of analyzed of the mice included in analysis. Mice were euthanatized at 16 weeks after tumor induction. N=4 for K, n=5 for KO, n=12 for KP, n=6 for KPO. Error bar: SD. (B) Total CD45+ cell percentage out of all live cells in K, KO, KP, and KPO tumors determined by flow cytometry. N=4 for K, n=5 for KO, n=12 for KP, n=6 for KPO. Error bar: SEM. (C) Total T cell (CD3+) and cytotoxic T cell (CD3+CD8+) percentages out of all CD45+ cells in K, KO, KP, KPO tumors. N=4 for K, n=5 for KO, n=12 for KP, n=6 for KPO. Error bar: SEM. Unpaired t-test. (D) Quantification of CD8/Treg ratios in K, KO, KP, and KPO tumors. N=4 for K, n=5 for KO, n=7 for KP, n=6 for KPO. Error bar: SD. Unpaired t-test. (E) CCL2 levels in lung tumors were determined by qPCR of RNA extracted from lung tumor tissues. N=14 for K, n=7 for KO, n=11 for KP, n=4 for KPO. Error bar: SEM. Unpaired t-test. (F) Expression of MHC1 on GEMM tumor cells (Epcam+) determined by flow cytometry of K, KO, KP, and KPO lung tissue. N=3 for K, n=5 for KO, n=11 for KP, n=5 for KPO. Error bar: SEM. Unpaired t-test. (G) Quantification of CD8 T cells from the IHC staining of K, KO, KP and KPO GEMM lung tissues. N=20 for K, n=19 for KO, n=6 for KP, n=4 for KPO. Error bar: SD. Statistical test: Unpaired t-test. (H) Representative IHC images of CD8 IHC in K, KO, KP and KPO GEMMs. Also see Figure S2.
Figure 5.
Figure 5.. Tumor heterogeneity contributes to immune escape in KPO syngeneic model.
(A) Growth curve for subcutaneously implanted KP67–1 (n=8 for isotype, n=8 for ICB, Error bar: SEM. Unpaired t-test.) derived from KP tumors and KPO24 (n=4 for isotype, n=6 for ICB, Error bar: SEM. Unpaired t-test.) derived from KrasG12D/+;p53−/;PoleP286R/+ syngeneic models treated with isotype control or ICB. ns: not significant. (B) Left: Tumor mutational burden (TMB) of KP cell line (passage 1) and KPO cell line clones KPO24–1, KPO24–2, and KPO24–3 at passage 1 and passage 21. Right: Distribution of mutation types in KP vs KPO syngeneic cell lines. N=3 per group. Error bar: SEM. Unpaired t-test. (C) Schema for generating single cell clones from KPO24. In vivo tumor growth of single clones 1–3 (n=6 for isotype, n=6 for ICB, Error bar: SEM in curve, SD in scatterplot. Unpaired t-test.) derived from syngeneic cell line KPO24 implanted subcutaneously and treated with isotype or ICB. Weights of dissected tumors shown on the right. (D) Lung tumor incidence for KP67–1 and KPO24 pool or single cell clones derived from KPO24 cells injected intravenously (IV) into mice. Any tumor presence was recorded as an incidence. Log-rank test. (E) Re-challenge experiment with pool vs single clone models. Growth of KPO24 single clone on either tumor/treatment-naïve mice or mice which were previously implanted with corresponding single clone KPO tumors that regressed upon ICB (left). Growth of KPO24 pool syngeneic line on either tumor/treatment naïve mice or mice which previously were implanted with single clone KPO tumors that regressed with ICB (left). Error bar: SEM. (F) Quantification of MATH (Mutant-Allele Tumor Heterogeneity) score of KPO syngeneic lines between passage 1 and passage 21 (left). Venn diagram showing the number of shared mutations between KPO single clone and corresponding pool in passage 1 vs 21 (right). N=3 for p1, n=5 for >p20. Error bar: SEM. Unpaired t-test.) Also see Figures S3, S4, and S5.
Figure 6.
Figure 6.. p53 induction increases immunogenicity of tumor cells and induces T cell cytotoxicity
(A) Western blot for p53 and vinculin in KP, KPO lines stably transduced with pLVX-Tet-ON Advanced and pLVX-Tight puro-Trp53 and treated with doxycycline for 48 hours. (B) qPCR for Tap1 in KP and KPO-TetOp-Trp53 lines treated with doxycycline for the indicated times. N=3 per group. Error bar: SD. (C) Representative contour plot showing MHC1 expression in KPO105-TetOp-Trp53 model treated with doxycycline for 48 hours as determined by flow cytometry. (D) Quantification of MHC1 expression determined by flow cytometry in KPO105-TetOp-Trp53 model with and without doxycycline. N=3 for control, n=3 for +dox. Error bar: SEM. Unpaired t-test. (E) Quantification of MHC1 expression in KPO24-TetOp-Trp53 model treated with doxycycline for 48 hours as determined by flow cytometry. N=3 for control, n=3 for +dox. Error bar: SEM. Unpaired t-test. (F) T cell specific killing measured by LDH release of co-cultures of p53 inducible KPO lines (KPO105 and KPO24) expressing OVA with OT-1 T cells isolated from OT-1 transgenic mouse spleens. Apoptosis of tumor cells was evaluated by Annexin V staining and analyzed by flow cytometry. LDH lysis: n=5 for control, n=5 for +dox. Error bar: SEM. Unpaired t-test. Annexin V staining: n=3 for control, n=3 for +dox. Error bar: SEM. Unpaired t-test. (G) MHC1 expression in human NSCLC lines A549 and H23 treated with 20μM Nutlin-3a for 48h determined by flow cytometry. N=4 for vehicle, n=4 for Nutlin-3a. Error bar: SEM. Unpaired t-test. (H) MHC1 expression in MC38 cells treated with varying Nutlin-3a doses for 96h as determined by flow cytometry. N=3 per group. Error bar: SEM. Unpaired t-test. (I) T cell specific killing measured by LDH release in co-cultures of nutlin-3a pre-treated OVA expressing MC38 cells with OT-1 T cells. Apoptosis of tumor cells was measured by Annexin V staining and analyzed by flow cytometry. LDH lysis: n=5 for control, n=5 for +dox. Error bar: SEM. Unpaired t-test. Annexin V staining: n=3 for control, n=3 for +dox. Error bar: SEM. Unpaired t-test. (J) TP53 and TAP1 mRNA level in NSCLC lines with wild-type, missense or nonsense TP53 mutations from Cancer Cell Line Encyclopedia (CCLE). (K) p53 and TAP1 protein levels in NSCLC lines with WT, missense or nonsense TP53 mutations (data from CCLE). Also see Figure S6.
Figure 7.
Figure 7.. p53 induction increases sensitivity to ICB in vivo.
(A) Schedules for combination treatments of doxycycline and ICB. (B) Growth of subcutaneous KPO105-TetOp-Trp53 tumors treated with doxycycline, ICB, or combination of doxycycline and ICB with schedule 1 at baseline volume of 100mm3. Final measurements of tumor volumes are shown on the right. n=8 for control. n=8 for Control+ICB. n=8 for +dox control. n=8 for +dox+ICB. Error bar: SEM. Unpaired t-test. ***: comparison of control and +dox groups. (C) Growth of subcutaneous KPO105-TetOp-Trp53 tumors treated with doxycycline (dox), ICB, or combination of doxycycline and ICB with schedule 2 at baseline volume of 250mm3 (left) and weights of final dissected tumors are shown on the right. n=8 for control. n=6 for Control+ICB. n=8 for +dox control. n=8 for +dox+ICB. Error bar: SEM. Unpaired t-test. (D) Flow cytometry analysis of KPO105-TetOp-Trp53 tumors from mice treated with vehicle or doxycycline showing expression on MHC1 on tumor cells (Epcam+) (n=5 for control, n=6 for +dox), and other markers (Ki67, PD-1, LAG-3+) (n=6 for control, n=6 for +dox) on CD3+ T cells, CD8+ T cells or NK cells. Error bar: SD. Unpaired t-test. (E) IHC for Ki67 on KPO105-TetOp-Trp53 tumors treated with doxycycline, ICB, or combination of doxycycline and ICB (schedule 1). Representative images are shown on the left and quantification of stained area are shown on the right. n=8 for control. n=6 for Control+ICB. n=8 for +dox control. n=8 for +dox+ICB. Error bar: SD. Unpaired t-test. (F) IHC for cleaved caspase-3 on KPO105-TetOp-Trp53 tumors treated with doxycycline, ICB, or combination of doxycycline and ICB (schedule 1). Representative images are shown on the left and quantification of stained area on the right. n=8 for control. n=6 for Control+ICB. n=8 for +dox control. n=8 for +dox+ICB. Error bar: SD. Unpaired t-test. Also see Figure S6.
Figure 8.
Figure 8.. Sting is expressed heterogeneously in PoleP286R lung tumors and is a therapeutic target.
(A) Western blot for STING, pSTING, and vinculin on tumors from KP and KPO GEMMs (top left). (B) Representative IHC for STING on lung tumors from KP and KPO GEMMs (left). Positive and negative stained tumor nodules are shown from the same mouse tissue scan and quantification of STING IHC in tumor nodules (right). N=41 for KP, N=91 for KPO. Error bar: SEM. Unpaired t-test. (C) Western blot for p62 and vinculin on tumors from KP and KPO GEMMs. Relative protein amount was quantified by image densitometry. N= 4 for KP, n=9 for KPO. Error bar: SEM. Unpaired t-test. (D) In vivo tumor growth of KrasG12D/+;Trp53−/;PoleP286R/+ syngeneic cell line KPO105 subcutaneous tumors treated with isotype, Sting agonist (PolySTING), ICB or combination of ICB and Sting agonist. The final weight of dissected tumors at experiment termination was graphed. n=6 for control, n=6 for ICB, n=6 for Sting agonist, n=6 for Sting agonist+ICB. Error bar: SEM. Unpaired t-test. (E) Flow cytometry analysis of KPO syngeneic tumors treated with control or Sting agonist. Quantification of Intracellular staining for IFNγ+ on CD8+ T cells or NK cells. n=5 for control, n=5 for Sting agonist. Error bar: SD. Unpaired t-test. (F) Western blot for pTBK1 and cleaved caspase-3 on KPO105 subcutaneous tumors treated with vehicle or STING agonist. Relative protein amount was quantified by image densitometry. n=3 for control, n=3 for Sting agonist. Error bar: SD. Unpaired t-test. Also see Figures S7 and S8.

References

    1. Siegel RL, Miller KD, Fuchs HE, and Jemal A. (2022). Cancer statistics, 2022. CA Cancer J Clin 72, 7–33. 10.3322/caac.21708. - DOI - PubMed
    1. Chae Y., Arya A., Iams W., Cruz M., Chandra S., Choi J., and Giles F. (2018). Current landscape and future of dual anti-CTLA4 and PD-1/PD-L1 blockade immunotherapy in cancer; lessons learned from clinical trials with melanoma and non-small cell lung cancer (NSCLC). Journal For Immunotherapy of Cancer 6, ARTN 39. 10.1186/s40425-018-0349-3. - DOI - PMC - PubMed
    1. Gandhi L, Rodriguez-Abreu D, Gadgeel S, Esteban E, Felip E, De Angelis F, Domine M, Clingan P, Hochmair MJ, Powell SF, et al. (2018). Pembrolizumab plus Chemotherapy in Metastatic Non-Small-Cell Lung Cancer. N Engl J Med 378, 2078–2092. 10.1056/NEJMoa1801005. - DOI - PubMed
    1. Lee S, Shim HS, Ahn BC, Lim SM, Kim HR, Cho BC, and Hong MH (2021). Efficacy and safety of atezolizumab, in combination with etoposide and carboplatin regimen, in the first-line treatment of extensive-stage small-cell lung cancer: a single-center experience. Cancer Immunol Immunother. 10.1007/s00262-021-03052-w. - DOI - PMC - PubMed
    1. Puri S, and Shafique M. (2020). Combination checkpoint inhibitors for treatment of non-small-cell lung cancer: an update on dual anti-CTLA-4 and anti-PD-1/PD-L1 therapies. Drugs Context 9. 10.7573/dic.2019-9-2. - DOI - PMC - PubMed

Publication types

Substances