. 2023 Oct 17;4(10):101208.
doi: 10.1016/j.xcrm.2023.101208. Epub 2023 Sep 28.

Shared GABA transmission pathology in dopamine agonist- and antagonist-induced dyskinesia

Affiliations

Shared GABA transmission pathology in dopamine agonist- and antagonist-induced dyskinesia

Yoshifumi Abe et al. Cell Rep Med. .

Abstract

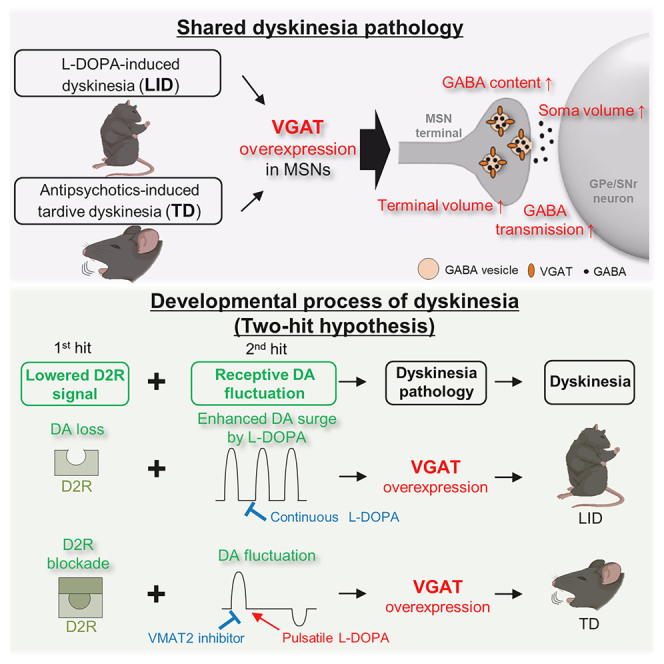
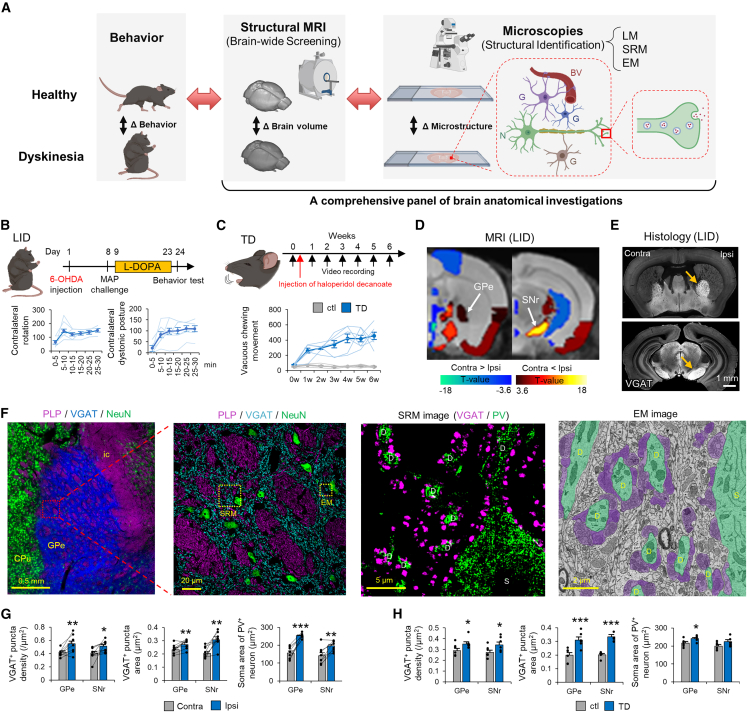
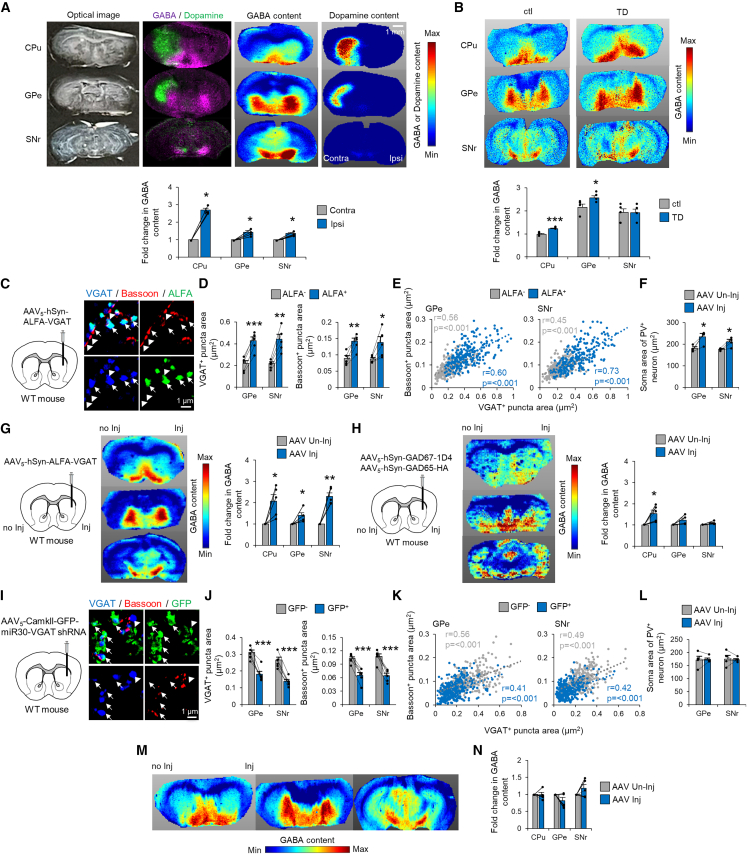
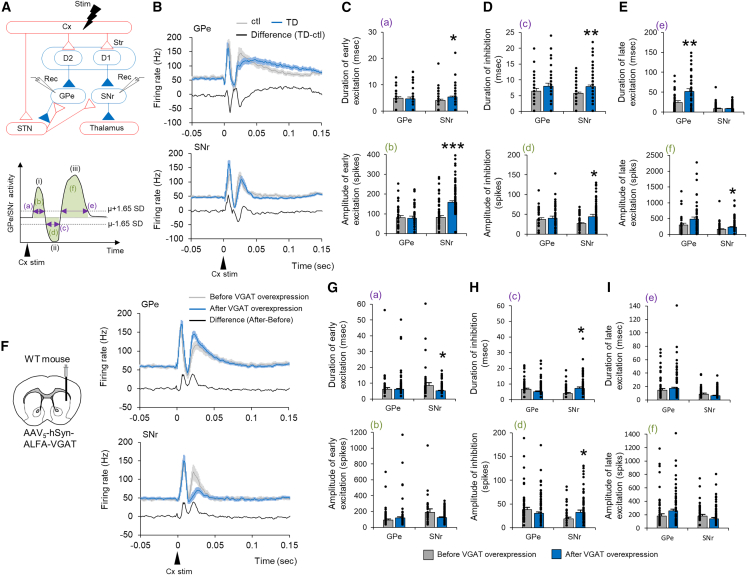
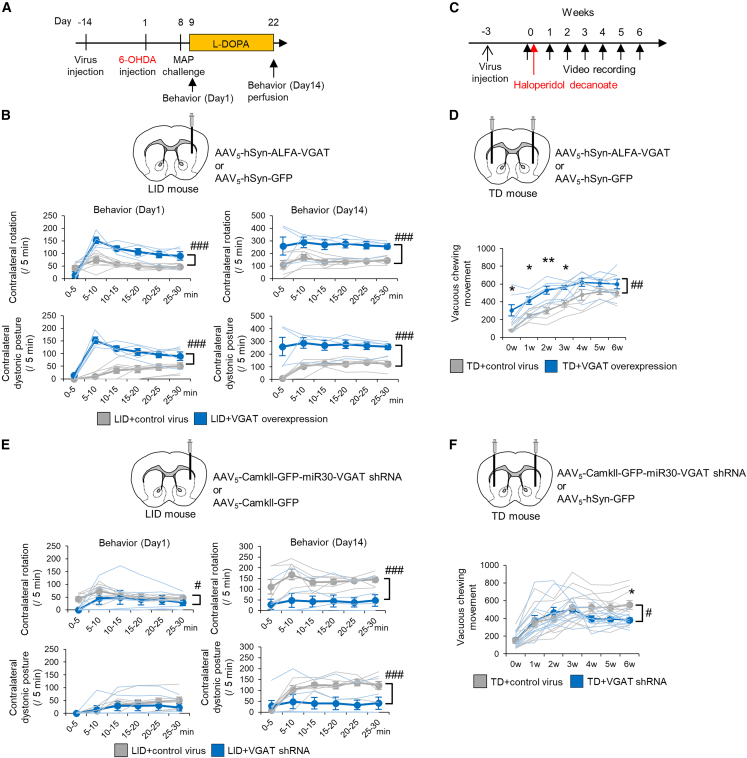
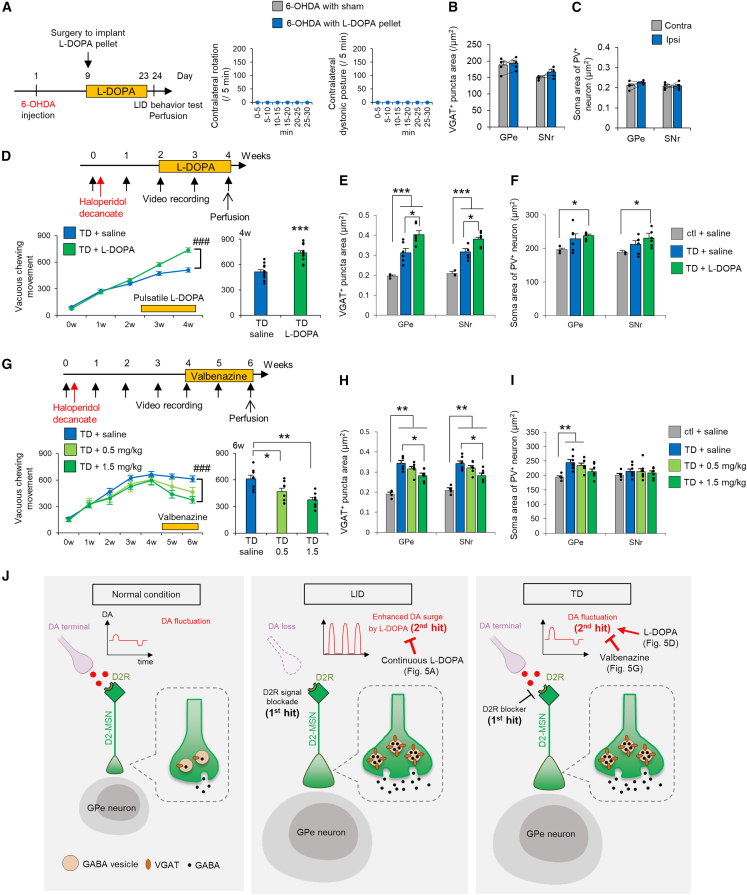
Dyskinesia is involuntary movement caused by long-term medication with dopamine-related agents: the dopamine agonist 3,4-dihydroxy-L-phenylalanine (L-DOPA) to treat Parkinson's disease (L-DOPA-induced dyskinesia [LID]) or dopamine antagonists to treat schizophrenia (tardive dyskinesia [TD]). However, it remains unknown why distinct types of medications for distinct neuropsychiatric disorders induce similar involuntary movements. Here, we search for a shared structural footprint using magnetic resonance imaging-based macroscopic screening and super-resolution microscopy-based microscopic identification. We identify the enlarged axon terminals of striatal medium spiny neurons in LID and TD model mice. Striatal overexpression of the vesicular gamma-aminobutyric acid transporter (VGAT) is necessary and sufficient for modeling these structural changes; VGAT levels gate the functional and behavioral alterations in dyskinesia models. Our findings indicate that lowered type 2 dopamine receptor signaling with repetitive dopamine fluctuations is a common cause of VGAT overexpression and late-onset dyskinesia formation and that reducing dopamine fluctuation rescues dyskinesia pathology via VGAT downregulation.

Keywords: GABA; GPe; L-DOPA-induced dyskinesia; SNr; VGAT; brain volume; dopamine fluctuation; medium spiny neuron; structural plasticity; tardive dyskinesia.


Conflict of interest statement

Declaration of interests The authors declare no competing interests.

Figures

None
Graphical abstract
Figure 1
Figure 1
Enlargement of inhibitory presynaptic structure in the GPe and SNr is a shared pathological change in dyskinesias (A) Schematic of our research strategy. N, neuron; G, glia; BV, blood vessel. (B) Time course of LID model mouse generation. Contralateral rotations and contralateral dystonic postures were counted every 5 min in LID model mice (n = 6). (C) Time course of TD model mouse generation. The number of VCMs per 20 min was plotted every week in TD (n = 6) and control (n = 6) mice. (D) ROI-based brain volume changes were compared between the ipsilateral (Ipsi) and contralateral (Contra) hemispheres of LID model mice (n = 8). Colored brain ROIs, showing significant changes in brain volume, were plotted (false discovery rate [FDR]-corrected p < 0.05). (E) VGAT immunostaining in the GPe and SNr of LID mice. The arrows show increases in Ipsi brain volumes. (F) Low- and high-magnification images of myelin proteolipid protein (PLP)/VGAT/NeuN in the GPe of control mice (ic, internal capsule), SRM images of VGAT/PV staining, and an EM image of the GPe of control mice. Green indicates the somata (Ss) and dendrites (Ds) of GPe principal Ns; purple indicates MSN terminals. (G and H) VGAT+ density and area and S areas of PV+ Ns were compared between the Contra and Ipsi hemispheres of LID mice (n = 8) (G) and between TD (n = 5) and control (n = 5) mice (H). ∗p < 0.05, ∗∗p < 0.01, ∗∗∗p < 0.001 (Student’s or paired t test, p values corrected by Bonferroni correction). Values are plotted as the mean ± standard error of the mean (SEM).
Figure 2
Figure 2
Striatal VGAT expression levels determine axon terminal size and GABA content (A) IMS showing the optical image, GABA, dopamine, and their overlay in LID mice. Fold changes in GABA content relative to the Contra hemisphere are plotted (n = 5). (B) MSI of GABA content in TD mice. Fold changes in GABA content (based on the average GABA content of each region in control mice) were plotted in control (n = 4) and TD (n = 4) mice. (C) SRM images of VGAT/Bassoon/ALFA in the GPe of VGAT overexpression mice. (D) Areas of VGAT+ and Bassoon+ puncta in MSN terminals were compared between ALFA+ and ALFA puncta in the GPe and SNr (n = 5). (E) Areas of VGAT+/Bassoon+ puncta were plotted in VGAT overexpression mice. (F) S areas of PV+ Ns in the GPe and SNr were compared between the AAV injection (AAV Inj) and non-injection (AAV Un-inj) hemispheres (n = 5). (G and H) IMS of GABA content in VGAT (G) and GAD67/GAD65 (H) overexpression mice. Fold changes in GABA content (relative to AAV Un-inj) were plotted for AAV Inj in VGAT (n = 5) and GAD67/GAD65 (n = 5) overexpression mice. (I) SRM images of VGAT/Bassoon/GFP in the GPe of VGAT inhibition mice. (J) Areas of VGAT+ and Bassoon+ puncta in MSN terminals were compared between GFP+ and GFP puncta in the GPe and SNr (n = 5). (K) Areas of VGAT+/Bassoon+ puncta were plotted in VGAT inhibition mice. (L) S areas of PV+ Ns in the GPe and SNr were compared between the AAV Inj and AAV Un-inj hemispheres (n = 5). (M and N) IMS of GABA content in VGAT inhibition mice. Fold changes in GABA content (relative to AAV Un-inj) were plotted in VGAT inhibition mice (n = 5). ∗p < 0.05, ∗∗p < 0.01, ∗∗∗p < 0.001 (Student’s or paired t test, p values corrected by Bonferroni’s method). Each value and the mean ± SEM are plotted.
Figure 3
Figure 3
Striatal VGAT overexpression enhances GABA transmission from MSNs (A) Stimulation (Cx) and recording (GPe or SNr) sites are depicted with basal ganglion circuitry. Red and blue lines represent glutamatergic excitatory and GABAergic inhibitory projections, respectively. In the striatum (Str), D1 and D2 represent D1-MSN and D2-MSN, respectively. Cx-evoked responses in the GPe or SNr are typically composed of early excitation (i), inhibition (ii), and late excitation (iii). Purple lines represent the duration of the three responses (a, c, and e), and green areas represent the amplitudes of the three responses (b, d, and f). (B) Averaged PSTHs of Cx-evoked responses in the GPe (control, n = 30 Ns, gray; TD, n = 38 Ns, blue; from four mice) and SNr (control, n = 52 Ns; TD, n = 89 Ns; from four mice). Algebraic differences between TD and controls are also indicated (black). (C–E) Duration and amplitude of early excitation, inhibition, and late excitation responses were compared between control and TD mice. (F) Single-unit recording was performed before and after VGAT overexpression. Averaged PSTHs of Cx-evoked responses in the GPe (before n = 52 Ns, after n = 123 Ns, from four mice) or SNr (before n = 37 Ns, after n = 61 Ns, from four mice) before and after striatal VGAT overexpression in WT mice. Differences in averaged PSTHs before and after overexpression were calculated, as were algebraic differences before and after overexpression. (G–I) Duration and amplitude of early excitation, inhibition, and late excitation responses were compared before and after VGAT overexpression. ∗p < 0.05, ∗∗p < 0.01 (Student’s t test, p values corrected by Bonferroni’s correction). Values of each mouse and the mean ± SEM are plotted.
Figure 4
Figure 4
Striatal VGAT expression levels gate the severity of dyskinesia (A) AAV vectors were injected into the right dorsal Str (Ipsi to the 6-OHDA injection) of LID mice 2 weeks before 6-OHDA injection; L-DOPA was then injected for 2 weeks. Mouse behavior was observed on the first and final days of L-DOPA injection. (B) Numbers of Contra rotations and Contra dystonic postures were compared between LID with VGAT overexpression (n = 4) and LID with control AAV (n = 7) mice. (C) AAV vectors were injected into the bilateral dorsal Str of TD mice 3 weeks before haloperidol decanoate injection. (D) The number of VCMs was compared between TD with control AAV (n = 6) and TD with VGAT overexpression (n = 6) mice. (E) Numbers of Contra rotations and Contra dystonic postures were compared between LID with VGAT shRNA (n = 6) and LID with control AAV (n = 7) mice. (F) Numbers of VCMs were compared between TD with VGAT shRNA (n = 10) and TD with control AAV (n = 11) mice. #p < 0.05, ##p < 0.01, ###p < 0.001 (two-way repeated analysis of variance [ANOVA]). ∗p < 0.05, ∗∗p < 0.01 (Student’s t test, p values corrected by Bonferroni’s correction). Values of each mouse and the mean ± SEM are plotted.
Figure 5
Figure 5
Lowered dopamine receptor type 2 signaling with repetitive dopamine fluctuations induces VGAT overexpression and dyskinesia (A) Experimental time course of continuous L-DOPA administration. The numbers of Contra rotations and Contra dystonic postures were counted in L-DOPA-treated (n = 4) and sham (n = 3) mice. (B and C) The areas of VGAT+ puncta of MSN terminals and S area of PV+ Ns were compared between the Ipsi and Contra hemispheres of mice with continuous L-DOPA (n = 4). (D) Experimental time course for pulsatile administration of L-DOPA (daily, intraperitoneal) in TD mice. Numbers of VCMs were plotted every week and for the 4-week period in TD mice with saline (n = 12) and L-DOPA (n = 12) treatment. (E and F) The areas of VGAT+ puncta of MSN terminals and S area of PV+ Ns were compared among control mice with saline (n = 3), TD mice with saline (n = 6), and TD mice with L-DOPA (n = 6). (G) Experimental time course of daily valbenazine administration (0.5 or 1.5 mg/kg, oral administration) in TD mice. Numbers of VCMs were plotted every week and for the 6-week period in TD mice with saline (n = 8) and valbenazine (n = 8 for each dose) treatment. (H and I) The areas of VGAT+ puncta of MSN terminals and S area of PV+ Ns were compared among control mice (n = 4), TD mice with saline (n = 7), and TD mice with valbenazine (n = 7 for each dose). (J) Schematic of the proposed dyskinesia pathology. In LID, ablation of dopaminergic Ns (first hit) and evoked dopamine (DA) surges by L-DOPA administration (second hit) increases striatal VGAT expression, resulting in volume increases in MSN terminals and Ss of GPe/SNr Ns and increased GABA content and transmission. In TD, blocking of D2 receptors (D2R; first hit) and physiological dopamine fluctuations (second hit) induce pathophysiology similar to LID. The increased and decreased amplitudes of dopamine fluctuations induced by L-DOPA and valbenazine, respectively, led to exacerbated (with L-DOPA) and ameliorated (with valbenazine) dyskinesia pathology. ∗p < 0.05, ∗∗p < 0.01, ∗∗∗p < 0.001 (Student’s t test, p values corrected by Bonferroni correction). Values are plotted as the mean ± SEM.

References

    1. Lüscher C., Malenka R.C. Drug-evoked synaptic plasticity in addiction: from molecular changes to circuit remodeling. Neuron. 2011;69:650–663. doi: 10.1016/j.neuron.2011.01.017. - DOI - PMC - PubMed
    1. Lobo M.K., Covington H.E., 3rd, Chaudhury D., Friedman A.K., Sun H., Damez-Werno D., Dietz D.M., Zaman S., Koo J.W., Kennedy P.J., et al. Cell type-specific loss of BDNF signaling mimics optogenetic control of cocaine reward. Science. 2010;330:385–390. - PMC - PubMed
    1. Creed M., Pascoli V.J., Lüscher C. Addiction therapy. Refining deep brain stimulation to emulate optogenetic treatment of synaptic pathology. Science. 2015;347:659–664. doi: 10.1126/science.1260776. - DOI - PubMed
    1. Storey V.J., Middlemiss D.N., Reavill C. Effect of haloperidol and (-)-sulpiride on dopamine agonist-induced hypoactivity. Neuropharmacology. 1995;34:449–455. - PubMed
    1. Wiley J.L. Antipsychotic-induced suppression of locomotion in juvenile, adolescent and adult rats. Eur. J. Pharmacol. 2008;578:216–221. doi: 10.1016/j.ejphar.2007.09.010. - DOI - PMC - PubMed

Publication types

MeSH terms