. 2023 Oct 17;4(10):101212.
doi: 10.1016/j.xcrm.2023.101212. Epub 2023 Sep 28.

Preclinical development of a chimeric antigen receptor T cell therapy targeting FGFR4 in rhabdomyosarcoma

Affiliations

Preclinical development of a chimeric antigen receptor T cell therapy targeting FGFR4 in rhabdomyosarcoma

Meijie Tian et al. Cell Rep Med. .

Erratum in

  • Preclinical development of a chimeric antigen receptor T cell therapy targeting FGFR4 in rhabdomyosarcoma.
    Tian M, Wei JS, Shivaprasad N, Highfill SL, Gryder BE, Milewski D, Brown GT, Moses L, Song H, Wu JT, Azorsa P, Kumar J, Schneider D, Chou HC, Song YK, Rahmy A, Masih KE, Kim YY, Belyea B, Linardic CM, Dropulic B, Sullivan PM, Sorensen PH, Dimitrov DS, Maris JM, Mackall CL, Orentas RJ, Cheuk AT, Khan J. Tian M, et al. Cell Rep Med. 2024 May 21;5(5):101586. doi: 10.1016/j.xcrm.2024.101586. Epub 2024 May 9. Cell Rep Med. 2024. PMID: 38723625 Free PMC article. No abstract available.

Abstract

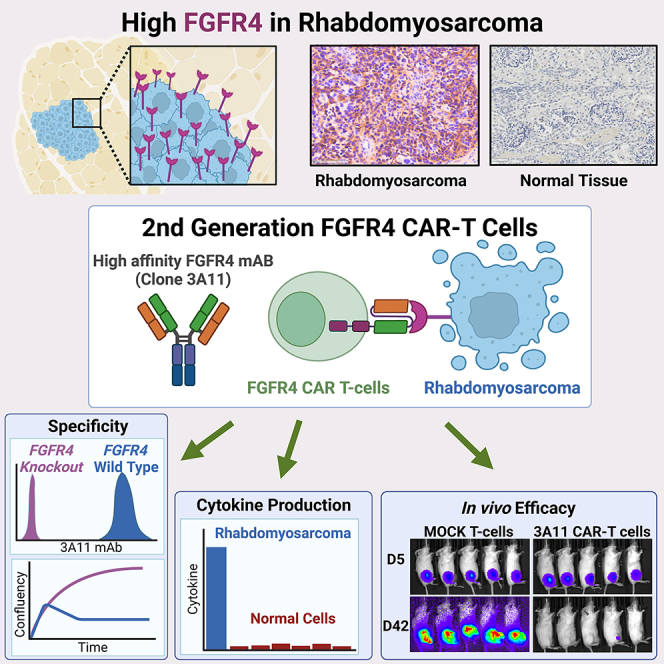
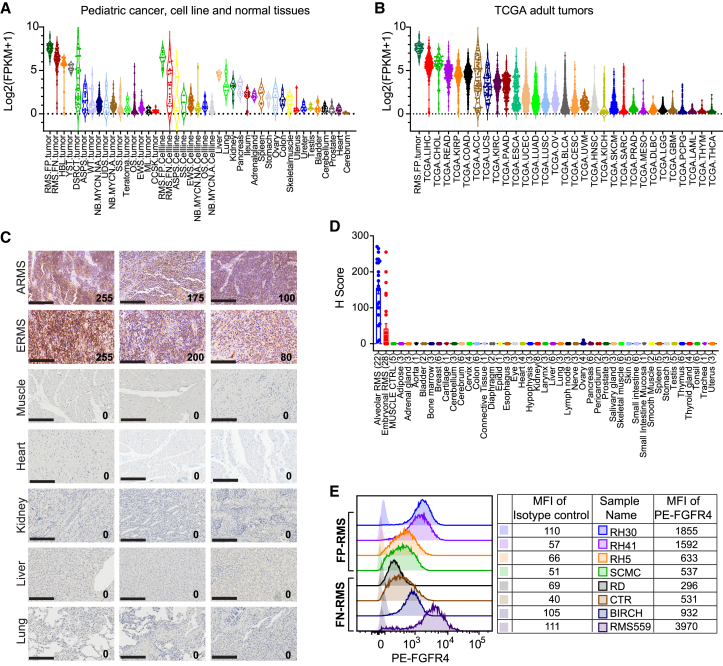
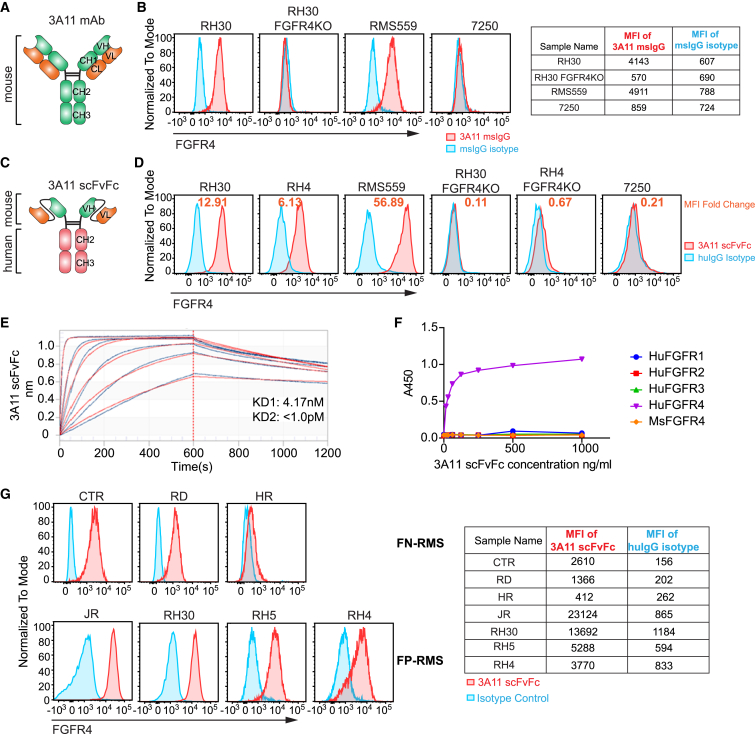
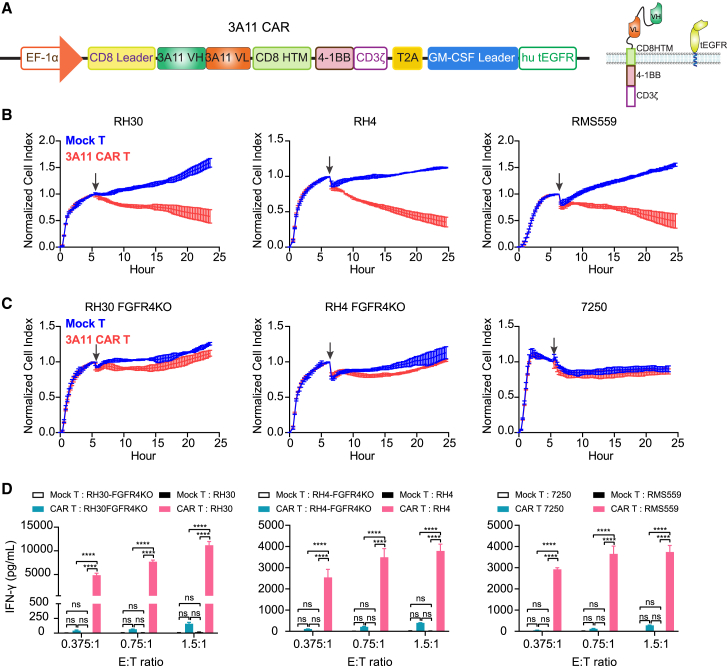
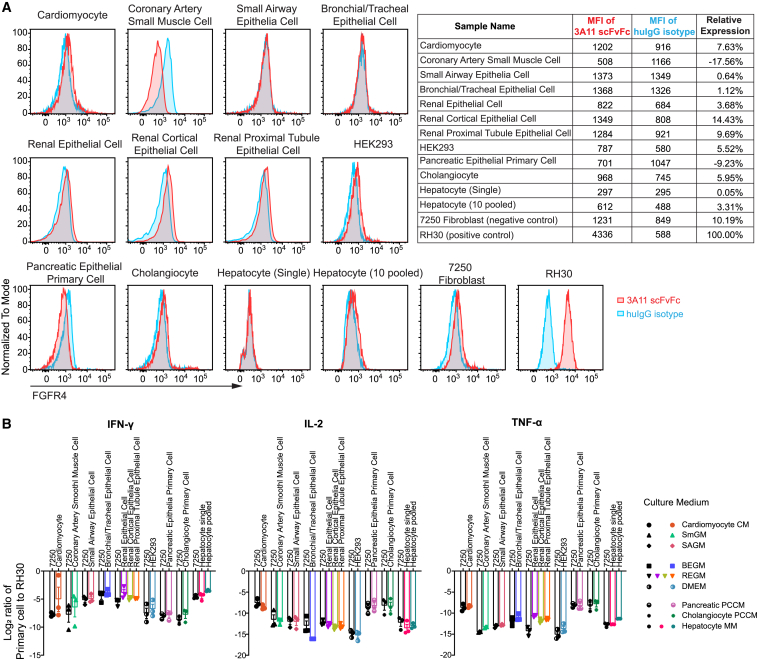
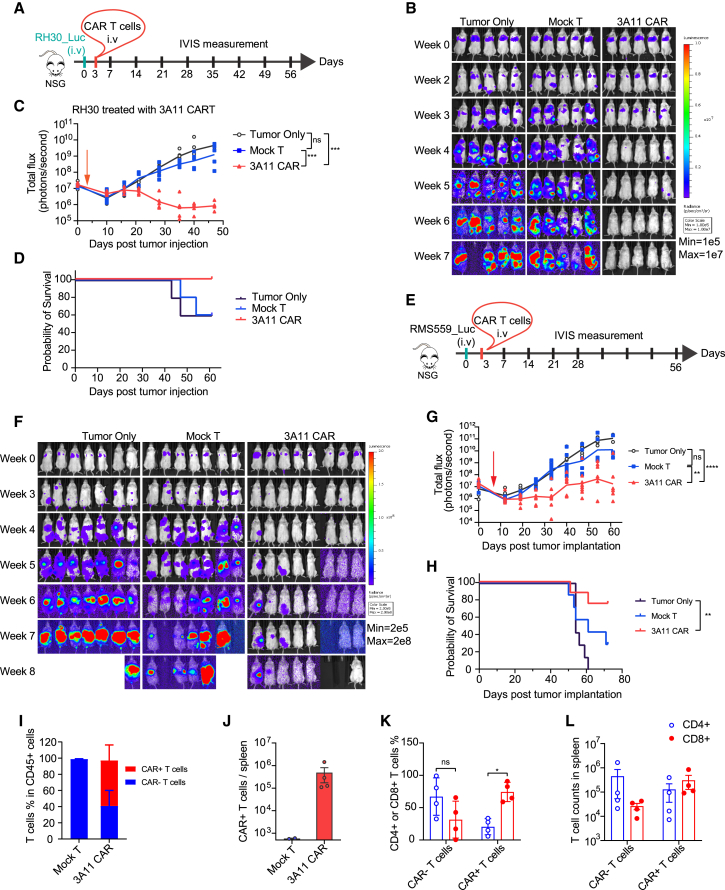
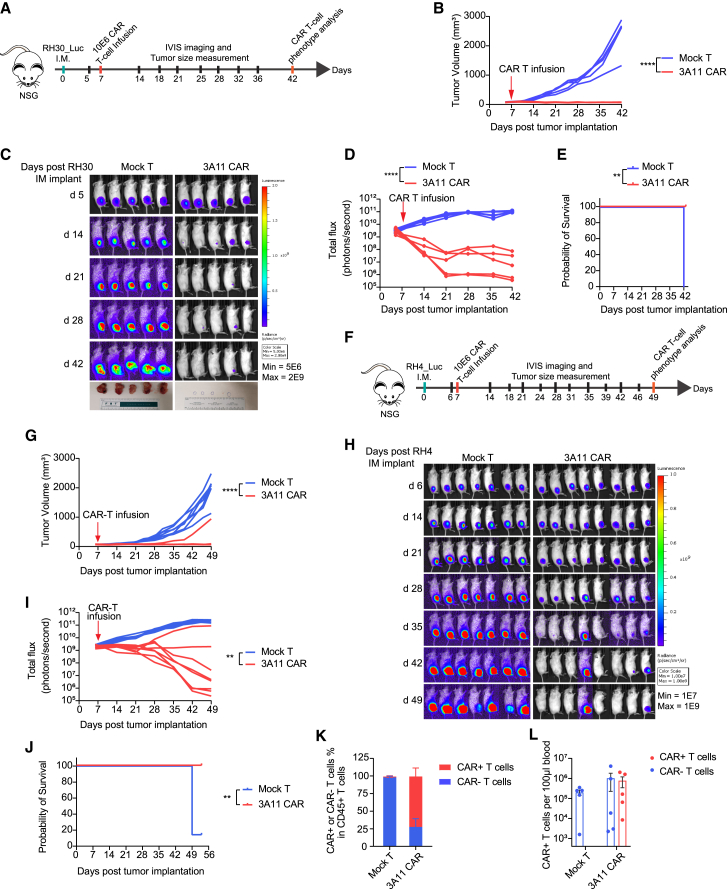
Pediatric patients with relapsed or refractory rhabdomyosarcoma (RMS) have dismal cure rates, and effective therapy is urgently needed. The oncogenic receptor tyrosine kinase fibroblast growth factor receptor 4 (FGFR4) is highly expressed in RMS and lowly expressed in healthy tissues. Here, we describe a second-generation FGFR4-targeting chimeric antigen receptor (CAR), based on an anti-human FGFR4-specific murine monoclonal antibody 3A11, as an adoptive T cell treatment for RMS. The 3A11 CAR T cells induced robust cytokine production and cytotoxicity against RMS cell lines in vitro. In contrast, a panel of healthy human primary cells failed to activate 3A11 CAR T cells, confirming the selectivity of 3A11 CAR T cells against tumors with high FGFR4 expression. Finally, we demonstrate that 3A11 CAR T cells are persistent in vivo and can effectively eliminate RMS tumors in two metastatic and two orthotopic models. Therefore, our study credentials CAR T cell therapy targeting FGFR4 to treat patients with RMS.

Keywords: CAR T cell therapy; FGFR4; rhabdomyosarcoma; specific cytotoxicity.


Conflict of interest statement

Declaration of interests J. Khan, R.J.O., D.S.D., and A.T.C. are inventors on international patent application no. PCT/US2016/052496. The 3A11 CAR sequence is in this patent application (see https://patents.justia.com/patent/11078286) filed on September 19, 2016, titled “Monoclonal antibodies specific for fibroblast growth factor receptor 4 (FGFR4) and methods of their use.”

Figures

None
Graphical abstract
Figure 1
Figure 1
FGFR4 is highly expressed in RMS and other cancers, with low expression in healthy tissue (A) High expression of FGFR4 mRNA is found in both FP-RMS and FN-RMS tumors and cell lines compared with other pediatric cancers and healthy tissues. Expression levels measured as FPKM (fragments per kilobase of transcript per million mapped reads) for FGFR4 are summarized in violin plots with medians and quartiles. ASPS, alveolar soft part sarcoma; CCSK, clear cell sarcoma of the kidney; DSRCT, desmoplastic small round cell tumor; EWS, Ewing sarcoma; HBL, hepatoblastoma; ML, melanoma; NB, neuroblastoma; OS, osteosarcoma; SS, synovial sarcoma; UDS, undifferentiated sarcoma; WT, Wilms tumor; YST, yolk sac tumor). (B) FGFR4 mRNA expression in TCGA data shows highest expression in liver hepatocellular carcinoma (LIHC), cholangiocarcinoma (CHOL), and individual tumors of other types. Abbreviations are as per TCGA (https://gdc.cancer.gov/resources-tcga-users/tcga-code-tables/tcga-study-abbreviations). (C) Representative images of immunohistochemistry (IHC) for FGFR4 show high expression in RMS, with minimum or no expression in healthy organs. H score displayed in bottom right corner, and scale bars, 200 μm. (D) Summary of membrane-staining H score of FGFR4 IHC of RMS and healthy tissues. Values represent mean ± SEM (error bars). (E) Representative flow cytometry plots show differential levels of FGFR4 expression on FP-RMS or FN-RMS cell lines. Mean fluorescence intensity (MFI) of FGFR4 on indicated RMS cells is listed in the right table, stained with phycoerythrin (PE)-conjugated anti-human FGFR4 antibody or mouse IgG1 isotype control.
Figure 2
Figure 2
PAX3-FOXO1 establishes a super-enhancer at the FGFR4 locus, and RMSs are dependent on FGFR4 for survival (A) PAX3-FOXO1 (top) and H3K27ac (bottom) ChIP-seq at the FGFR4 locus in FP-RMS cell lines and tumors (orange), FN-RMS cell lines and tumors (blue), and human skeletal muscle cell lines and tissues (gold). (B) Top: FGFR4 expression is induced in fibroblasts after introduction of PAX3-FOXO1. Bottom: ChIP-seq demonstrates that PAX3-FOXO1 protein opens chromatin and establishes a super-enhancer at the FGFR4 locus. Open chromatin was assayed by DNase hypersensitivity; binding of PAX3-FOXO1 and BRD4 as well as chromatin H3K27ac status were assayed by ChIP-seq in human fibroblasts with or without PAX3-FOXO1. (C) Average dependency score of RMS for FGFR4 was found to be the lowest among all human cancers, suggesting the highest dependency of RMS on this receptor for survival.
Figure 3
Figure 3
Development and characterization of a specific FGFR4 binder from the monoclonal murine antibody 3A11 (A) Structure of the mouse anti-FGFR4 mouse monoclonal antibody (mAb) 3A11. (B) Representative flow cytometry plots show the specificity of 3A11 mAb by staining with FGFR4+ cell lines, FGFR4 KO RH30, or FGFR4 cell 7250. Mouse IgG (msIgG) is used as isotype control for this mouse antibody 3A11. (C) Structure of anti-FGFR4 antibody 3A11 in scFvFc format fused to the human IgG1 Fc region. (D) Representative flow cytometry plots show 3A11 scFvFc chimeric antibody specifically binds to FGFR4+ cell lines RH30, RH4, and RMS559 but not to the RH30 FGFR4-KO, the RH4 FGFR4-KO, or fibroblast 7250 lines. Human IgG (huIgG) as an isotype control for 3A11 scFvFc. MFI fold change shown as orange font calculated by formula [MFI(scFvFc)MFI(huIgGisotype)]/MFI(huIgGisotype). (E) Binding avidity of FGFR4 scFvFc, using 2-to-1 binding model and global fitting analysis, demonstrates the dissociation constant (KD) of 3A11 scFvFc against FGFR4 ECD is 4.17 nM. (F) ELISA shows 3A11 scFvFc only recognizes human FGFR4 but not human FGFR1–3 or mouse FGFR4. (G) Flow cytometry using 3A11 scFvFc shows FGFR4 is expressed in several RMS cell lines at various levels with higher expression in FP-RMS compared with in FN-RMS. MFI of 3A11 scFvFc or isotype control huIgG staining on above cells is shown in the table on the right.
Figure 4
Figure 4
Clinical-grade 3A11 CAR T cells show specific cytotoxicity to FGFR4+ cells (A) Schematic of 3A11 CAR construct targeting FGFR4. HTM, hinge and transmembrane domain; hu tEGFR, human truncated EGFR. (B) Cytotoxicity assays of 3A11 CAR T cells show potent killing activity toward target RMS cells at an E:T ratio of 0.75:1 in a xCELLigence Real-Time Cell Analysis (RTCA). Vertical black arrows show the time point for adding CAR T cells into a plate seeded with target cells. Representative of n = 3 independent experiments with n = 3 individual donors for (B)–(D). Values represent mean ± SD (standard deviation, error bars). (C) Cytotoxic assay shows 3A11 CAR does not cause cytolysis to FGFR4-KO or FGFR4 cells at an E:T ratio of 0.75:1. Values represent mean ± SD (error bars). (D) Cytokine release assay shows 3A11 CAR T cells only release high level of IFN-γ when cocultured with FGFR4-expressing RMS cells (RH30, RH4, or RMS559) rather than the respective FGFR4-KO cell lines or 7250. Values represent mean ± SEM (error bars). Two-way ANOVA is used to compare secreted IFN-γ by mock T or 3A11 CAR T cells cocultured with the target cells by calculating the p value. ∗p ≤ 0.05; ∗∗p ≤ 0.01; ∗∗∗p ≤ 0.001; ∗∗∗∗p ≤ 0.0001; ns: no significant difference.
Figure 5
Figure 5
Low or absence of cell surface FGFR4 in primary human cells does not induce cytokine release when cocultured with 3A11 CAR T cells (A) Representative flow cytometry plots show low or absence of FGFR4 cell surface expression on human cardiomyocytes, renal epithelial cells, renal cortical epithelial cells, renal proximal epithelial cells, HEK293, cholangiocytes, and hepatocytes pooled from 10 individuals using 3A11 scFvFc. MFI of 3A11 scFvFc or huIgG1 isotype control staining on these primary cells is shown in the top right table. Relative FGFR4 expression levels on these primary cells compared with RH30 cells are calculated as Relativeexpression=[MFI(scFvFc)MFI(huIgGisotype)]Primarycell[MFI(scFvFc)MFI(huIgGisotype)]RH30. (B) Log2 ratio of cytokine (IFN-γ, IL-2, and TNF-α) release in the supernatant, by 3A11 CAR T cells cocultured with primary cells, as indicated, in their respective media, compared with the RMS cell RH30. Cell line 7250 serves as a FGFR4 control. Values represent n = 3 independent experiments with n = 3 individual donors. Values represent mean ± SEM (error bars).
Figure 6
Figure 6
3A11 CAR T cell shows potent antitumor effect in RH30 and RMS559 metastatic xenograft models (A) Schematic of an in vivo model testing the activity of 3A11 CAR T cells against an RH30 metastatic xenograft model. (B) Bioluminescent imaging of untreated RH30 xenografts or RH30 xenografts treated with 3E6 mock transduced T cells or 3A11 CAR T cells (n = 5 per group). (C) Total bioluminescence flux over time of individual mouse treated with HBSS, mock T cells, and 3A11 CAR T cells. Mean (lines) and individual replicates are shown (n = 5 per group). Vertical red arrow indicates the day of T cell infusion, also in (G). Mixed-effects or two-way repeated measures (RM) ANOVA analysis was used to calculate the p value between two groups, respectively. ∗∗∗p ≤ 0.001. (D) Kaplan-Meier survival analysis of mice are shown in (D) (n = 5 per group). Study was ended at day 64 due to the onset of graft-versus-host toxicity (dry skin, weight loss, hunched posture, and fur loss). (E) Schema of luciferase-expressing RMS559 metastatic model infused with HBSS or 3E6 of mock or CAR T cells on day 3 after tumor inoculation. (F and G) Bioluminescence images (F) and bioluminescence kinetics (G) of RMS559 cell growth in the metastatic xenograft model. Means and each replicate are shown, n = 7 or 8. Mixed-effects analysis is used to calculate the p values between each two groups individually. ∗∗p = 0.0047; ∗∗∗∗p < 0.0001. (H) Kaplan-Meier survival analysis of mice bearing RMS559 (7 or 8 mice/group). Log-rank (Mantel-Cox) test is used to compare the survival curves. ∗∗p = 0.0028. (I and J) The frequencies of CAR+ or CAR T cells (I) and total cell counts of CAR+ T cells (J) in the splenocytes from above mice at 70 days post-mock or CAR T cell infusion are examined by flow cytometry (n = 2 for mock T group, n = 4 for 3A11 CAR T cell-treated group; in mean ± SEM [error bars]). (K and L) The percentages (K, values represent mean ± SD [error bars]) and total cell counts (L, values represent mean ± SEM [error bars]) of CD4+ and CD8+ cells in CAR (tEGFR) or CAR+ (tEGFR+) T cells from spleen of 3A11 CAR T cells treated mice are shown. Two-way ANOVA is used to calculate the p values. ∗p < 0.05.
Figure 7
Figure 7
3A11 CAR T cells effectively eradicated RMS orthotopic intramuscular xenografts in two models (A) Schema of the RH30 intramuscular xenograft model infused with mock or 10E6 CAR T cells on day 7 post-tumor inoculation. (B) Tumor size was monitored over 42 days by measurement of leg volume before and after receiving mock or CAR T cell treatment. Vertical red arrow indicates the day of T cell infusion, also in (D), (G), and (I). Each replicate per group is shown, n = 5. Two-way RM ANOVA analysis is used to calculate the p values between two groups. ∗∗∗∗p < 0.0001. (C) Bioluminescent images of RH30 intramuscular xenografts growth before and after infusion with mock T cells or 3A11 CAR T cells. The bottom row shows the tumor xenografts dissected from mice legs at the end time point of study. (D) Total bioluminescence flux (photons per second) over time of individual mouse are shown (n = 5 per group). Two-way RM ANOVA analysis was used to calculate p value between two groups, respectively. ∗∗∗∗p < 0.0001. (E) Kaplan-Meier survival analysis of mice bearing orthotopic RH30 tumors. ∗∗p = 0.0027. (F) Schema of the RH4 intramuscular xenograft model infused with 10E6 mock or CAR T cells on day 7 post-tumor inoculation. (G) Tumor size was monitored by leg volume. Each replicate per group is shown, n = 7 or 8. Two-way RM ANOVA analysis is used to calculate the p values between two groups. ∗∗∗∗p < 0.0001. (H and I) Bioluminescent images of RH4 intramuscular xenografts for individual mice (H) and total bioluminescence flux (I) over time (n = 7 or 8 per group). Mixed-effects analysis was used to calculate p value between two groups, respectively. ∗∗p = 0.0021. (J) Kaplan-Meier survival analysis of mice bearing orthotopic RH4 tumors. ∗∗p = 0.0011. (K and L) Percentage of CAR+ and CAR in CD45+ CD3+ T cells from peripheral blood mononuclear cells (PBMCs) (K) and total counts of the indicated T cells in 100 μL blood from RH30 orthotopic model (L). Data are shown as each replicate and the mean ± SEM (error bars; n = 5).

References

    1. Skapek S.X., Ferrari A., Gupta A.A., Lupo P.J., Butler E., Shipley J., Barr F.G., Hawkins D.S. Rhabdomyosarcoma. Nat. Rev. Dis. Prim. 2019;5:1. - PMC - PubMed
    1. Shern J.F., Chen L., Chmielecki J., Wei J.S., Patidar R., Rosenberg M., Ambrogio L., Auclair D., Wang J., Song Y.K., et al. Comprehensive genomic analysis of rhabdomyosarcoma reveals a landscape of alterations affecting a common genetic axis in fusion-positive and fusion-negative tumors. Cancer Discov. 2014;4:216–231. - PMC - PubMed
    1. Shern J.F., Yohe M.E., Khan J. Pediatric Rhabdomyosarcoma. Crit. Rev. Oncog. 2015;20:227–243. - PMC - PubMed
    1. Khan J., Bittner M.L., Saal L.H., Teichmann U., Azorsa D.O., Gooden G.C., Pavan W.J., Trent J.M., Meltzer P.S. cDNA microarrays detect activation of a myogenic transcription program by the PAX3-FKHR fusion oncogene. Proc. Natl. Acad. Sci. USA. 1999;96:13264–13269. - PMC - PubMed
    1. Gryder B.E., Wachtel M., Chang K., El Demerdash O., Aboreden N.G., Mohammed W., Ewert W., Pomella S., Rota R., Wei J.S., et al. Miswired Enhancer Logic Drives a Cancer of the Muscle Lineage. iScience. 2020;23 - PMC - PubMed

Publication types

Substances