. 2023 Nov;299(11):105295.
doi: 10.1016/j.jbc.2023.105295. Epub 2023 Sep 28.

Comparative proximity biotinylation implicates the small GTPase RAB18 in sterol mobilization and biosynthesis

Affiliations

Comparative proximity biotinylation implicates the small GTPase RAB18 in sterol mobilization and biosynthesis

Robert S Kiss et al. J Biol Chem. 2023 Nov.

Abstract

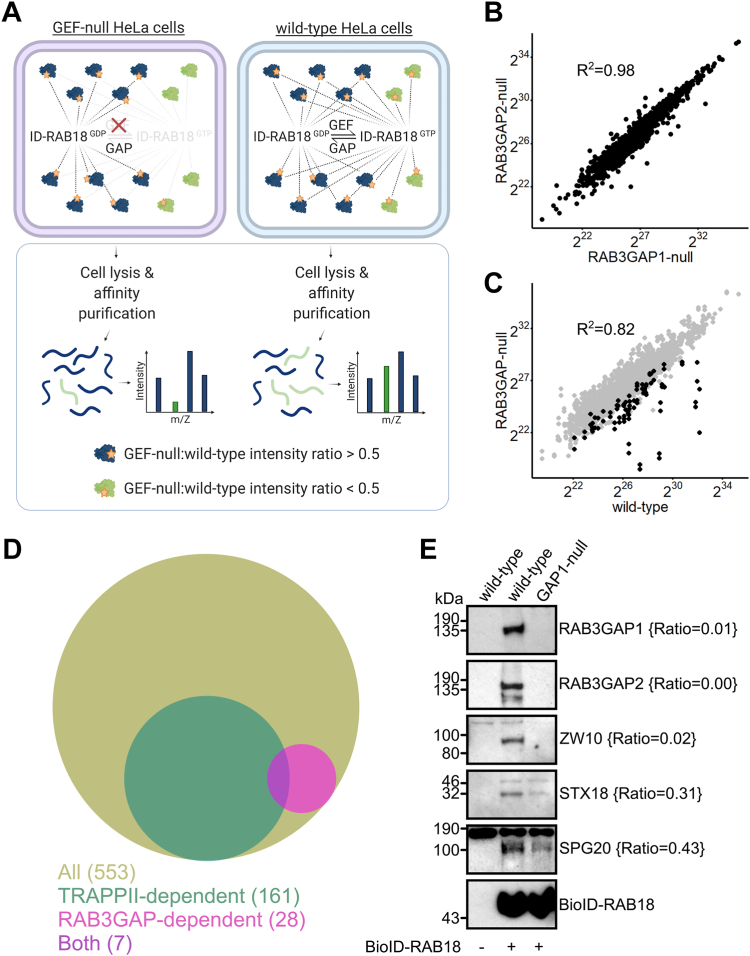
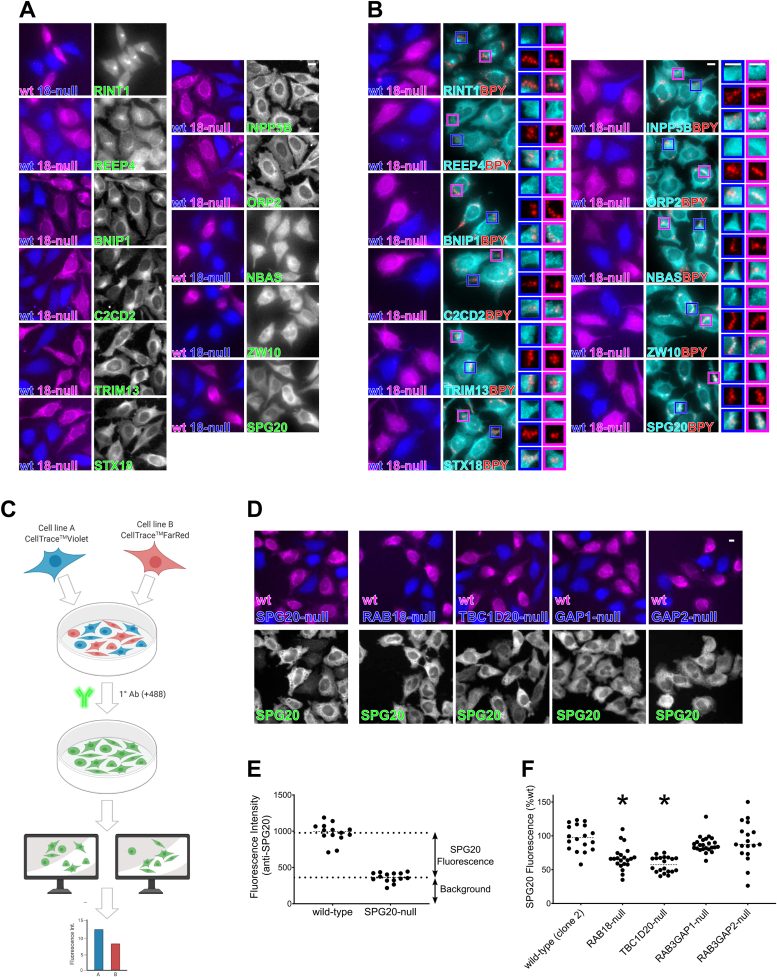
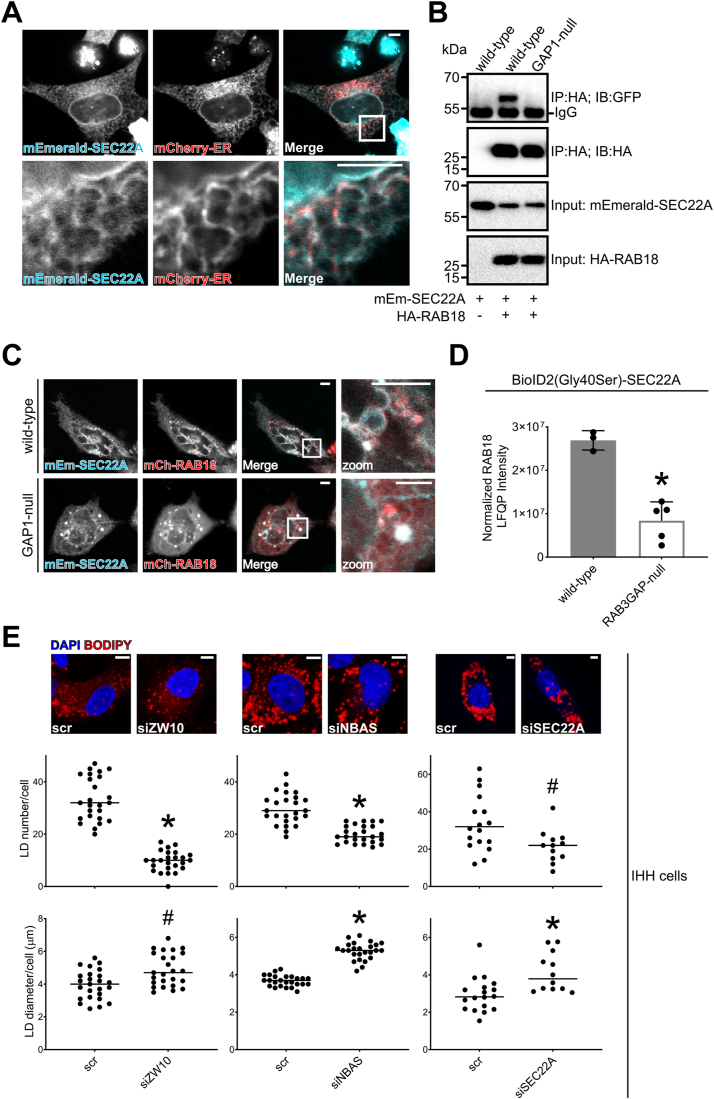
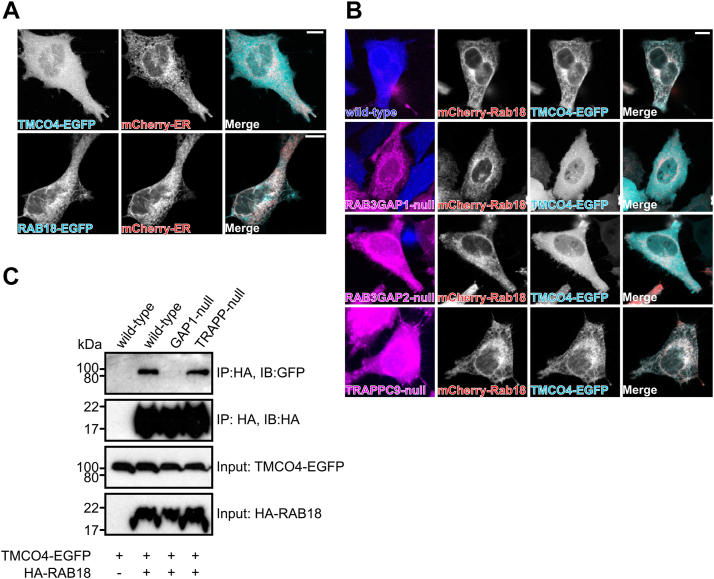
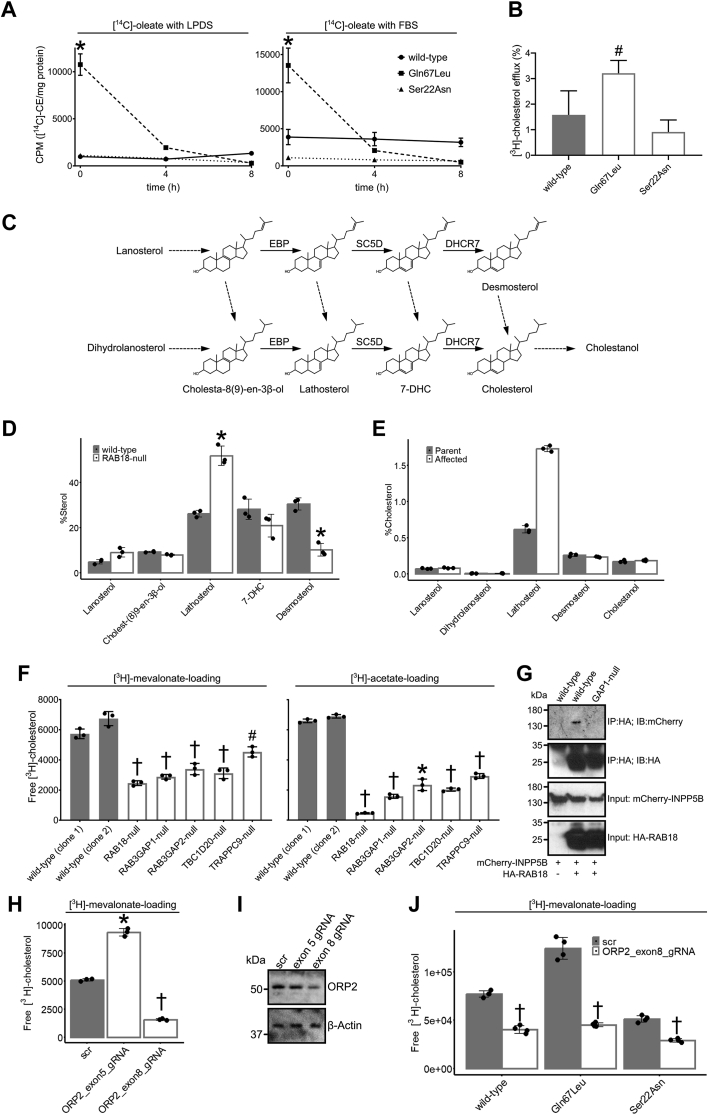
Loss of functional RAB18 causes the autosomal recessive condition Warburg Micro syndrome. To better understand this disease, we used proximity biotinylation to generate an inventory of potential RAB18 effectors. A restricted set of 28 RAB18 interactions were dependent on the binary RAB3GAP1-RAB3GAP2 RAB18-guanine nucleotide exchange factor complex. Twelve of these 28 interactions are supported by prior reports, and we have directly validated novel interactions with SEC22A, TMCO4, and INPP5B. Consistent with a role for RAB18 in regulating membrane contact sites, interactors included groups of microtubule/membrane-remodeling proteins, membrane-tethering and docking proteins, and lipid-modifying/transporting proteins. Two of the putative interactors, EBP and OSBPL2/ORP2, have sterol substrates. EBP is a Δ8-Δ7 sterol isomerase, and ORP2 is a lipid transport protein. This prompted us to investigate a role for RAB18 in cholesterol biosynthesis. We found that the cholesterol precursor and EBP-product lathosterol accumulates in both RAB18-null HeLa cells and RAB3GAP1-null fibroblasts derived from an affected individual. Furthermore, de novo cholesterol biosynthesis is impaired in cells in which RAB18 is absent or dysregulated or in which ORP2 expression is disrupted. Our data demonstrate that guanine nucleotide exchange factor-dependent Rab interactions are highly amenable to interrogation by proximity biotinylation and may suggest that Micro syndrome is a cholesterol biosynthesis disorder.

Keywords: BioID; EBP; ORP2; RAB18; Rab; SNARE proteins; cholesterol metabolism; lathosterol; lipid transport; protein–protein interaction.


Conflict of interest statement

Conflict of interest The authors declare that they have no conflicts of interest with the contents of this article.

Figures

Figure 1
Figure 1
RAB3GAP-dependent RAB18 interactions in HeLa cells.A, schematic to show experimental approach. Proximity biotinylation of guanine nucleotide exchange factor (GEF)-dependent interactors by BirA∗-RAB18 (ID-RAB18) is disrupted in GEF-null cells. GEF-independent interactors are biotinylated in both GEF-null and WT cells. Following affinity purification, GEF-dependent interactions are determined by label-free quantitative (LFQ) intensity ratios. B, plot to show correlation between Log2 LFQ intensities of individual proteins identified in samples purified from RAB3GAP1- and RAB3GAP2-null cells. C, plot to show correlation between Log2 LFQ intensities of individual proteins identified in samples purified from WT and RAB3GAP-null cells. Highlighted datapoints correspond to proteins later found to have RAB3GAP-null:WT intensity ratios ≤0.5. D, Venn diagram to show overlap between all RAB18 associations, TRAPPII-dependent interactions (TRAPPC9-null:WT intensity ratios <0.5), and RAB3GAP-dependent associations (RAB3GAP-null:WT intensity ratios <0.5). E, Western blotting of samples purified from WT and RAB3GAP1-null cells in an independent BioID experiment. Levels of selected proteins are consistent with RAB3GAP-null:WT intensity ratios {braces}.
Figure 2
Figure 2
Initial screening of putative RAB18 effectors reveals that levels of SPG20 are significantly reduced in RAB18-null and TBC1D20-null cells.A, comparative fluorescence microscopy of selected RAB18-associated proteins in WT and RAB18-null HeLa cells. Cells of different genotypes were labeled with CellTrace-Violet and CellTrace-Far Red reagents, corresponding to blue and magenta channels, respectively. Cells were stained with antibodies against indicated proteins in green channel panels (shown in grayscale). B, comparative fluorescence microscopy of selected RAB18-associated proteins in lipid-loaded WT and RAB18-null HeLa cells. Cells were stained as aforementioned but were treated for 15 h with 200 μM oleic acid, 1 μg/ml BODIPY-558/568-C12 (red channel; BPY) prior to fixation. C, schematic to show method for quantification of protein levels by fluorescence intensity. In each frame, cell areas for each genotype are generated by thresholding CellTrace channels, intensity of antibody staining is measured for each cell in multiple frames. D, example frames showing WT and mutant cells of the indicated genotypes, labeled with CellTrace-Far Red and CellTrace-Violet reagents, respectively, and then stained for SPG20. E, quantification of SPG20-specific fluorescence in WT cells by direct comparison with SPG20-null cells. F, quantification of SPG20 fluorescence (%wt) in cells of different genotypes. Data were derived from analysis of at least 18 frames—each containing >5 WT and >5 mutant cells—per genotype. Two-tailed unpaired Welch’s t test ∗p < 0.001. Bars represent 10 μm.
Figure 3
Figure 3
SEC22A associates with RAB18 and influences lipid droplet (LD) morphology.A, confocal micrograph to show overlapping localization of exogenous mEmerald-SEC22A (cyan) and mCherry-ER (red) in HeLa cells. Images are representative of at least 40 cells in three independent experiments. B, immunoprecipitation of exogenous HA-RAB18 from WT and RAB3GAP1-null HeLa cells. Cells were transfected with HA-RAB18 and/or mEmerald-SEC22A and lysed 24 h post-transfection. Anti-HA immunoprecipitates and input samples were subjected to SDS-PAGE and immunostaining for HA and GFP (mEmerald). C, confocal micrographs showing altered morphology in WT and RAB3GAP1-null HeLa cells coexpressing mEmerald-SEC22A and mCherry-RAB18; zoom shows colabeled vesicular structures. Images are representative of at least 10 cells in two independent experiments. D, RAB18 LFQ intensities from a reciprocal BioID experiment showing a reduced association between BioID2(Gly40Ser)-SEC22A and endogenous RAB18 in RAB3GAP-null compared with WT HeLa cells. Data were adjusted to account for nonspecific binding of RAB18 to beads and normalized by SEC22A LFQ intensities in each replicate experiment. Error bars represent SD. Data for other BioID2(Gly40Ser)-SEC22A-associated proteins are provided in Table S5. E, example of confocal micrographs and scatter plots to show effects of ZW10, NBAS, and SEC22A knockdowns on LD number and diameter. siRNA-treated IHH cells were loaded with 200 nM BSA-conjugated oleate, fixed and stained with BODIPY and DAPI, and imaged. Images were analyzed using ImageJ. Data are representative of three independent experiments. Two-tailed unpaired Welch’s t test #p < 0.05 and ∗p < 0.005. Bars represent 5 μm. BSA, bovine serum albumin; DAPI, 4′,6-diamidino-2-phenylindole; ER, endoplasmic reticulum; HA, hemagglutinin; IHH, immortalized human hepatocyte; LFQ, label-free quantitation.
Figure 4
Figure 4
mCherry-RAB18 recruits TMCO4-EGFP to the ER membrane in an RAB3GAP-dependent manner.A, confocal micrographs to show diffuse localization of exogenous TMCO4-EGFP (green) compared with mCherry-ER (red) and overlapping localization of exogenous EGFP-RAB18 (green) and mCherry-ER in HeLa cells. Images are representative of at least 10 cells in two independent experiments. B, confocal micrographs to show localization of exogenous mCherry-RAB18 and TMCO4-EGFP in WT cells and in mutant cells of different genotypes. WT and mutant cells of the indicated genotypes were labeled with CellTrace-Violet and CellTrace-Far Red reagents, respectively (magenta and blue channels). Images are representative of at least 30 cells in two independent experiments. Clear colocalization between mCherry-RAB18 and TMCO4-EGFP was observed in all WT and TRAPPC9-null cells and in no RAB3GAP1- or RAB3GAP2-null cells. C, immunoprecipitation of exogenous HA-RAB18 from HeLa cells of different genotypes. Cells were transfected with the indicated constructs and lysed 24 h post-transfection. Anti-HA immunoprecipitates and input samples were subjected to SDS-PAGE and immunostaining for HA and GFP. Bars represent 10 μm. EGFP, enhanced GFP; ER, endoplasmic reticulum; HA, hemagglutinin.
Figure 5
Figure 5
RAB18 is involved in the mobilization and biosynthesis of cholesterol.A, plots to show cholesteryl ester (CE) loading and efflux. CHO cells, stably expressing RAB18(WT), RAB18(Gln67Leu), and RAB18(Ser22Asn), were incubated with [14C]-oleate, for 24 h, in the presence of lipoprotein-depleted serum (LPDS) (left panel) or FBS (right panel). Following lipid extraction, TLC was used to separate CE, and radioactivity was measured by scintillation counting. Measurements were made at t = 0 and at 4 and 8 h following the addition of 50 μg/ml high-density lipoprotein (HDL) to the cells. B, bar graph to show cholesterol efflux. CHO cells were incubated with [3H]-cholesterol, for 24 h, in the presence of FBS. After washing, they were incubated with 25 μg/ml apolipoprotein A-I for 5 h. The quantity of [3H]-sterol in the media is shown as a percentage of the total cellular radioactivity (mean ± SD). C, schematic of postsqualene cholesterol biosynthesis pathway with the sterols quantified by GC–MS–selected ion monitoring (GC–MS–SIM) named. Solid arrows indicate biosynthetic steps catalyzed by EBP, SC5D, and DHCR7. D, bar graph of sterol profile in WT and RAB18-null HeLa cells. Cells were grown in media supplemented with LPDS for 48 h. Extracted sterols were analyzed by GC–M–SIM. Percent of sterol was calculated as a proportion of total quantified sterols, excluding cholesterol, following normalization to a 5α-cholestane internal standard. n = 3; ±SD. E, bar graph of sterol profile in parental control fibroblasts and RAB3GAP1-deficient fibroblasts from an individual with Micro syndrome. Cells were grown in media supplemented with LPDS for 48 h. Extracted sterols were analyzed by GC–MS–SIM. Percent of cholesterol was calculated to express each quantified sterol as a proportion of total quantified cholesterol. F, bar graphs to show incorporation of [3H]-mevalonate and [3H]-acetate into cholesterol in a panel of HeLa cell lines. Cells were grown in media supplemented with LPDS for 24 h and then incubated with 5 μCi/well [3H]-mevalonate or 10 μCi/well [3H]-acetate for 24 h. TLC was used to separate free cholesterol, and radioactivity was quantified by scintillation counting (n = 3; mean ± SD). G, immunoprecipitation of HA-RAB18 from HeLa cells of different genotypes. Cells were transfected with the indicated constructs and lysed 24 h post-transfection. Anti-HA immunoprecipitates and input samples were subjected to SDS-PAGE and immunostaining for HA and mCherry. H, bar graph to show incorporation of [3H]-mevalonate into cholesterol in HEK293 cells transduced with lentivirus constructs. Cells transduced with the indicated constructs were selected with puromycin for at least 7 days, grown in media supplemented with LPDS for 24 h, and then incubated with 5 μCi/well [3H]-mevalonate for 24 h. TLC was used to separate free cholesterol, and radioactivity was quantified by scintillation counting (n = 3; mean ± SD). I, Western blotting to show levels of full-length OSBPL2 expression in cells transduced with the indicated lentivirus constructs. Prior to sampling, cells were selected with puromycin for at least 7 days. J, bar graph to show incorporation of [3H]-mevalonate into cholesterol in HEK293 cells stably expressing RAB18(WT), RAB18(Gln67Leu), and RAB18(Ser22Asn) and transduced with lentivirus constructs. Cells transduced with nontargeting (scr) or ORP2 exon 8-targeting CRISPR constructs were selected with puromycin for at least 7 days, grown in media supplemented with LPDS for 24 h, and then incubated with 5 μCi/well [3H]-mevalonate for 24 h. TLC was used to separate free cholesterol, and radioactivity was quantified by scintillation counting (n = 4; mean ± SD). Two-tailed unpaired Welch’s t test #p < 0.05, ∗p < 0.01, and p < 0.001. HA, hemagglutinin; HEK293, human embryonic kidney 293 cell line.

References

    1. Zhen Y., Stenmark H. Cellular functions of Rab GTPases at a glance. J. Cell Sci. 2015;128:3171–3176. - PubMed
    1. Barr F., Lambright D.G. Rab GEFs and GAPs. Curr. Opin. Cell Biol. 2010;22:461–470. - PMC - PubMed
    1. Lamber E.P., Siedenburg A.-C., Barr F.A. Rab regulation by GEFs and GAPs during membrane traffic. Curr. Opin. Cell Biol. 2019;59:34–39. - PubMed
    1. Aligianis I.A., Johnson C.A., Gissen P., Chen D., Hampshire D., Hoffmann K., et al. Mutations of the catalytic subunit of RAB3GAP cause Warburg Micro syndrome. Nat. Genet. 2005;37:221–223. - PubMed
    1. Bem D., Yoshimura S.-I., Nunes-Bastos R., Bond F.C., Kurian M.A., Rahman F., et al. Loss-of-function mutations in RAB18 cause Warburg micro syndrome. Am. J. Hum. Genet. 2011;88:499–507. - PMC - PubMed

Publication types

MeSH terms

Supplementary concepts