. 2024 Jan 3;23(1):68-83.
doi: 10.1158/1535-7163.MCT-23-0118.

Brentuximab Vedotin-Driven Microtubule Disruption Results in Endoplasmic Reticulum Stress Leading to Immunogenic Cell Death and Antitumor Immunity

Affiliations

Brentuximab Vedotin-Driven Microtubule Disruption Results in Endoplasmic Reticulum Stress Leading to Immunogenic Cell Death and Antitumor Immunity

Ryan A Heiser et al. Mol Cancer Ther. .

Abstract

Brentuximab vedotin, a CD30-directed antibody-drug conjugate (ADC), is approved for clinical use in multiple CD30-expressing lymphomas. The cytotoxic payload component of brentuximab vedotin is monomethyl auristatin E (MMAE), a highly potent microtubule-disrupting agent. Preclinical results provided here demonstrate that treatment of cancer cells with brentuximab vedotin or free MMAE leads to a catastrophic disruption of the microtubule network eliciting a robust endoplasmic reticulum (ER) stress response that culminates in the induction of the classic hallmarks of immunogenic cell death (ICD). In accordance with the induction of ICD, brentuximab vedotin-killed lymphoma cells drove innate immune cell activation in vitro and in vivo. In the "gold-standard" test of ICD, vaccination of mice with brentuximab vedotin or free MMAE-killed tumor cells protected animals from tumor rechallenge; in addition, T cells transferred from previously vaccinated animals slowed tumor growth in immunodeficient mice. Immunity acquired from killed tumor cell vaccination was further amplified by the addition of PD-1 blockade. In a humanized model of CD30+ B-cell tumors, treatment with brentuximab vedotin drove the expansion and recruitment of autologous Epstein-Barr virus-reactive CD8+ T cells potentiating the activity of anti-PD-1 therapy. Together, these data support the ability of brentuximab vedotin and MMAE to drive ICD in tumor cells resulting in the activation of antigen-presenting cells and augmented T-cell immunity. These data provide a strong rationale for the clinical combination of brentuximab vedotin and other MMAE-based ADCs with checkpoint inhibitors.


Figures

Figure 1. Brentuximab vedotin–treated Hodgkin lymphoma cells express ICD hallmarks. A, MFI histograms of surface CRT staining on live L540cy cells measured by flow cytometry following treatment for 18 hours with the IC50 or IC90 concentrations of BV, oxaliplatin, etoposide, and cAC10. B, L540cy cell-surface expression of CRT measured by flow cytometry following treatment over a 48-hour time course with BV, cAC10, oxaliplatin, or etoposide. C, Extracellular ATP measured from L540cy cell-free supernatant following treatment for 18 hours with BV, IgG-MMAE, MMAE, oxaliplatin, or etoposide. D, Extracellular HMGB1 measured from L540cy cell-free supernatant following treatment for 18 hours with BV, IgG-MMAE, MMAE, etoposide, or oxaliplatin. Representative data from three independent experiments. Symbols represent biological replicates. *P < 0.05; ***P < 0.001 (one-way ANOVA followed by Dunnett's multiple comparisons test) compared with BV. Bars at the mean. ANOVA, analysis of variance; ATP, adenosine trisphosphate; BV, brentuximab vedotin; cAC10, chimeric anti-CD30 antibody; CRT, calreticulin; Dox, doxorubicin; Etop, etoposide; h, hour; HMGB1, non-histone chromatin-binding protein high-mobility group box 1; IC, inhibitory concentration; ICD, immunogenic cell death; IgG, immunoglobulin G; MFI, mean fluorescence intensity; MMAE, monomethyl auristatin E; PI, propidium iodide; ns, not significant; NT, not treated.
Figure 1.
Brentuximab vedotin–treated Hodgkin lymphoma cells express ICD hallmarks. A, MFI histograms of surface CRT staining on live L540cy cells measured by flow cytometry following treatment for 18 hours with the IC50 or IC90 concentrations of BV, oxaliplatin, etoposide, and cAC10. B, L540cy cell-surface expression of CRT measured by flow cytometry following treatment over a 48-hour time course with BV, cAC10, oxaliplatin, or etoposide. C, Extracellular ATP measured from L540cy cell-free supernatant following treatment for 18 hours with BV, IgG-MMAE, MMAE, oxaliplatin, or etoposide. D, Extracellular HMGB1 measured from L540cy cell-free supernatant following treatment for 18 hours with BV, IgG-MMAE, MMAE, etoposide, or oxaliplatin. Representative data from three independent experiments. Symbols represent biological replicates. *P < 0.05; ***P < 0.001 (one-way ANOVA followed by Dunnett's multiple comparisons test) compared with BV. Bars at the mean. ANOVA, analysis of variance; ATP, adenosine trisphosphate; BV, brentuximab vedotin; cAC10, chimeric anti-CD30 antibody; CRT, calreticulin; Dox, doxorubicin; Etop, etoposide; h, hour; HMGB1, non-histone chromatin-binding protein high-mobility group box 1; IC, inhibitory concentration; ICD, immunogenic cell death; IgG, immunoglobulin G; MFI, mean fluorescence intensity; MMAE, monomethyl auristatin E; PI, propidium iodide; ns, not significant; NT, not treated.
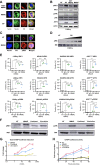
Figure 2. Brentuximab vedotin–induced ICD is associated with severe ER stress. A, Fluorescent staining of tubulin, ER, and nuclei in L540cy cells treated for 16 hours with human IgG-MMAE, MMAE, or BV. B, Western blot analysis of ER stress markers in L540cy cells treated for 18 hours with BV, IgG-MMAE, and MMAE. C, Spatial relationship of ER stress markers with the ER network in L540cy cells treated for 18 hours with MMAE. D, Western blot analysis of pIRE1 and IRE1 expressions in L540cy cells treated for 18 hours with a titration of BV. E, Intracellular detection of the proportion of viable lymphoma cells (L540cy, HDLM-2, KARPAS 299, and A20hCD30) upregulating UPR-associated proteins XBP1, ATF6, and pPERK by flow cytometry 48 hours after treatment with IC20–IC50 doses of the indicated agents. F, Representative western blot analysis of pIRE1, IRE1, pJNK, and JNK expression in L540cy cells treated for 18 hours with MMAE, vincristine, or paclitaxel. G, Dose–CHOP luciferase induction in Mia-PaCa-2 cells treated with MMAE, vincristine, or paclitaxel in vitro. H, CHOP-luciferase activity in Mia-PaCa-2 cells treated intratumorally with MMAE, vincristine, or paclitaxel in vivo. Western blot analysis band intensity quantification provided in Supplementary Fig. S3. Symbols represent biological replicates. *P < 0.05; **P < 0.01; ***P < 0.001; ****P < 0.0001, (one-way ANOVA followed by Dunnett's multiple comparisons test) compared with BV (for human lines), or MMAE (for A20hCD30). Bars at the median. ANOVA, analysis of variance; ATF4, activating transcription factor 4; ATF6, activating transcription factor 6, BV, brentuximab vedotin; CHOP, C/EBP homologous protein; ER, endoplasmic reticulum; hIgG, human immunoglobulin G; IC, inhibitory concentration; IgG, immunoglobulin G; IRE1, inositol-requiring enzyme 1; JNK, c-Jun N-terminal kinase; MMAE, monomethyl auristatin E; ns, not significant; NT, not treated; pIRE1, phosphorylated IRE1; pJNK, phosphorylated JNK; pPERK, phosphorylated protein kinase RNA-activated–like endoplasmic reticulum kinase; UPR, unfolded protein response; XBP1, X-box binding protein 1.
Figure 2.
Brentuximab vedotin–induced ICD is associated with severe ER stress. A, Fluorescent staining of tubulin, ER, and nuclei in L540cy cells treated for 16 hours with human IgG-MMAE, MMAE, or BV. B, Western blot analysis of ER stress markers in L540cy cells treated for 18 hours with BV, IgG-MMAE, and MMAE. C, Spatial relationship of ER stress markers with the ER network in L540cy cells treated for 18 hours with MMAE. D, Western blot analysis of pIRE1 and IRE1 expressions in L540cy cells treated for 18 hours with a titration of BV. E, Intracellular detection of the proportion of viable lymphoma cells (L540cy, HDLM-2, KARPAS 299, and A20hCD30) upregulating UPR-associated proteins XBP1, ATF6, and pPERK by flow cytometry 48 hours after treatment with IC20–IC50 doses of the indicated agents. F, Representative western blot analysis of pIRE1, IRE1, pJNK, and JNK expression in L540cy cells treated for 18 hours with MMAE, vincristine, or paclitaxel. G, Dose–CHOP luciferase induction in Mia-PaCa-2 cells treated with MMAE, vincristine, or paclitaxel in vitro. H, CHOP-luciferase activity in Mia-PaCa-2 cells treated intratumorally with MMAE, vincristine, or paclitaxel in vivo. Western blot analysis band intensity quantification provided in Supplementary Fig. S3. Symbols represent biological replicates. *P < 0.05; **P < 0.01; ***P < 0.001; ****P < 0.0001, (one-way ANOVA followed by Dunnett's multiple comparisons test) compared with BV (for human lines), or MMAE (for A20hCD30). Bars at the median. ANOVA, analysis of variance; ATF4, activating transcription factor 4; ATF6, activating transcription factor 6, BV, brentuximab vedotin; CHOP, C/EBP homologous protein; ER, endoplasmic reticulum; hIgG, human immunoglobulin G; IC, inhibitory concentration; IgG, immunoglobulin G; IRE1, inositol-requiring enzyme 1; JNK, c-Jun N-terminal kinase; MMAE, monomethyl auristatin E; ns, not significant; NT, not treated; pIRE1, phosphorylated IRE1; pJNK, phosphorylated JNK; pPERK, phosphorylated protein kinase RNA-activated–like endoplasmic reticulum kinase; UPR, unfolded protein response; XBP1, X-box binding protein 1.
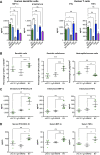
Figure 3. Proinflammatory chemokine and cytokine production in human dendritic and T cells and BV-induced ICD in L540cy xenografts. A, Chemokine and cytokine measurements by immunoassay (Luminex) following washing out of treatment agents. B, Recruitment of CD11c+ DCs compared with Ly6g+ cells into a L540cy xenograft 72 hours after administration of a single dose of BV, IgG-MMAE, or cAC10 (murine model; n = 5); levels of immune cells were determined by flow cytometry. C, Intratumoral murine cytokine activity in mice harboring L540cy xenografts 72 hours after administration of a single dose of BV, IgG-MMAE, or cAC10 (n = 5); cytokines were measured by immunoassay (Luminex). D, Upregulation of murine serum chemokines and cytokines in mice harboring L540cy xenografts 72 hours after administration of a single dose of BV, IgG-MMAE, or cAC10 (n = 5); cytokines were measured by immunoassay (Luminex). Representative data from two independent experiments, each symbol represents individual mice (n = 4–5 per group). *P < 0.05; **P < 0.01; ***P < 0.001, (one-way ANOVA followed by Dunnett's multiple comparisons test) compared with BV treatment. Bars represent the mean and SE. ANOVA, analysis of variance; BV, brentuximab vedotin; cAC10, chimeric anti-CD30 antibody; CCL2, chemokine (C-C motif) ligand 2; CXCL10, C-X-C motif chemokine ligand 10; Etop, etoposide; ICD, immunogenic cell death; IFN, interferon; IgG, immunoglobulin G; IP10, interferon gamma-induced protein 10; MIP-1α, macrophage inflammatory protein-1α; MMAE, monomethyl auristatin E; ns, not significant; NT, not treated; Oxal, oxaliplatin; SE, standard error; TNF, tumor necrosis factor.
Figure 3.
Proinflammatory chemokine and cytokine production in human dendritic and T cells and BV-induced ICD in L540cy xenografts. A, Chemokine and cytokine measurements by immunoassay (Luminex) following washing out of treatment agents. B, Recruitment of CD11c+ DCs compared with Ly6g+ cells into a L540cy xenograft 72 hours after administration of a single dose of BV, IgG-MMAE, or cAC10 (murine model; n = 5); levels of immune cells were determined by flow cytometry. C, Intratumoral murine cytokine activity in mice harboring L540cy xenografts 72 hours after administration of a single dose of BV, IgG-MMAE, or cAC10 (n = 5); cytokines were measured by immunoassay (Luminex). D, Upregulation of murine serum chemokines and cytokines in mice harboring L540cy xenografts 72 hours after administration of a single dose of BV, IgG-MMAE, or cAC10 (n = 5); cytokines were measured by immunoassay (Luminex). Representative data from two independent experiments, each symbol represents individual mice (n = 4–5 per group). *P < 0.05; **P < 0.01; ***P < 0.001, (one-way ANOVA followed by Dunnett's multiple comparisons test) compared with BV treatment. Bars represent the mean and SE. ANOVA, analysis of variance; BV, brentuximab vedotin; cAC10, chimeric anti-CD30 antibody; CCL2, chemokine (C-C motif) ligand 2; CXCL10, C-X-C motif chemokine ligand 10; Etop, etoposide; ICD, immunogenic cell death; IFN, interferon; IgG, immunoglobulin G; IP10, interferon gamma-induced protein 10; MIP-1α, macrophage inflammatory protein-1α; MMAE, monomethyl auristatin E; ns, not significant; NT, not treated; Oxal, oxaliplatin; SE, standard error; TNF, tumor necrosis factor.
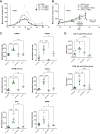
Figure 4. Brentuximab vedotin treatment of humanized mice bearing LCL tumors enhances intratumoral immune activation. NSG mice (n = 5) harboring CD30+ LCL tumors were injected intravenously with autologous donor PBMCs 5 days after tumor implantation. A, Tumor volume was measured over time in NSG mice (n = 5 per group) receiving no PBMCs and 2.5, 5, and 10 million PBMCs. B, Mice were treated with BV, cAC10, or a non-binding control (human IgG-MMAE) 3 days before receiving a total of 2.0 × 10⁶ PBMCs (n = 10 per group). Tumors were collected for analysis of immune activity 4 and 11 days after transfer of PBMCs (n = 5 per time-point). C, Immune-related transcripts (NanoString) were measured 4 days following PBMC transfer in NSG mice treated with BV, cAC10, or a non-binding control (IgG-MMAE) 3 days before PBMC transfer. D, Tumors taken 11 days after PBMC transfer in NSG mice treated with BV or a non-binding control (IgG-MMAE) 3 days before PBMC transfer were processed and evaluated by flow cytometry for immune cell infiltration. Each symbol represents NanoString analysis or flow cytometry of immune cells from individual mice (n = 4–7 per group). *P < 0.05; **P < 0.01; ***P < 0.001; ****P < 0.0001 (one-way ANOVA followed by Dunnett's multiple comparisons test) compared with BV treatment. Bars represent the mean and SE. ANOVA, analysis of variance; BV, brentuximab vedotin; cAC10, chimeric anti-CD30 antibody; CXCL9, C-X-C motif chemokine ligand 9; GZMB, granzyme B; IFNγ, interferon gamma; hIgG, human immunoglobulin G; IgG, immunoglobin G; ITGAM, integrin alpha M; LAMP3, lysosomal-associated membrane glycoprotein 3; LCL, lymphoblastoid cell line; MMAE, monomethyl auristatin E; NK, natural killer, NLRP3, nucleotide-binding domain, leucine-rich–containing family pyrin domain–containing-3; NOD, nonobese diabetic; NSG, NOD SCID gamma; PBMC, peripheral blood mononuclear cells; SCID, severe combined immune deficient; SE, standard error; TIL, tumor-infiltrating lymphocyte; TNF, tumor necrosis factor.
Figure 4.
Brentuximab vedotin treatment of humanized mice bearing LCL tumors enhances intratumoral immune activation. NSG mice (n = 5) harboring CD30+ LCL tumors were injected intravenously with autologous donor PBMCs 5 days after tumor implantation. A, Tumor volume was measured over time in NSG mice (n = 5 per group) receiving no PBMCs and 2.5, 5, and 10 million PBMCs. B, Mice were treated with BV, cAC10, or a non-binding control (human IgG-MMAE) 3 days before receiving a total of 2.0 × 10⁶ PBMCs (n = 10 per group). Tumors were collected for analysis of immune activity 4 and 11 days after transfer of PBMCs (n = 5 per time-point). C, Immune-related transcripts (NanoString) were measured 4 days following PBMC transfer in NSG mice treated with BV, cAC10, or a non-binding control (IgG-MMAE) 3 days before PBMC transfer. D, Tumors taken 11 days after PBMC transfer in NSG mice treated with BV or a non-binding control (IgG-MMAE) 3 days before PBMC transfer were processed and evaluated by flow cytometry for immune cell infiltration. Each symbol represents NanoString analysis or flow cytometry of immune cells from individual mice (n = 4–7 per group). *P < 0.05; **P < 0.01; ***P < 0.001; ****P < 0.0001 (one-way ANOVA followed by Dunnett's multiple comparisons test) compared with BV treatment. Bars represent the mean and SE. ANOVA, analysis of variance; BV, brentuximab vedotin; cAC10, chimeric anti-CD30 antibody; CXCL9, C-X-C motif chemokine ligand 9; GZMB, granzyme B; IFNγ, interferon gamma; hIgG, human immunoglobulin G; IgG, immunoglobin G; ITGAM, integrin alpha M; LAMP3, lysosomal-associated membrane glycoprotein 3; LCL, lymphoblastoid cell line; MMAE, monomethyl auristatin E; NK, natural killer, NLRP3, nucleotide-binding domain, leucine-rich–containing family pyrin domain–containing-3; NOD, nonobese diabetic; NSG, NOD SCID gamma; PBMC, peripheral blood mononuclear cells; SCID, severe combined immune deficient; SE, standard error; TIL, tumor-infiltrating lymphocyte; TNF, tumor necrosis factor.
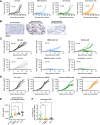
Figure 5. Brentuximab vedotin–induced ICD protects against subsequent tumor challenges. A20 lymphoma cells expressing human CD30 (A20hCD30) were treated with BV or MMAE in vitro, and dying cells were used to immunize wild-type BALB/c mice. Cells flash-frozen in liquid nitrogen were injected as a non-ICD control. A, Mice (n = 8 per treatment group) immunized with BV-killed, MMAE-killed, or flash-frozen A20hCD30 cells were challenged with wild-type A20 cells on day 14 and monitored for tumor growth. B, Detection of CD8+ T cells within the tumor by IHC after 9 days. C, BALB/c mice (n = 9 per group) were immunized with BV- or MMAE-killed A20 cells and rechallenged 14 days later. Anti–PD-1 (1 mg/kg) was administered on days 6, 9, 14, and 17 after tumor challenge and tumor growth was monitored. Numbers in figures reflect surviving mice out of total at day 29. D, A20 tumor-bearing NSG mice (n = 5–8 per treatment group) received CD3+ T cells from mice immunized with BV-killed or flash-frozen–killed A20 cells, or T cells from unimmunized mice (naive) and monitored for tumor growth. E, Tumor volume AUC for mice receiving T cells from mice immunized with brentuximab vedotin–killed A20hCD30 tumor cells. F, CD8+ T-cell infiltration. Representative data from two independent experiments, each symbol represents an individual mouse. *P < 0.05; **P < 0.01; ***P < 0.001, (one-way ANOVA followed by Dunnett's multiple comparisons test) compared with BV treatment. Bars represent the mean. ANOVA, analysis of variance; AUC, area under the curve; BV, brentuximab vedotin; CR, complete response; ICD, immunogenic cell death; IHC, immunohistochemistry; MMAE, monomethyl auristatin E; NOD, nonobese diabetic; ns, not significant; NSG, NOD SCID gamma; NT, not treated; PD-1, programmed cell death protein 1; SCID, severe combined immune deficiency.
Figure 5.
Brentuximab vedotin–induced ICD protects against subsequent tumor challenges. A20 lymphoma cells expressing human CD30 (A20hCD30) were treated with BV or MMAE in vitro, and dying cells were used to immunize wild-type BALB/c mice. Cells flash-frozen in liquid nitrogen were injected as a non-ICD control. A, Mice (n = 8 per treatment group) immunized with BV-killed, MMAE-killed, or flash-frozen A20hCD30 cells were challenged with wild-type A20 cells on day 14 and monitored for tumor growth. B, Detection of CD8+ T cells within the tumor by IHC after 9 days. C, BALB/c mice (n = 9 per group) were immunized with BV- or MMAE-killed A20 cells and rechallenged 14 days later. Anti–PD-1 (1 mg/kg) was administered on days 6, 9, 14, and 17 after tumor challenge and tumor growth was monitored. Numbers in figures reflect surviving mice out of total at day 29. D, A20 tumor-bearing NSG mice (n = 5–8 per treatment group) received CD3+ T cells from mice immunized with BV-killed or flash-frozen–killed A20 cells, or T cells from unimmunized mice (naive) and monitored for tumor growth. E, Tumor volume AUC for mice receiving T cells from mice immunized with brentuximab vedotin–killed A20hCD30 tumor cells. F, CD8+ T-cell infiltration. Representative data from two independent experiments, each symbol represents an individual mouse. *P < 0.05; **P < 0.01; ***P < 0.001, (one-way ANOVA followed by Dunnett's multiple comparisons test) compared with BV treatment. Bars represent the mean. ANOVA, analysis of variance; AUC, area under the curve; BV, brentuximab vedotin; CR, complete response; ICD, immunogenic cell death; IHC, immunohistochemistry; MMAE, monomethyl auristatin E; NOD, nonobese diabetic; ns, not significant; NSG, NOD SCID gamma; NT, not treated; PD-1, programmed cell death protein 1; SCID, severe combined immune deficiency.
Figure 6. Protective immunity from brentuximab vedotin- or MMAE-mediated immunization is enhanced by anti–PD-1 treatment. A, Representative expression of PD-1 and PD-L1 on T cells and LCL tumor cells, respectively, on day 35 by flow cytometry in the autologous PBMC/LCL tumor model. Staining demonstrates the presence of an active PD-1/PD-L1 axis between T cells and LCL tumor cells. B, LCL tumor volumes were analyzed for treatment conditions relative to mice that received only PBMCs. Tumor-bearing mice that received PBMCs and a subtherapeutic dose of BV (1 mg/kg, i.p.) with or without anti–PD-1 antibody (10 mg/kg, i.p. 2 and 7 days after PBMCs), showed enhanced immune-mediated tumor regression. C, Tumor volumes (AUC). Error bars indicate SEM. *P < 0.05; ****P < 0.001 (one-way ANOVA followed by Dunnett's multiple comparisons test). ANOVA, analysis of variance; AUC, area under the curve; BV, brentuximab vedotin; IgG, immunoglobulin G; i.p., intraperitoneal injection; LCL, lymphoblastoid cell line; nivo, nivolumab; NT, not treated; PBMC, peripheral blood mononuclear cells; PD-1, programmed cell death protein 1; PD-L1, programmed death-ligand 1; SEM, standard error of the mean; TIL, tumor-infiltrating lymphocyte.
Figure 6.
Protective immunity from brentuximab vedotin- or MMAE-mediated immunization is enhanced by anti–PD-1 treatment. A, Representative expression of PD-1 and PD-L1 on T cells and LCL tumor cells, respectively, on day 35 by flow cytometry in the autologous PBMC/LCL tumor model. Staining demonstrates the presence of an active PD-1/PD-L1 axis between T cells and LCL tumor cells. B, LCL tumor volumes were analyzed for treatment conditions relative to mice that received only PBMCs. Tumor-bearing mice that received PBMCs and a subtherapeutic dose of BV (1 mg/kg, i.p.) with or without anti–PD-1 antibody (10 mg/kg, i.p. 2 and 7 days after PBMCs), showed enhanced immune-mediated tumor regression. C, Tumor volumes (AUC). Error bars indicate SEM. *P < 0.05; ****P < 0.001 (one-way ANOVA followed by Dunnett's multiple comparisons test). ANOVA, analysis of variance; AUC, area under the curve; BV, brentuximab vedotin; IgG, immunoglobulin G; i.p., intraperitoneal injection; LCL, lymphoblastoid cell line; nivo, nivolumab; NT, not treated; PBMC, peripheral blood mononuclear cells; PD-1, programmed cell death protein 1; PD-L1, programmed death-ligand 1; SEM, standard error of the mean; TIL, tumor-infiltrating lymphocyte.

References

    1. Zhou J, Wang G, Chen Y, Wang H, Hua Y, Cai Z. Immunogenic cell death in cancer therapy: present and emerging inducers. J Cell Mol Med 2019;23:4854–65. - PMC - PubMed
    1. de Souza AP, Bonorino C. Tumor immunosuppressive environment: effects on tumor-specific and nontumor antigen immune responses. Expert Rev Anticancer Ther 2009;9:1317–32. - PubMed
    1. Chen DS, Mellman I. Oncology meets immunology: the cancer-immunity cycle. Immunity 2013;39:1–10. - PubMed
    1. Kazama H, Ricci JE, Herndon JM, Hoppe G, Green DR, Ferguson TA. Induction of immunological tolerance by apoptotic cells requires caspase-dependent oxidation of high-mobility group box-1 protein. Immunity 2008;29:21–32. - PMC - PubMed
    1. Kroemer G, Galassi C, Zitvogel L, Galluzzi L. Immunogenic cell stress and death. Nat Immunol 2022;23:487–500. - PubMed

Grants and funding