Review
. 2023 Sep;23(5):442-448.
doi: 10.7861/clinmed.2023-23.5.Cardio3. Epub 2023 Sep 29.

Diagnosis and management of ventricular tachycardia

Affiliations
Review

Diagnosis and management of ventricular tachycardia

John Whitaker et al. Clin Med (Lond). 2023 Sep.

Abstract

Ventricular tachycardia (VT) describes rapid heart rhythms originating from the ventricles. Accurate diagnosis of VT is important to allow prompt referral to specialist services for ongoing management. The diagnosis of VT is usually made based on electrocardiographic data, most commonly 12-lead echocardiography (ECG), as well as supportive cardiac telemetric monitoring. Distinguishing between VT and supraventricular arrhythmias on ECG can be difficult. However, the VT diagnosis frequently needs to be made rapidly in the acute setting. In this review, we discuss the definition of VT, review features of wide-complex tachycardia (WCT) on ECG that might be helpful in diagnosing VT, discuss the different substrates in which VT can occur and offer brief comments on management considerations for patients found to have VT.

Keywords: ECG; Ventricular tachycardia; ablation; arrhythmia; wide-complex tachycardia.


Figures

Fig 1.
Fig 1.
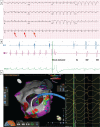
Electrocardiographic diagnosis of ventricular tachycardia (VT). (a) 12-lead electrogram (ECG) showing wide complex tachycardia with right bundle branch block configuration. Diagnosis is made from the regular P-waves, which are dissociated with QRS complexes and indicated by red arrows. (b) Electrograms from an implantable cardiac device (ICD; in this case, a biventricular ICD). Top line (blue) shows nearfield electrical signal on atrial channel, middle line (magenta) shows nearfield electrical signal on right ventricular (RV) channel and bottom line (green) shows far field electrical signal between RV lead tip and left infra-clavicular generator, which can be thought of as a single lead ECG and is used as a discriminator channel to differentiate conducted (ie supraventricular tachycardia; SVT) from ventricular rhythms. On the left-hand side of the panel, there are more signals on the RV channel than on the atrial channel, which is seen to be dissociated from the signal on the ventricular channel, a pattern diagnostic of VT. The device delivers a high-energy shock (indicated) following which the VT terminates and there is a single conducted sinus beat (Vs) followed by resumption of biventricular pacing (BiV). The difference in morphology on the discriminator channel between both the spontaneous beat (VS) and biventricular paced beats (BiV) can be seen. (c) Data from an electrophysiology study of a patient undergoing VT ablation for recurrent shocks in the context of a non-ischaemic cardiomyopathy. The image demonstrates a catheter entering the left ventricle (LV) through the mitral valve. Colours on the LV shell indicate the measured bipolar voltage and are used as an indication of the health (or otherwise) of the tissue, with purple corresponding to a voltage in the normal range, and red representing severely reduced voltage, found in diseased tissue. A 12-lead ECG of the VT being treated is shown on the right side of the panel. This patient was successfully treated for VT with an ablation procedure and remained free from further shocks during follow-up, which, at the time of writing, was 25 months.
Fig 2.
Fig 2.
Features on ECG that help in the diagnosis of ventricular tachycardia. Atrioventricular (AV) dissociation is diagnostic of VT. Morphological criteria can be applied depending on the overall similarity of the QRS complex in lead V1 to a typical ‘left bundle branch block’ or ‘right bundle branch block’ morphology. Having differentiated between these, further criteria can be applied. As per the image, QRS duration, precordial lead concordance, and QRS axis all suggest VT. Reproduced via a Creative Commons Attribution-NonCommercial License from Kashou et al.
Fig 3.
Fig 3.
An example of ventricular tachycardia (VT) arising from the right ventricular outflow tract (a) Characteristic 12-lead electrogram (ECG) demonstrating RVOT VT. The QRS is ‘inferiorly directed’, that is, it is predominantly positive in leads II, aVF and III. In the precordial leads, the QRS has a left bundle branch block morphology with a precordial transition (ie the first precordial lead in which a predominantly positive QRS is seen) at lead V4. Note is also made of a QRS complex that is predominantly positive in lead I, indicating a leftward direction of activation. (b) Activation map of the tachycardia shown in (a). Here, the 3D surface represents the right ventricle, with the inflow and outflow valves indicated. The site of origin of the tachycardia is indicated by the arrow, which was the site of successful ablation of the VT.

References

    1. Joyner RW, van Capelle FJ. Propagation through electrically coupled cells. How a small SA node drives a large atrium. Biophys J 1986;50:1157–64. - PMC - PubMed
    1. McAlpine WA. Heart and coronary arteries. Berlin; Springer, 1975.
    1. Kapa S, Gaba P, Desimone CV, Asirvatham SJ. Fascicular ventricular arrhythmias: pathophysiologic mechanisms, anatomical constructs, and advances in approaches to management. Circ Arrhythm Electrophysiol 2017;10:e002476. - PubMed
    1. Christoffels VM, Moorman AFM. Development of the cardiac conduction system. Circ Arrhythm Electrophysiol 2009;2:195–207. - PubMed
    1. Virágh SZ, Challice CE. The development of the conduction system in the mouse embryo heart. Dev Biol 1977;56:397–411. - PubMed

MeSH terms