. 2023 Sep 29;13(1):16417.
doi: 10.1038/s41598-023-43195-7.

Müller matrix polarimetry for pancreatic tissue characterization

Affiliations

Müller matrix polarimetry for pancreatic tissue characterization

Paulo Sampaio et al. Sci Rep. .

Abstract

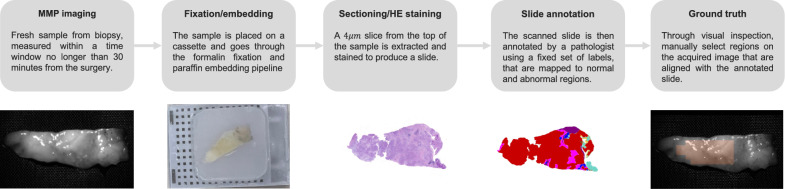
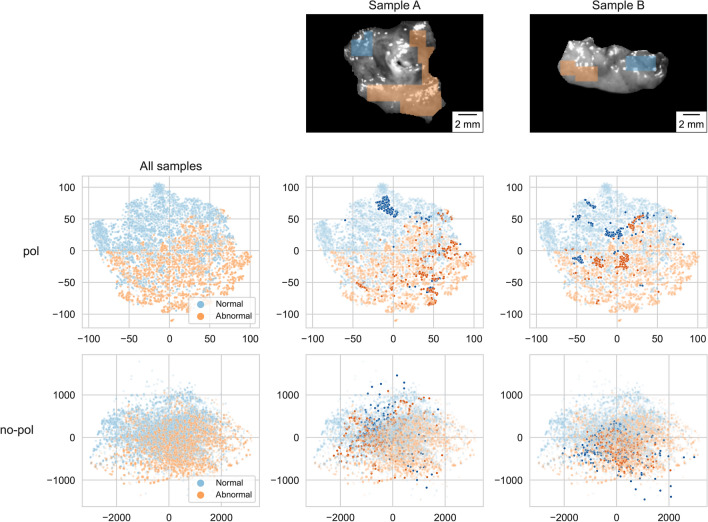
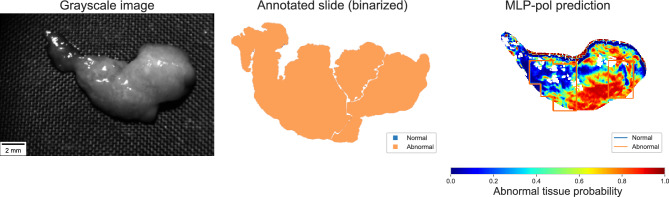
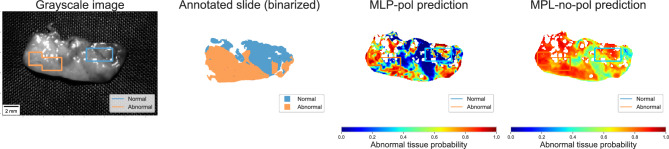
Polarimetry is an optical characterization technique capable of analyzing the polarization state of light reflected by materials and biological samples. In this study, we investigate the potential of Müller matrix polarimetry (MMP) to analyze fresh pancreatic tissue samples. Due to its highly heterogeneous appearance, pancreatic tissue type differentiation is a complex task. Furthermore, its challenging location in the body makes creating direct imaging difficult. However, accurate and reliable methods for diagnosing pancreatic diseases are critical for improving patient outcomes. To this end, we measured the Müller matrices of ex-vivo unfixed human pancreatic tissue and leverage the feature-learning capabilities of a machine-learning model to derive an optimized data representation that minimizes normal-abnormal classification error. We show experimentally that our approach accurately differentiates between normal and abnormal pancreatic tissue. This is, to our knowledge, the first study to use ex-vivo unfixed human pancreatic tissue combined with feature-learning from raw Müller matrix readings for this purpose.


Conflict of interest statement

The authors declare no competing interests.

Figures

Figure 1
Figure 1
Data acquisition process. Notice that the sample shape in the scanned and annotated slides can be significantly different from the one captured by our MMP device due to the sample passing through the histopathology laboratory pipeline. Following a slide annotation, our data contains both MMP images, and corresponding tissue type classifications at pixel-wise levels.
Figure 2
Figure 2
(Left) Schematic representation of our custom-built dual-rotating retarder polarimeter and (Right) visual depiction of our instrument with a phantom sample.
Figure 3
Figure 3
(a) ROC curves and AUCs attained on the test set by each evaluated model. Values are averaged over 4 folds and error bars indicate 1 standard deviation. (b) Boxplot of prediction probabilities using MLP-pol and (c) MLP-no-pol. The prediction scores observed on the MLP-no-pol (c) depict a considerable overlap among classes, while a clear class separation is observed on MLP-pol (b).
Figure 4
Figure 4
Visual representation of MMP pixels using t-SNE analysis. (First column) t-SNE plots generated using all acquired samples. (Second and third columns) Highlighted observations from two samples containing both tissue types. The pol data generated a t-SNE embedding space where even pixels coming from the same sample are grouped according to their tissue type. The no-pol data was unable to generate an embedding space with clear tissue type separation.
Figure 5
Figure 5
Predictions results for three test samples: (A) entirely normal, (B) entirely abnormal, and (C) with both regions. The probability maps generated by MLP-pol correctly predicted the different tissue types with high confidence, including the two regions within the same sample. Predictions outside the annotated region matched the annotated slide. In contrast, the predictions of MLP-no-pol for samples A and B yielded scores with very low differentiation. On sample C, although it identified differences within the sample, it lacked the confidence presented by MLP-pol.
Figure 6
Figure 6
Sample exhibiting a high rate of false positives. t-SNE plot highlighting normal pixels that are located within the abnormal region.
Figure 7
Figure 7
Example of performance errors due to registration misalignment which induces a large false negative ratio. (Left) gray-scale image from our instrument, (Center) binarized slide annotation, and (Right) MLP-pol prediction with registered annotation overlayed.
Figure 8
Figure 8
Sample where both prediction models indicated similar regions. The contrast of prediction score among the regions given by MLP-pol is significantly higher, leading to a superior class separation when compared the MLP-no-pol.

References

    1. Alali S, Vitkin A. Polarized light imaging in biomedicine: Emerging mueller matrix methodologies for bulk tissue assessment. J. Biomed. Opt. 2015;20:61104. doi: 10.1117/1.JBO.20.6.061104. - DOI - PubMed
    1. He H, et al. Mueller matrix polarimetry-an emerging new tool for characterizing the microstructural feature of complex biological specimen. J. Lightwave Technol. 2019;37:2534–2548. doi: 10.1109/JLT.2018.2868845. - DOI
    1. Ghosh N, Vitkin AI. Tissue polarimetry: Concepts, challenges, applications, and outlook. J. Biomed. Opt. 2011;16:110801. doi: 10.1117/1.3652896. - DOI - PubMed
    1. He C, et al. Polarisation optics for biomedical and clinical applications: A review. Light Sci. Appl. 2021 doi: 10.1038/s41377-021-00639-x. - DOI - PMC - PubMed
    1. Tyo JS, Goldstein DL, Chenault DB, Shaw JA. Review of passive imaging polarimetry for remote sensing applications. Appl. Opt. 2006;45:5453–5469. doi: 10.1364/AO.45.005453. - DOI - PubMed

Publication types