. 2023 Sep 29;14(1):6103.
doi: 10.1038/s41467-023-41888-1.

The global costs of extreme weather that are attributable to climate change

Affiliations

The global costs of extreme weather that are attributable to climate change

Rebecca Newman et al. Nat Commun. .

Abstract

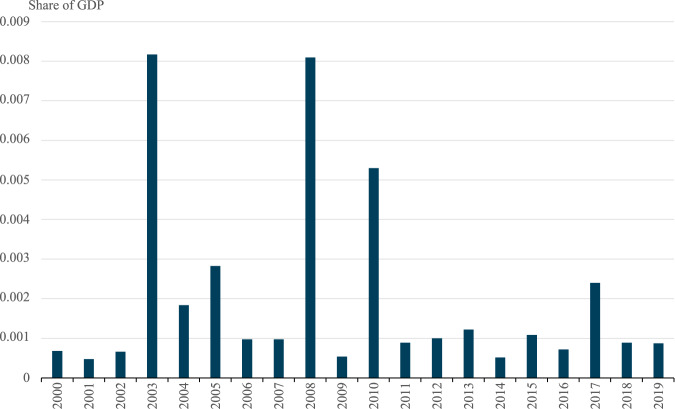
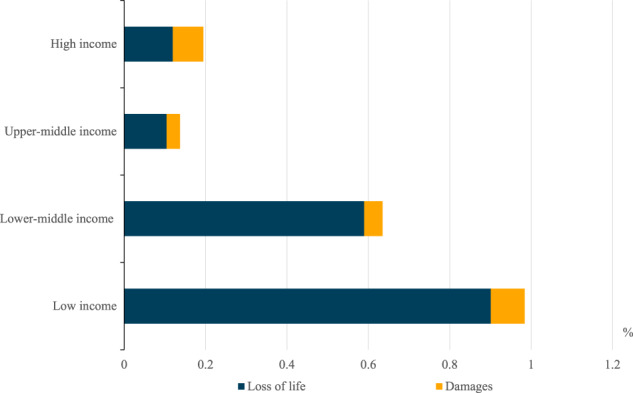
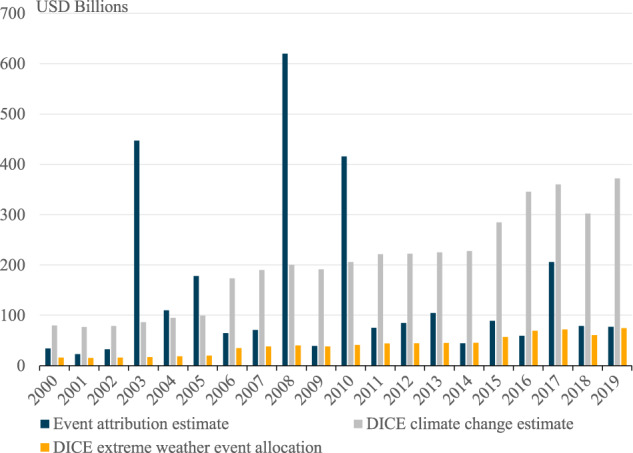
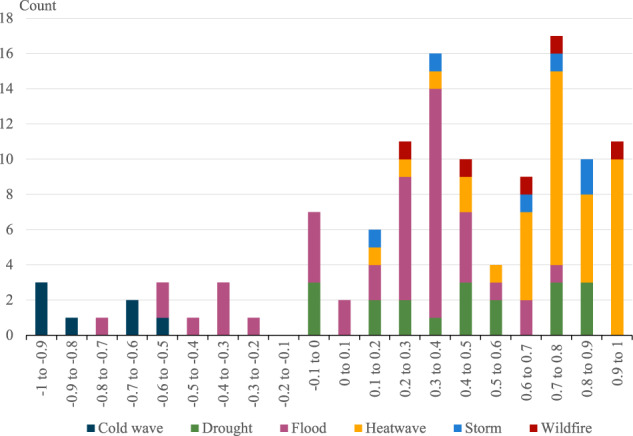
Extreme weather events lead to significant adverse societal costs. Extreme Event Attribution (EEA), a methodology that examines how anthropogenic greenhouse gas emissions had changed the occurrence of specific extreme weather events, allows us to quantify the climate change-induced component of these costs. We collect data from all available EEA studies, combine these with data on the socio-economic costs of these events and extrapolate for missing data to arrive at an estimate of the global costs of extreme weather attributable to climate change in the last twenty years. We find that US[Formula: see text] 143 billion per year of the costs of extreme events is attributable to climatic change. The majority (63%), of this is due to human loss of life. Our results suggest that the frequently cited estimates of the economic costs of climate change arrived at by using Integrated Assessment Models may be substantially underestimated.


Conflict of interest statement

The authors declare no competing interests.

Figures

Fig. 1
Fig. 1. Climate change-attributed loss of life and damages from extreme weather events.
These are the globally aggregated data for climate change-attributed impacts of disasters that were associated with extreme weather, using data collected from the Emergency Management Database - EM–DAT. Total costs represent the full estimate of the economic damages associated with an event, while the climate-attributed costs represent only the portion for which climate change is responsible. The combined bar represents the full cost, with the transparent portion representing the (statistical) lives lost and the solid portion are economic damages.
Fig. 2
Fig. 2. Value for loss of life (VSL) and economic damage from extreme weather events by income group (2000–2019).
The aggregated mortality and economic damage costs for each country/region income group, using the 2020 World Bank’s income classification.
Fig. 3
Fig. 3. Climate change-attributed loss of life and damages from extreme weather events as share of aggregate global Gross Domestic Product (GDP).
These are the globally aggregated data for climate change-attributed impacts of disasters that were associated with extreme weather, using data collected from the Emergency Management Database - EM–DAT. These represent only the portion which are attributable to climate change.
Fig. 4
Fig. 4. Climate change-attributed costs of extreme weather events as a proportion of 2019 Gross Domestic Product by income classification.
This figures uses the 2020 World Bank’s income classifications and are based on the average cost per annum over the 2000–2019 sample period.
Fig. 5
Fig. 5. Economic costs from climate change attribution and the Dynamic Integrated Climate Economy (DICE) model estimates.
The total cost calculated by the extreme event attribution method is shown relative to that calculated by the DICE damage function, as total in gray, and only the DICE estimates for extreme weather events (EWE) and other environmental damages in yellow.
Fig. 6
Fig. 6. The sampling method.
Of the whole ‘universe’ of extreme weather events (EWE), 6135 EWE are recorded by the Emergency Management Database (EM-DAT). If these 4864 recorded quantities for damages/deaths, but only 185 were matched with at least one of the 357 papers on attribution included in the CarbonBrief database.
Fig. 7
Fig. 7. Fraction of Attributable Risk (FAR) distribution across matched attribution results.
This figure shows the number of attribution events for each different FAR range, by the type of weather event.
Fig. 8
Fig. 8. Regional average Fraction of Attributable Risk (FAR) by event type.
This figure depicts the mean and the range of FARs matched, per weather type and by region. The number on the top of each vertical line represents the number of events for that region-type combination.

References

    1. World Meteorological Society (WMO). WMO Atlas of mortality and economic losses from weather, climate, and water extremes (1970–2019). Retrieved from https://library.wmo.int/doc_num.php?explnum_id=10769 (2021B).
    1. IPCC. Summary for policymakers. In Climate Change 2022: Impacts, Adaptation, and Vulnerability. Contribution of Working Group II to the Sixth Assessment Report of the Intergovernmental Panel on Climate Change (eds Pörtner, H.-O. et al.) 1–2272 (Cambridge University Press, 2022) 10.1017/9781009325844.
    1. Allen M. Liability for climate change. Nature. 2003;421:891–892. doi: 10.1038/421891a. - DOI - PubMed
    1. Stott P, Stone D, Allen M. Human contribution to the European heatwave of 2003. Nature. 2004;432:610–614. doi: 10.1038/nature03089. - DOI - PubMed
    1. Risser MD, Paciorek CJ, Stone DA. Spatially dependent multiple testing under model misspecification, with application to detection of anthropogenic influence on extreme climate events. J. Am. Stat. Assoc. 2019;114:61–78. doi: 10.1080/01621459.2018.1451335. - DOI