

The neutrophil-lymphocyte ratio as a risk factor for all-cause and cardiovascular mortality among individuals with diabetes: evidence from the NHANES 2003-2016
- PMID: 37775767
- PMCID: PMC10541705
- DOI: 10.1186/s12933-023-01998-y
The neutrophil-lymphocyte ratio as a risk factor for all-cause and cardiovascular mortality among individuals with diabetes: evidence from the NHANES 2003-2016
Abstract
Background: Evidence regarding the neutrophil-lymphocyte ratio (NLR) and mortality risk in diabetes patients is scarce. This study investigated the relationship of the NLR with all-cause and cardiovascular mortality risk in diabetes patients.
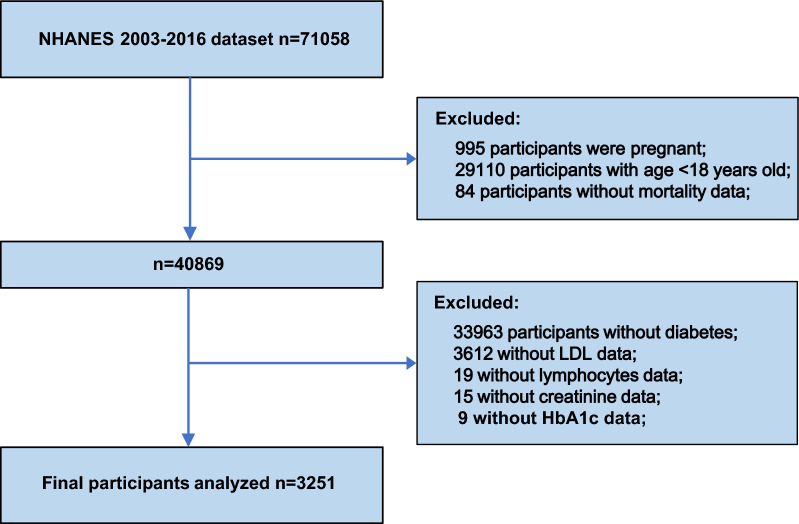
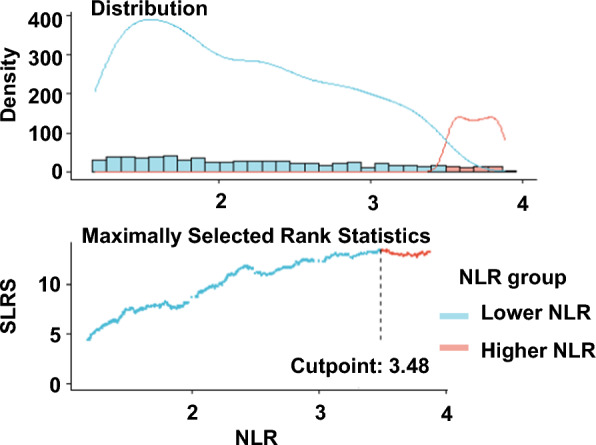
Methods: Diabetes patients (n = 3251) from seven National Health and Nutrition Examination Survey (NHANES) cycles (2003-2016) were included in this study. The cause of death and mortality status of the participants were obtained from National Death Index records. Restricted cubic spline (RCS) was used to visualize the association of the NLR with mortality risk. The maximally selected rank statistics method (MSRSM) was used to determine the optimal NLR cutoff value corresponding to the most significant association with survival outcomes. Weighted multivariable Cox regression models and subgroup analyses were adopted to assess the association of the NLR with all-cause and cardiovascular mortality. Time-dependent receiver operating characteristic curve (ROC) analysis was conducted to evaluate the accuracy of the NLR in predicting survival outcomes.
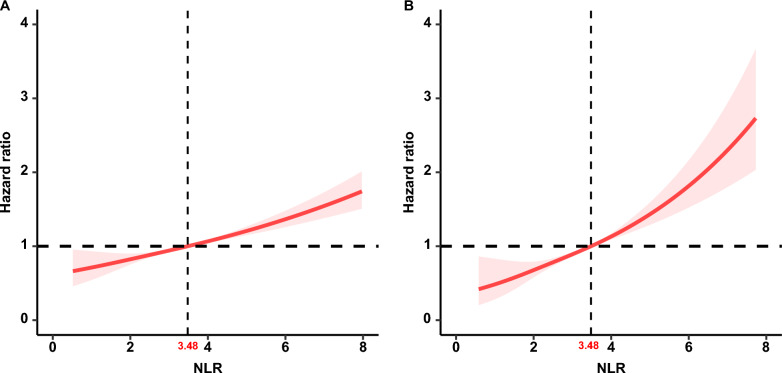
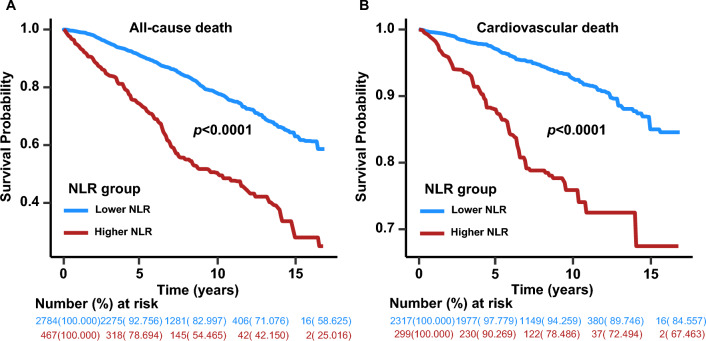
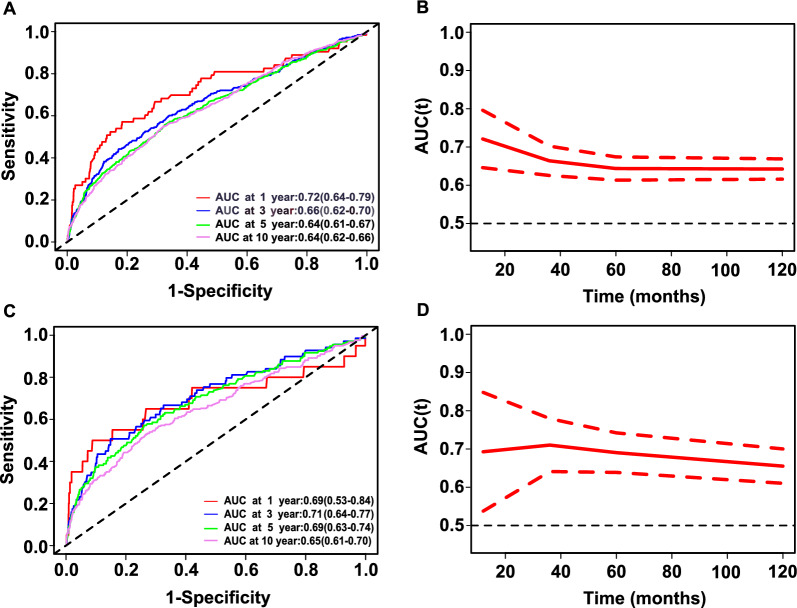
Results: During a median follow-up of 91 months (interquartile range, 55-131 months), 896 (27.5%) of the 3251 diabetes patients died, including 261 (8.0%) with cardiovascular deaths and 635 (19.5%) with noncardiovascular deaths. The RCS regression analysis showed a positive linear association between the NLR and all-cause and cardiovascular mortality (both p > 0.05 for nonlinearity) in diabetes patients. Participants were divided into higher (> 3.48) and lower (≤ 3.48) NLR groups according to the MSRSM. In the multivariable-adjusted model, compared with participants with a lower NLR, those with a higher NLR had a significantly higher risk of both all-cause (HR 2.03, 95% confidence interval (CI) 1.64-2.51, p < 0.0001) and cardiovascular mortality (HR 2.76, 95% CI 1.84-4.14, p < 0.0001). The association was consistent in subgroup analyses based on age, sex, smoking status, drinking status, and hypertension, with no significant interaction between the aforementioned characteristics and the NLR (p interaction > 0.05). The time-dependent ROC curve showed that the areas under the curve of the 1-, 3-, 5-, and 10-year survival rates were 0.72, 0.66, 0.64, and 0.64 for all-cause mortality and 0.69, 0.71, 0.69 and 0.65, respectively, for cardiovascular mortality.
Conclusion: An elevated NLR is independently associated with increased all-cause and cardiovascular mortality in diabetes patients.
Keywords: All-cause mortality; Cardiovascular mortality; Diabetes; Neutrophil lymphocyte ratio.
© 2023. BioMed Central Ltd., part of Springer Nature.
Conflict of interest statement
The authors declare no competing financial interests.
Figures
Similar articles
-
Neutrophil-lymphocyte ratio is a predictor for all-cause and cardiovascular mortality in individuals with prediabetes in a National study.Endocrine. 2025 Feb;87(2):589-598. doi: 10.1007/s12020-024-04075-w. Epub 2024 Oct 23. Endocrine. 2025. PMID: 39438396
-
The neutrophil-to-lymphocyte ratio is associated with all-cause and cardiovascular mortality among individuals with hypertension.Cardiovasc Diabetol. 2024 Apr 2;23(1):117. doi: 10.1186/s12933-024-02191-5. Cardiovasc Diabetol. 2024. PMID: 38566082 Free PMC article.
-
Association between neutrophil-lymphocyte ratio and all-cause and cardiovascular mortality in patients with diabetes or prediabetes with comorbid obstructive sleep apnea symptoms: evidence from NHANES 2005-2008 and 2015-2018.Front Endocrinol (Lausanne). 2025 Apr 22;16:1512621. doi: 10.3389/fendo.2025.1512621. eCollection 2025. Front Endocrinol (Lausanne). 2025. PMID: 40331136 Free PMC article.
-
Neutrophil-to-lymphocyte ratio as a predictor of all-cause and cardiovascular mortality in coronary heart disease and hypertensive patients: a retrospective cohort study.Front Endocrinol (Lausanne). 2024 Aug 21;15:1442165. doi: 10.3389/fendo.2024.1442165. eCollection 2024. Front Endocrinol (Lausanne). 2024. PMID: 39234507 Free PMC article.
-
The Neutrophil-to-Lymphocyte Ratio Predicts Cardiovascular Outcomes in Patients With Diabetes: A Systematic Review and Meta-Analysis.Cardiol Rev. 2025 May-Jun 01;33(3):202-211. doi: 10.1097/CRD.0000000000000820. Epub 2024 Nov 12. Cardiol Rev. 2025. PMID: 39531515
Cited by
-
The associations of physical activity patterns and the triglyceride-glucose index in US adults: a secondary data analysis of NHANES (2007-2018).Sci Rep. 2025 Jan 18;15(1):2375. doi: 10.1038/s41598-025-86278-3. Sci Rep. 2025. PMID: 39827230 Free PMC article.
-
Predictive value of the non-high-density lipoprotein cholesterol to high-density lipoprotein cholesterol ratio (NHHR) for all-cause and cardiovascular mortality with non-hyperhomocysteinemia: evidence from NHANES 1999 to 2006.Front Nutr. 2025 May 20;12:1586558. doi: 10.3389/fnut.2025.1586558. eCollection 2025. Front Nutr. 2025. PMID: 40463467 Free PMC article.
-
Altered albumin/neutrophil to lymphocyte ratio are associated with all-cause and cardiovascular mortality for advanced cardiovascular-kidney-metabolic syndrome.Front Nutr. 2025 Jul 16;12:1595119. doi: 10.3389/fnut.2025.1595119. eCollection 2025. Front Nutr. 2025. PMID: 40740647 Free PMC article.
-
Systemic Immune-Inflammation Index (SII) of Patients With and Without Diabetic Neuropathy: A Cross-Sectional Study.Cureus. 2025 Jul 12;17(7):e87759. doi: 10.7759/cureus.87759. eCollection 2025 Jul. Cureus. 2025. PMID: 40792338 Free PMC article.
-
Gender differences in the relationship between the systemic immune-inflammation index and all-cause and cardiovascular mortality among adults with hypertension: evidence from NHANES 1999-2018.Front Endocrinol (Lausanne). 2024 Oct 8;15:1436999. doi: 10.3389/fendo.2024.1436999. eCollection 2024. Front Endocrinol (Lausanne). 2024. PMID: 39439560 Free PMC article.
References
MeSH terms
LinkOut - more resources
Full Text Sources
Medical
