

Assessing changes in incubation period, serial interval, and generation time of SARS-CoV-2 variants of concern: a systematic review and meta-analysis
- PMID: 37775772
- PMCID: PMC10541713
- DOI: 10.1186/s12916-023-03070-8
Assessing changes in incubation period, serial interval, and generation time of SARS-CoV-2 variants of concern: a systematic review and meta-analysis
Abstract
Background: After the first COVID-19 wave caused by the ancestral lineage, the pandemic has been fueled from the continuous emergence of new SARS-CoV-2 variants. Understanding key time-to-event periods for each emerging variant of concern is critical as it can provide insights into the future trajectory of the virus and help inform outbreak preparedness and response planning. Here, we aim to examine how the incubation period, serial interval, and generation time have changed from the ancestral SARS-CoV-2 lineage to different variants of concern.
Methods: We conducted a systematic review and meta-analysis that synthesized the estimates of incubation period, serial interval, and generation time (both realized and intrinsic) for the ancestral lineage, Alpha, Beta, and Omicron variants of SARS-CoV-2.
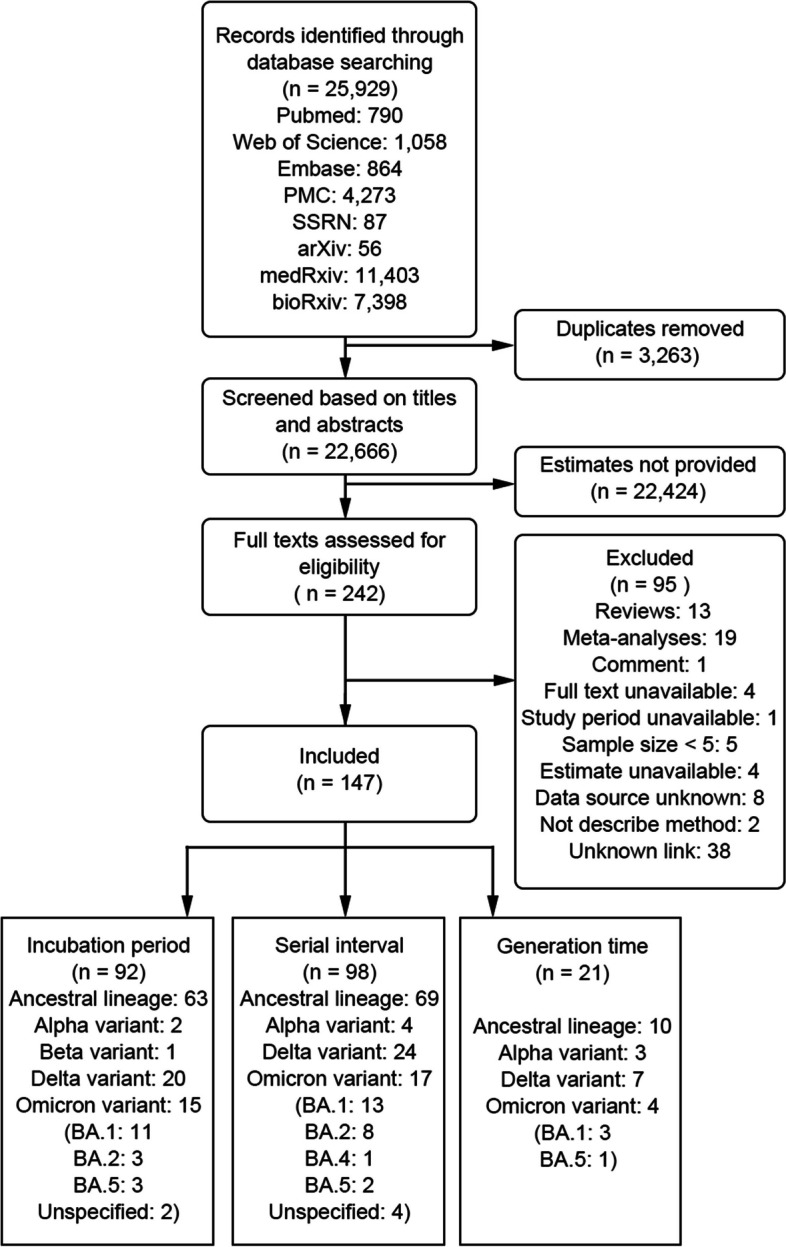
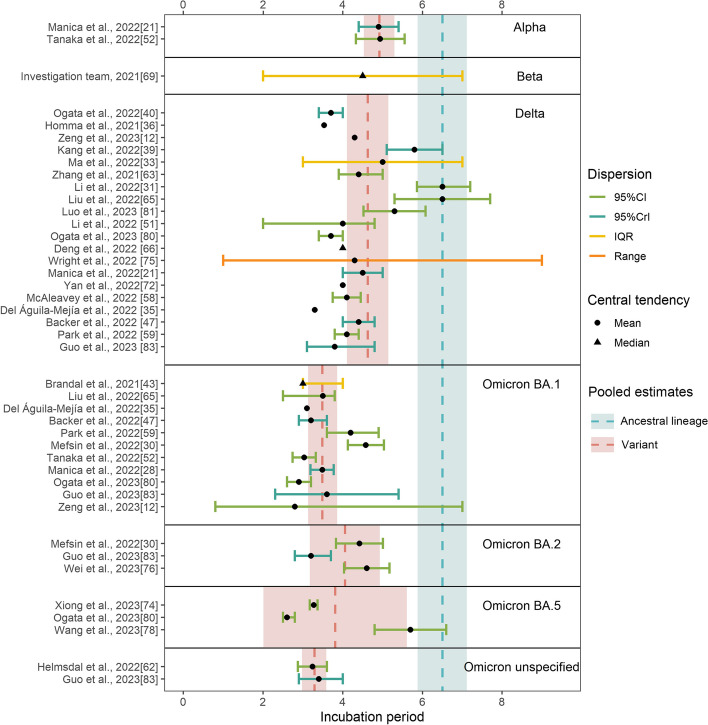
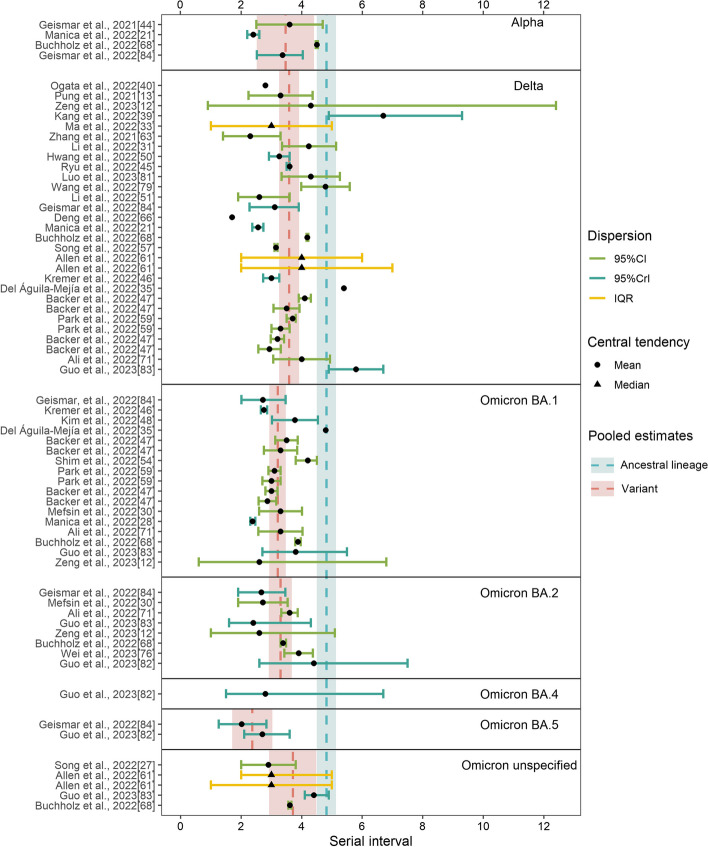
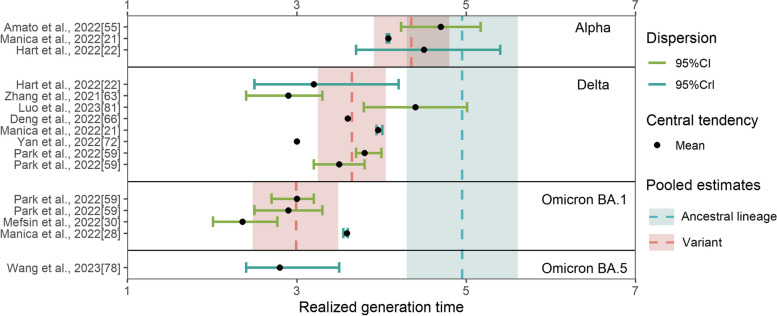
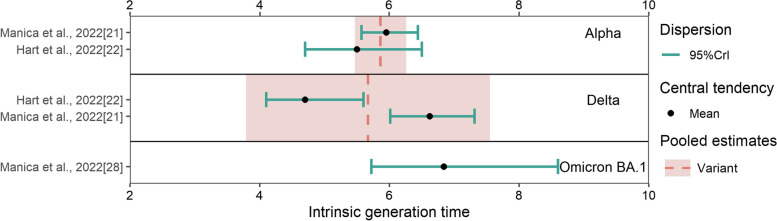
Results: Our study included 280 records obtained from 147 household studies, contact tracing studies, or studies where epidemiological links were known. With each emerging variant, we found a progressive shortening of each of the analyzed key time-to-event periods, although we did not find statistically significant differences between the Omicron subvariants. We found that Omicron BA.1 had the shortest pooled estimates for the incubation period (3.49 days, 95% CI: 3.13-4.86 days), Omicron BA.5 for the serial interval (2.37 days, 95% CI: 1.71-3.04 days), and Omicron BA.1 for the realized generation time (2.99 days, 95% CI: 2.48-3.49 days). Only one estimate for the intrinsic generation time was available for Omicron subvariants: 6.84 days (95% CrI: 5.72-8.60 days) for Omicron BA.1. The ancestral lineage had the highest pooled estimates for each investigated key time-to-event period. We also observed shorter pooled estimates for the serial interval compared to the incubation period across the virus lineages. When pooling the estimates across different virus lineages, we found considerable heterogeneities (I2 > 80%; I2 refers to the percentage of total variation across studies that is due to heterogeneity rather than chance), possibly resulting from heterogeneities between the different study populations (e.g., deployed interventions, social behavior, demographic characteristics).
Conclusions: Our study supports the importance of conducting contact tracing and epidemiological investigations to monitor changes in SARS-CoV-2 transmission patterns. Our findings highlight a progressive shortening of the incubation period, serial interval, and generation time, which can lead to epidemics that spread faster, with larger peak incidence, and harder to control. We also consistently found a shorter serial interval than incubation period, suggesting that a key feature of SARS-CoV-2 is the potential for pre-symptomatic transmission. These observations are instrumental to plan for future COVID-19 waves.
Keywords: COVID-19; Incubation period; Intrinsic generation time; Meta-analysis; Realized generation time; Serial interval; Systematic review; Variants of concern.
© 2023. BioMed Central Ltd., part of Springer Nature.
Conflict of interest statement
HY has received research funding from Sanofi Pasteur, GlaxoSmithKline, Yichang HEC Changjiang Pharmaceutical Company, Shanghai Roche Pharmaceutical Company, and SINOVAC Biotech Ltd. MA has received research funding from Seqirus. None of those funding is related to this research. All other authors report no competing interests.
Figures
Similar articles
-
Rapid review and meta-analysis of serial intervals for SARS-CoV-2 Delta and Omicron variants.BMC Infect Dis. 2023 Jun 26;23(1):429. doi: 10.1186/s12879-023-08407-5. BMC Infect Dis. 2023. PMID: 37365505 Free PMC article. Review.
-
Emerging Variants of SARS-CoV-2 and Novel Therapeutics Against Coronavirus (COVID-19).2023 May 8. In: StatPearls [Internet]. Treasure Island (FL): StatPearls Publishing; 2025 Jan–. 2023 May 8. In: StatPearls [Internet]. Treasure Island (FL): StatPearls Publishing; 2025 Jan–. PMID: 34033342 Free Books & Documents.
-
Replacement dynamics and the pathogenesis of the Alpha, Delta and Omicron variants of SARS-CoV-2.Epidemiol Infect. 2022 Dec 20;151:e32. doi: 10.1017/S0950268822001935. Epidemiol Infect. 2022. PMID: 36535802 Free PMC article.
-
Transmission Characteristics and Inactivated Vaccine Effectiveness Against Transmission of SARS-CoV-2 Omicron BA.5 Variants in Urumqi, China.JAMA Netw Open. 2023 Mar 1;6(3):e235755. doi: 10.1001/jamanetworkopen.2023.5755. JAMA Netw Open. 2023. PMID: 36995713 Free PMC article.
-
Incubation Period of COVID-19 Caused by Unique SARS-CoV-2 Strains: A Systematic Review and Meta-analysis.JAMA Netw Open. 2022 Aug 1;5(8):e2228008. doi: 10.1001/jamanetworkopen.2022.28008. JAMA Netw Open. 2022. PMID: 35994285 Free PMC article.
Cited by
-
Impact of COVID-19 on adverse reactions to subcutaneous specific immunotherapy in children:a retrospective cohort study.BMC Infect Dis. 2024 Aug 7;24(1):794. doi: 10.1186/s12879-024-09702-5. BMC Infect Dis. 2024. PMID: 39112970 Free PMC article.
-
Burden of Acute Respiratory Infections Caused by Influenza Virus, Respiratory Syncytial Virus, and SARS-CoV-2 with Consideration of Older Adults: A Narrative Review.Infect Dis Ther. 2025 Jan;14(Suppl 1):5-37. doi: 10.1007/s40121-024-01080-4. Epub 2024 Dec 30. Infect Dis Ther. 2025. PMID: 39739200 Free PMC article. Review.
-
Near-source wastewater surveillance of SARS-CoV-2, norovirus, influenza virus and RSV across five different sites in the UK.PLOS Glob Public Health. 2025 Apr 9;5(4):e0004397. doi: 10.1371/journal.pgph.0004397. eCollection 2025. PLOS Glob Public Health. 2025. PMID: 40202943 Free PMC article.
-
A T-Cell-Derived 3-Gene Signature Distinguishes SARS-CoV-2 from Common Respiratory Viruses.Viruses. 2024 Jun 26;16(7):1029. doi: 10.3390/v16071029. Viruses. 2024. PMID: 39066192 Free PMC article.
-
Dynamic causal models in infectious disease epidemiology-an assessment of their predictive validity based on the COVID-19 epidemic in the UK 2020 to 2024.Front Public Health. 2025 May 2;13:1573783. doi: 10.3389/fpubh.2025.1573783. eCollection 2025. Front Public Health. 2025. PMID: 40385629 Free PMC article.
References
-
- WHO Coronavirus (COVID-19) Dashboard. https://covid19.who.int/. Accessed 20 April 2023.
-
- Tracking SARS-CoV-2 variants. https://www.who.int/activities/tracking-SARS-CoV-2-variants/. Accessed 20 April 2023.
-
- Aleem A, Akbar Samad AB, Vaqar S. Emerging Variants of SARS-CoV-2 And Novel Therapeutics Against Coronavirus (COVID-19) Treasure Island: StatPearls Publishing; 2023. - PubMed
Publication types
MeSH terms
Supplementary concepts
LinkOut - more resources
Full Text Sources
Medical
Miscellaneous
