

CD73 mediates the therapeutic effects of endometrial regenerative cells in concanavalin A-induced hepatitis by regulating CD4+ T cells
- PMID: 37775797
- PMCID: PMC10543328
- DOI: 10.1186/s13287-023-03505-2
CD73 mediates the therapeutic effects of endometrial regenerative cells in concanavalin A-induced hepatitis by regulating CD4+ T cells
Abstract
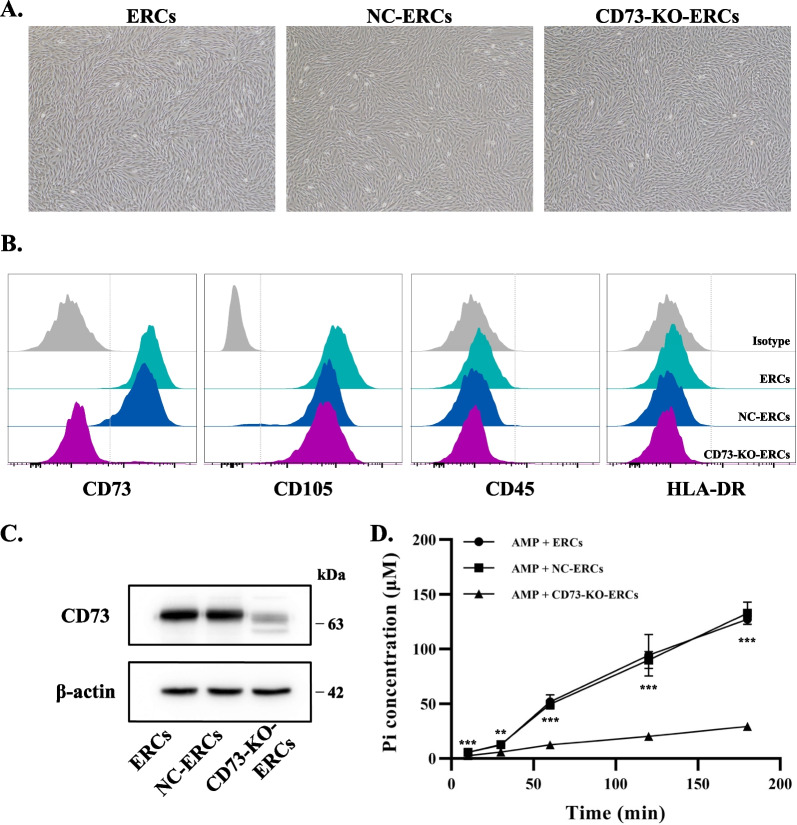
Background: As a kind of mesenchymal-like stromal cells, endometrial regenerative cells (ERCs) have been demonstrated effective in the treatment of Concanavalin A (Con A)-induced hepatitis. However, the therapeutic mechanism of ERCs is not fully understood. Ecto-5`-nucleotidase (CD73), an enzyme that could convert immune-stimulative adenosine monophosphate (AMP) to immune-suppressive adenosine (ADO), was identified highly expressed on ERCs. The present study was conducted to investigate whether the expression of CD73 on ERCs is critical for its therapeutic effects in Con A-induced hepatitis.
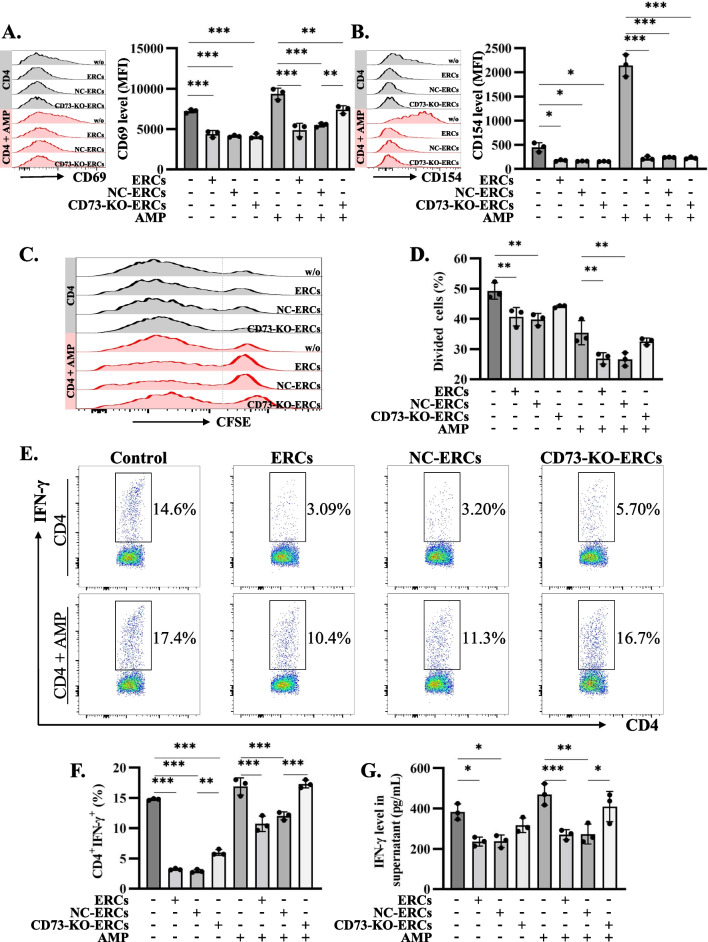
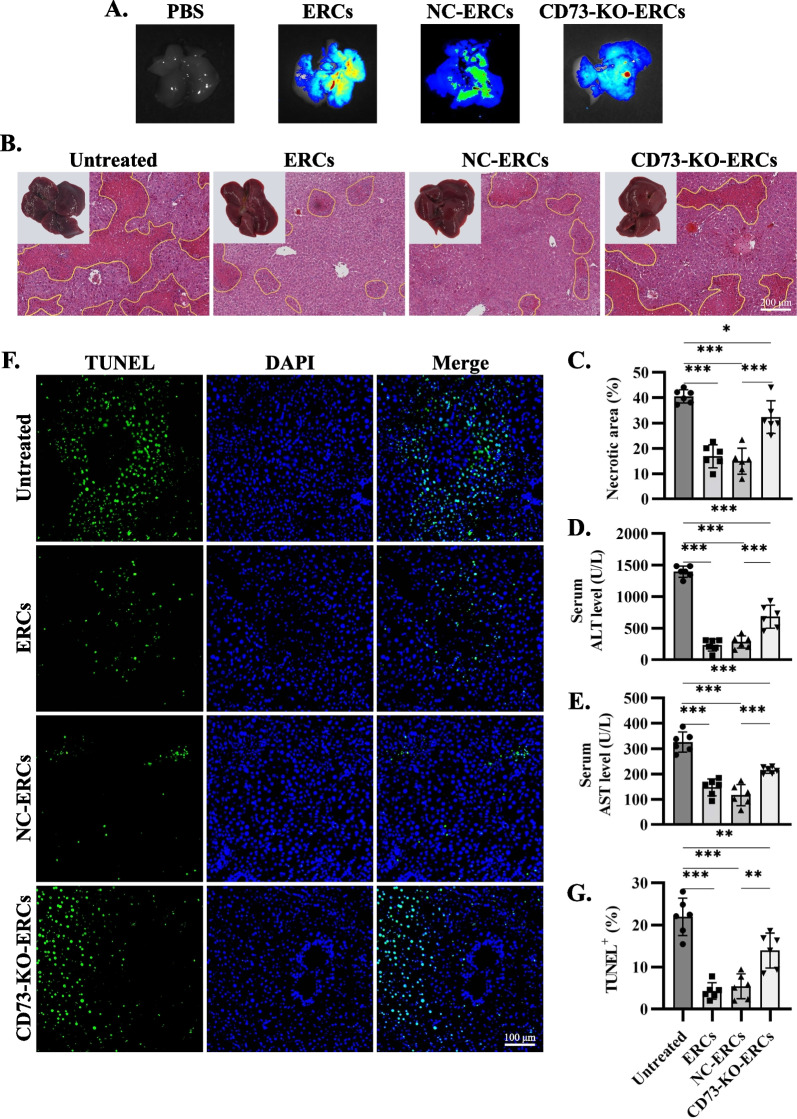
Methods: ERCs knocking out CD73 were generated with lentivirus-mediated CRISPR-Cas9 technology and identified by flow cytometry, western blot and AMPase activity assay. CD73-mediated immunomodulatory effects of ERCs were investigated by CD4+ T cell co-culture assay in vitro. Besides, Con A-induced hepatitis mice were randomly assigned to the phosphate-buffered saline treated (untreated), ERC-treated, negative lentiviral control ERC (NC-ERC)-treated, and CD73-knockout-ERC (CD73-KO-ERC)-treated groups, and used to assess the CD73-mediated therapeutic efficiency of ERCs. Hepatic histopathological analysis, serum transaminase concentrations, and the proportion of CD4+ T cell subsets in the liver and spleen were performed to assess the progression degree of hepatitis.
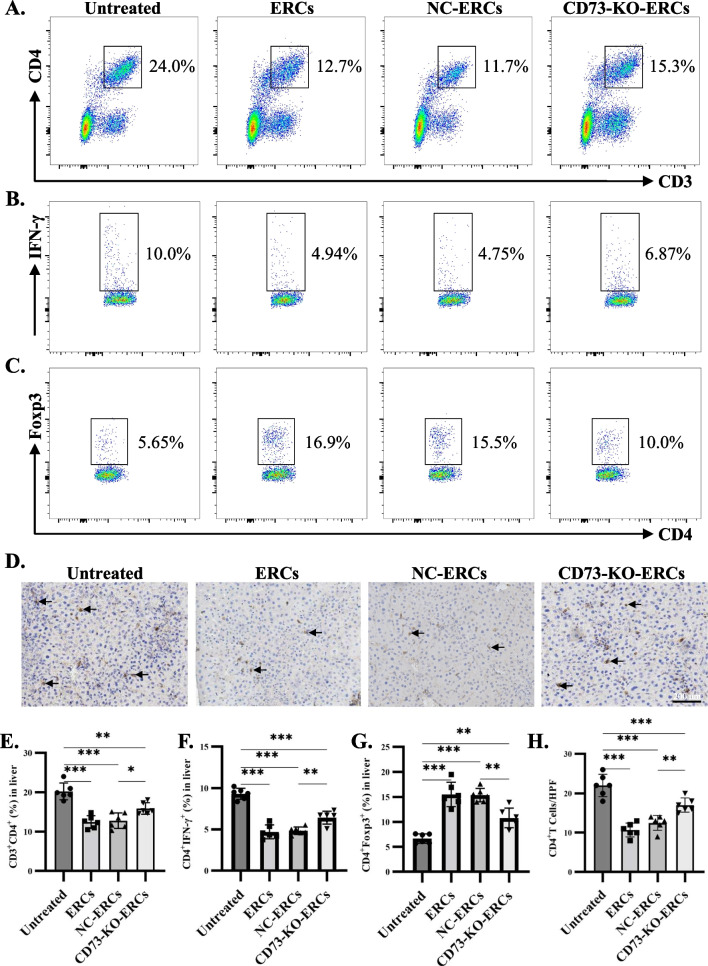
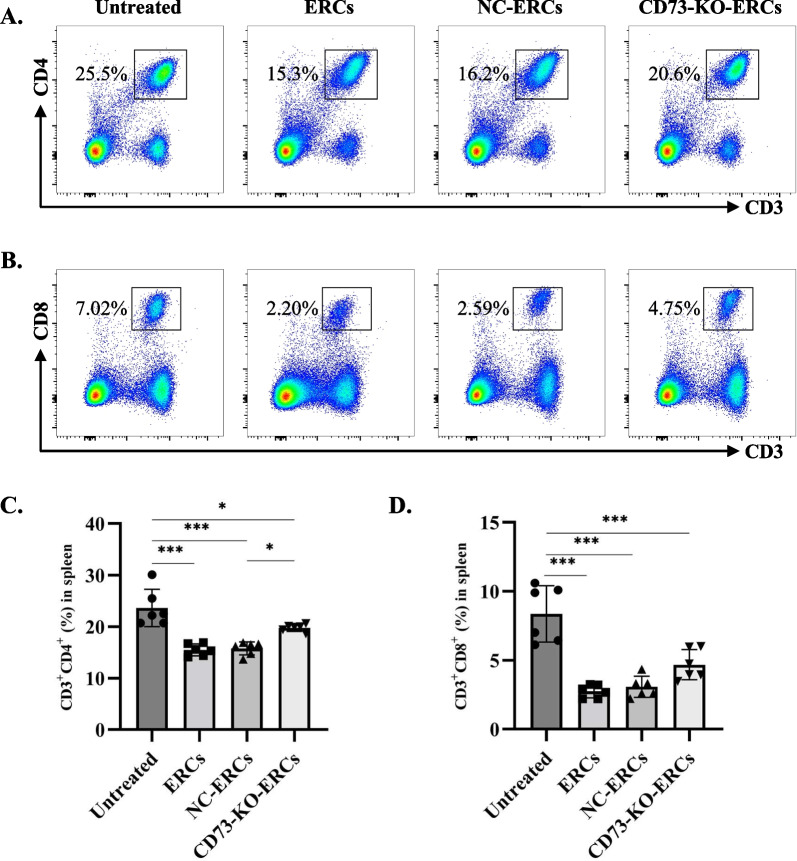
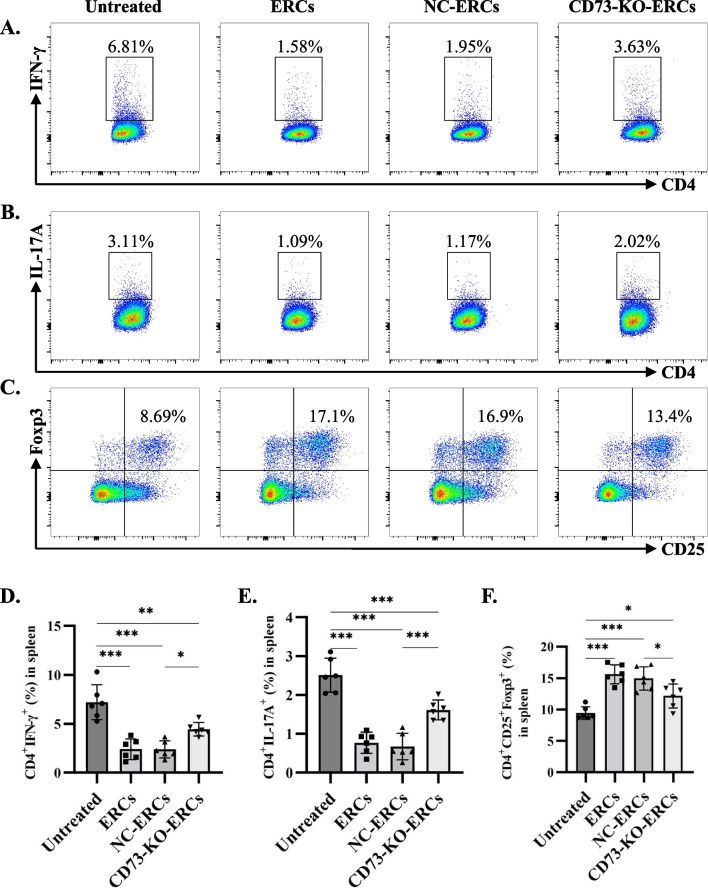
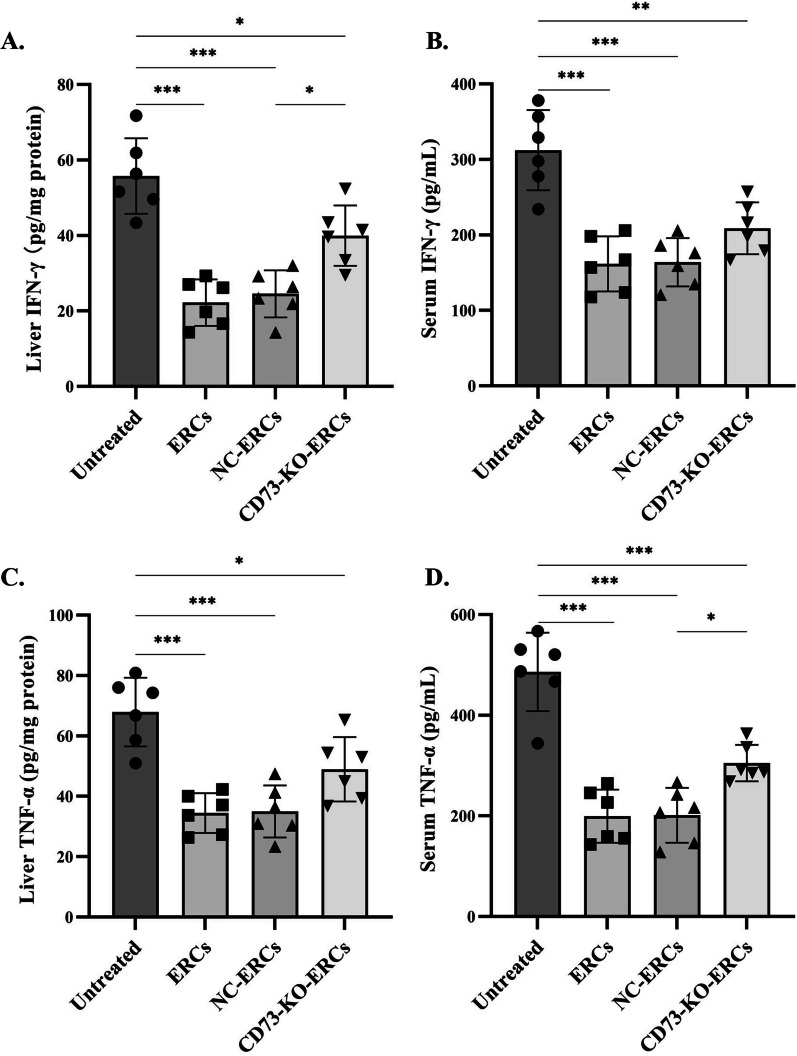
Results: Expression of CD73 on ERCs could effectively metabolize AMP to ADO, thereby inhibiting the activation and function of conventional CD4+ T cells was identified in vitro. In addition, ERCs could markedly reduce levels of serum and liver transaminase and attenuate liver damage, while the deletion of CD73 on ERCs dampens these effects. Furthermore, ERC-based treatment achieved less infiltration of CD4+ T and Th1 cells in the liver and reduced the population of systemic Th1 and Th17 cells and the levels of pro-inflammatory cytokines such as IFN-γ and TNF-α, while promoting the generation of Tregs in the liver and spleen, while deletion of CD73 on ERCs significantly impaired their immunomodulatory effects locally and systemically.
Conclusion: Taken together, it is concluded that CD73 is critical for the therapeutic efficiency of ERCs in the treatment of Con A-induced hepatitis.
Keywords: CD4+ T cell; CD73; Concanavalin A-induced hepatitis; Endometrial regenerative cells; Mice.
© 2023. BioMed Central Ltd., part of Springer Nature.
Conflict of interest statement
The authors declare that they have no competing interests.
Figures
Similar articles
-
CD73-expressing endometrial regenerative cell-derived exosomes mitigate acute cardiac allograft rejection through regulating adenosine metabolism in mice.Stem Cell Res Ther. 2025 Jun 2;16(1):277. doi: 10.1186/s13287-025-04398-z. Stem Cell Res Ther. 2025. PMID: 40457389 Free PMC article.
-
Endometrial regenerative cells with galectin-9 high-expression attenuate experimental autoimmune hepatitis.Stem Cell Res Ther. 2021 Oct 15;12(1):541. doi: 10.1186/s13287-021-02604-2. Stem Cell Res Ther. 2021. PMID: 34654474 Free PMC article.
-
IL-37 overexpression enhances the therapeutic effect of endometrial regenerative cells in concanavalin A-induced hepatitis.Cytotherapy. 2021 Jul;23(7):617-626. doi: 10.1016/j.jcyt.2020.12.006. Epub 2021 Feb 13. Cytotherapy. 2021. PMID: 33593687
-
CD73 mediated host purinergic metabolism in intestine contributes to the therapeutic efficacy of a novel mesenchymal-like endometrial regenerative cells against experimental colitis.Front Immunol. 2023 Apr 25;14:1155090. doi: 10.3389/fimmu.2023.1155090. eCollection 2023. Front Immunol. 2023. PMID: 37180168 Free PMC article.
-
CD73 expression is critical to therapeutic effects of human endometrial regenerative cells in inhibition of cardiac allograft rejection in mice.Stem Cells Transl Med. 2021 Mar;10(3):465-478. doi: 10.1002/sctm.20-0154. Epub 2020 Oct 30. Stem Cells Transl Med. 2021. PMID: 33124777 Free PMC article.
Cited by
-
Endometrial regeneration cell-derived exosomes loaded with siSLAMF6 inhibit cardiac allograft rejection through the suppression of desialylation modification.Cell Mol Biol Lett. 2024 Oct 1;29(1):128. doi: 10.1186/s11658-024-00645-y. Cell Mol Biol Lett. 2024. PMID: 39354345 Free PMC article.
-
CD73-expressing endometrial regenerative cell-derived exosomes mitigate acute cardiac allograft rejection through regulating adenosine metabolism in mice.Stem Cell Res Ther. 2025 Jun 2;16(1):277. doi: 10.1186/s13287-025-04398-z. Stem Cell Res Ther. 2025. PMID: 40457389 Free PMC article.
References
-
- Mieli-Vergani G, Vergani D, Czaja AJ, Manns MP, Krawitt EL, Vierling JM, Lohse AW, Montano-Loza AJ. Autoimmune hepatitis. Nat Rev Dis Primers. 2018;4:18018. - PubMed
-
- Volarevic V, et al. Protective role of IL-33/ST2 axis in Con A-induced hepatitis. J Hepatol. 2012;56(1):26–33. - PubMed
-
- Cekic C, Linden J. Purinergic regulation of the immune system. Nat Rev Immunol. 2016;16(3):177–192. - PubMed
Publication types
MeSH terms
Substances
LinkOut - more resources
Full Text Sources
Medical
Research Materials
