Observational Study
. 2024 Mar 1;18(3):431-445.
doi: 10.1093/ecco-jcc/jjad166.

Baseline Expression of Immune Gene Modules in Blood is Associated With Primary Response to Anti-TNF Therapy in Crohn's Disease Patients

Collaborators, Affiliations
Observational Study

Baseline Expression of Immune Gene Modules in Blood is Associated With Primary Response to Anti-TNF Therapy in Crohn's Disease Patients

Benjamin Y H Bai et al. J Crohns Colitis. .

Abstract

Background and aims: Anti-tumour necrosis factor [anti-TNF] therapy is widely used for the treatment of inflammatory bowel disease, yet many patients are primary non-responders, failing to respond to induction therapy. We aimed to identify blood gene expression differences between primary responders and primary non-responders to anti-TNF monoclonal antibodies [infliximab and adalimumab], and to predict response status from blood gene expression and clinical data.

Methods: The Personalised Anti-TNF Therapy in Crohn's Disease [PANTS] study is a UK-wide prospective observational cohort study of anti-TNF therapy outcome in anti-TNF-naive Crohn's disease patients [ClinicalTrials.gov identifier: NCT03088449]. Blood gene expression in 324 unique patients was measured by RNA-sequencing at baseline [week 0], and at weeks 14, 30, and 54 after treatment initiation [total sample size = 814].

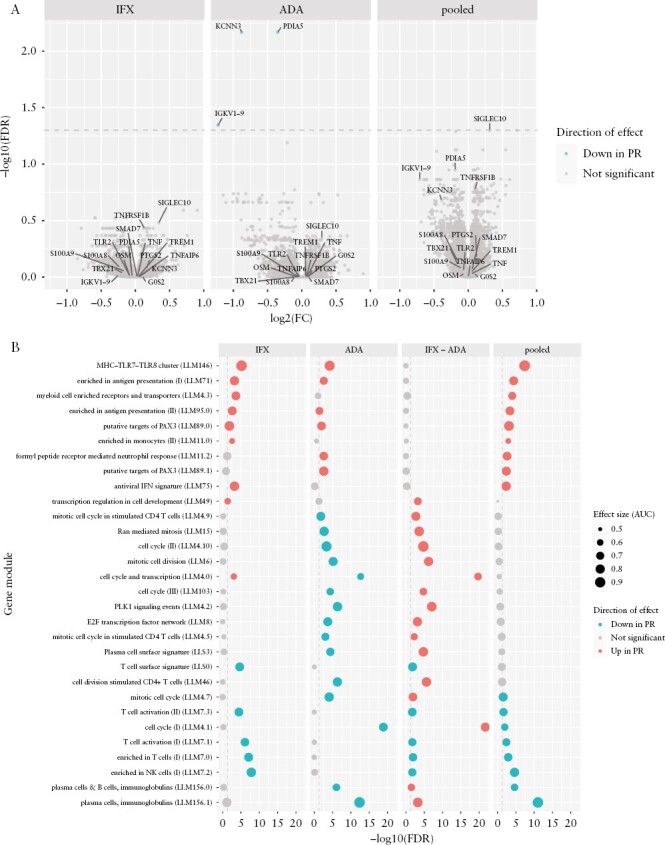
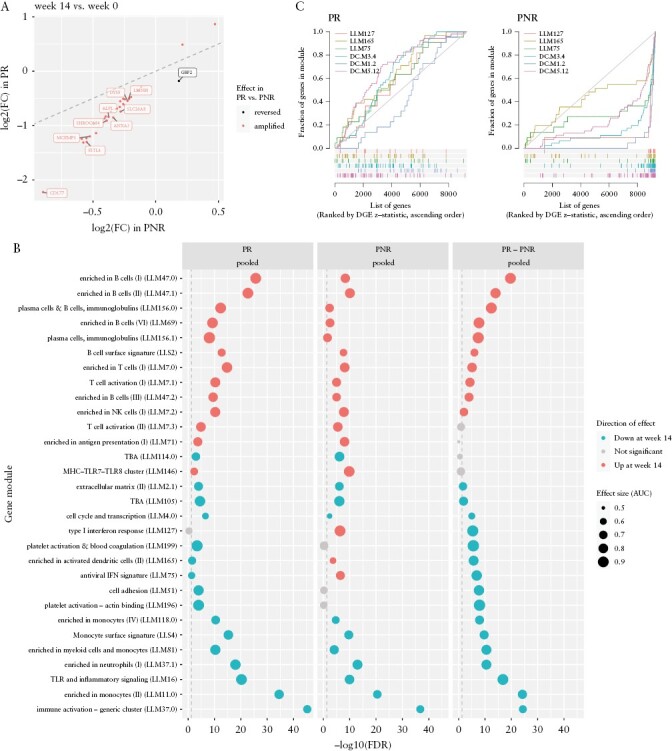
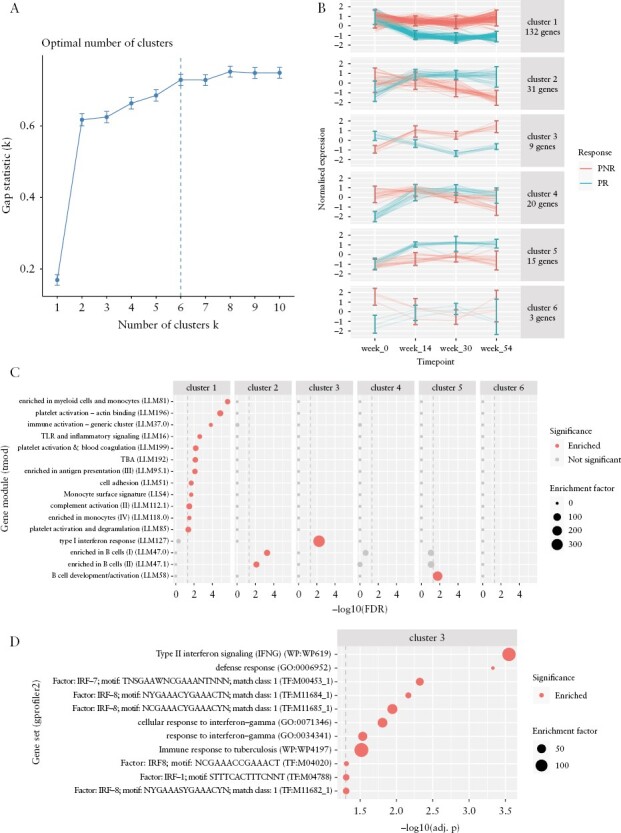
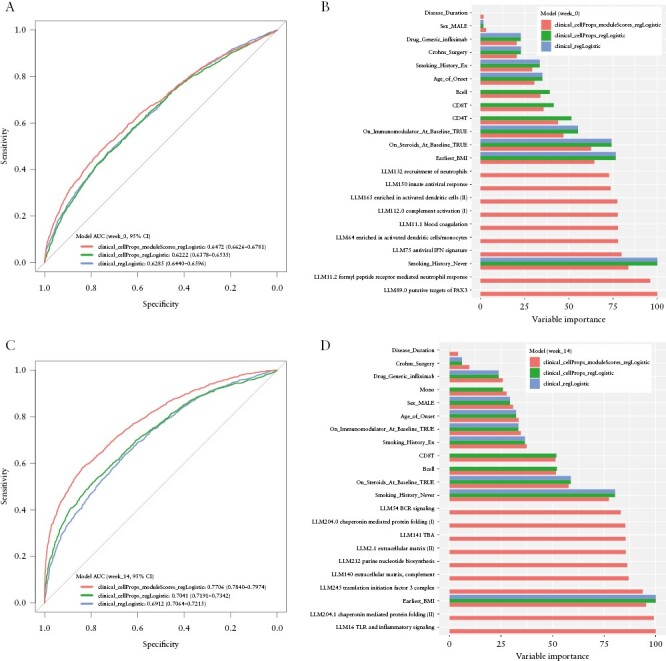
Results: After adjusting for clinical covariates and estimated blood cell composition, baseline expression of major histocompatibility complex, antigen presentation, myeloid cell enriched receptor, and other innate immune gene modules was significantly higher in anti-TNF responders vs non-responders. Expression changes from baseline to week 14 were generally of consistent direction but greater magnitude [i.e. amplified] in responders, but interferon-related genes were upregulated uniquely in non-responders. Expression differences between responders and non-responders observed at week 14 were maintained at weeks 30 and 54. Prediction of response status from baseline clinical data, cell composition, and module expression was poor.

Conclusions: Baseline gene module expression was associated with primary response to anti-TNF therapy in PANTS patients. However, these baseline expression differences did not predict response with sufficient sensitivity for clinical use.

Keywords: Anti-TNF; Crohn’s disease; transcriptomic biomarkers.


Conflict of interest statement

Mark Reppell, Nizar Smaoui, Jeffrey F. Waring, Valerie Pivorunas, and Heath Guay are employees of AbbVie and may own stock and/or options. Simeng Lin reports non-financial support from Pfizer outside the submitted work. James R. Goodhand reports grants from F. Hoffmann-La Roche AG, grants from Biogen Inc, grants from Celltrion Healthcare, grants from Galapagos NV, and non-financial support from Immundiagnostik outside the conduct of the study. Nicholas A. Kennedy reports grants from F. Hoffmann-La Roche AG, grants from Biogen Inc, grants from Celltrion Healthcare, grants from Galapagos NV, and non-financial support from Immundiagnostik; grants and non-financial support from AbbVie, grants and personal fees from Celltrion, personal fees and non-financial support from Janssen, personal fees from Takeda, and personal fees and non-financial support from Dr Falk, outside the submitted work. Tariq Ahmad reports grants and non-financial support from F. Hoffmann-La Roche AG, grants from Biogen Inc, grants from Celltrion Healthcare, grants from Galapagos NV, and non-financial support from Immundiagnostik; personal fees from Biogen Inc, grants and personal fees from Celltrion Healthcare, personal fees and non-financial support from Immundiagnostik, personal fees from Takeda, personal fees from ARENA, personal fees from Gilead, personal fees from Adcock Ingram Healthcare, personal fees from Pfizer, personal fees from Genentech, and non-financial support from Tillotts, outside the submitted work. Carl A. Anderson has received consultancy or lectureship fees from Genomics plc, BridgeBio, and GSK. The remaining authors have no conflicts of interest to report.

Figures

Figure 1.
Figure 1.
Baseline expression associated with primary response. [A] Volcano plots of differential gene expression between responders [PR] and non-responders [PNR] at week 0: for infliximab [IFX], adalimumab [ADA], or with drug subgroups pooled. Annotated genes show significant associations from this study and previously reported associations from the literature in both blood and gut biopsies. Dashed line shows significance threshold at FDR = 0.05. [B] Top gene modules differentially expressed between PR and PNR at week 0. Columns correspond to results for IFX, ADA, difference between IFX and ADA [IFX − ADA, i.e. the drug-by-response interaction], and pooled drug analyses. The top 30 modules ranked by minimum FDR in any column are shown. Dashed lines show significance thresholds at FDR = 0.05.
Figure 2.
Figure 2.
Expression changes from baseline to post-induction in responders and non-responders. [A] Expression log2 fold changes from week 0 to week 14 in primary responders [PR] and non-responders [PNR], for genes that were differentially expressed from week 0 to week 14 in both responders and non-responders, with a significantly different effect size between responders and non-responders [top ten labelled]. The identity line is shown by the dashed line. [B] Top modules differentially expressed between week 14 and week 0. Columns show effects in PR, PNR, and the PR minus PNR difference [the timepoint-by-response interaction]. The top 30 modules ranked by minimum FDR in any column are shown. Vertical dashed line shows significance threshold at FDR = 0.05. [C] Barcode plots showing interferon modules upregulated from week 0 to week 14 in PNR, but not in PR. Genes are ranked in ascending order by week 14 vs week 0 DGE z-statistic, with coloured bars indicating the rank of genes in a module. Curves show the cumulative fraction of genes in a module at a particular rank threshold. The area under the curve [AUC] reflects the effect size of the module association. Diagonal line shows the null of randomly distributed ranks. Modules sourced from Li et al. [prefixed ‘LI’] and Chaussabel et al. [prefixed ‘DC’].
Figure 3.
Figure 3.
Expression differences between responders [PR] and non-responders [PNR] during maintenance. [A] Gap statistic vs cluster number k from hierarchical clustering of genes with significant expression differences between PR and PNR over all timepoints. Error bars derived from 500 bootstraps. The optimal cluster number was selected to be k = 6 by the factoextra::fviz_nbclust firstSEmax criteria [https://rpkgs.datanovia.com/factoextra/index.html]. [B] Normalized expression over study timepoints for genes in each cluster; 95% confidence intervals for expression are shown for each group at each timepoint. [C] Gene modules enriched in each cluster from gene set overrepresentation analyses. Modules significantly enriched in any cluster are shown. Vertical dashed line shows significance threshold at FDR = 0.05. [D] Gene sets enriched in cluster 3 from gene set overrepresentation analyses using gprofiler2::gost. Vertical dashed line shows significance threshold at an adjusted p-value = 0.05 [gost g:SCS multiple testing correction method].
Figure 4.
Figure 4.
Prediction of response status from clinical variables, cell proportions, and expression data. Receiver operating characteristic [ROC] curves for the caret regLogistic method trained on each predictor dataset are shown at baseline [A] and week 14 [C]. ROC curves were plotted after merging all 50 resamples. Primary non-response was used as the positive class. DeLong 95% confidence intervals for the AUC are shown. The ten most important variables from models trained on each predictor dataset are shown for baseline [B] and week 14 [D] models. The overall variable importance score is computed from the absolute value of the t-statistic for each predictor from the final tuned models. Missing bars denote variables that were not in the predictor dataset for that model.

References

    1. Adegbola SO, Sahnan K, Warusavitarne J, Hart A, Tozer P.. Anti-TNF therapy in Crohn’s disease. Int J Mol Sci 2018;19:2244. doi:10.3390/ijms19082244. - DOI - PMC - PubMed
    1. Lichtenstein GR. Comprehensive review: antitumor necrosis factor agents in inflammatory bowel disease and factors implicated in treatment response. Therap Adv Gastroenterol 2013;6:269–93. doi:10.1177/1756283X13479826. - DOI - PMC - PubMed
    1. Neurath MF. New targets for mucosal healing and therapy in inflammatory bowel diseases. Mucosal Immunol 2014;7:6–19. doi:10.1038/mi.2013.73. - DOI - PubMed
    1. Levin AD, Wildenberg ME, van den Brink GR.. Mechanism of action of anti-TNF therapy in inflammatory bowel disease. J Crohns Colitis 2016;10:989–97. doi:10.1093/ecco-jcc/jjw053. - DOI - PubMed
    1. Roda G, Jharap B, Neeraj N, Colombel J-F.. Loss of response to anti-TNFs: Definition, epidemiology, and management. Clin Transl Gastroenterol 2016;7:e135. doi:10.1038/ctg.2015.63. - DOI - PMC - PubMed

Publication types

Substances

Associated data