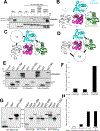
Fusion crystallization reveals the behavior of both the 1TEL crystallization chaperone and the TNK1 UBA domain
- PMID: 37776857
- PMCID: PMC10843481
- DOI: 10.1016/j.str.2023.09.001
Fusion crystallization reveals the behavior of both the 1TEL crystallization chaperone and the TNK1 UBA domain
Abstract
Human thirty-eight-negative kinase-1 (TNK1) is implicated in cancer progression. The TNK1 ubiquitin-associated (UBA) domain binds polyubiquitin and plays a regulatory role in TNK1 activity and stability. No experimentally determined molecular structure of this unusual UBA domain is available. We fused the UBA domain to the 1TEL variant of the translocation ETS leukemia protein sterile alpha motif (TELSAM) crystallization chaperone and obtained crystals diffracting as far as 1.53 Å. GG and GSGG linkers allowed the UBA to reproducibly find a productive binding mode against its host 1TEL polymer and crystallize at protein concentrations as low as 0.2 mg/mL. Our studies support a mechanism of 1TEL fusion crystallization and show that 1TEL fusion crystals require fewer crystal contacts than traditional protein crystals. Modeling and experimental validation suggest the UBA domain may be selective for both the length and linkages of polyubiquitin chains.
Keywords: 1TEL; AlphaFold2-Multimer; ETV6; SAM domain; TELSAM; TNK1; UBA; X-Ray Crystallography; crystallization chaperone; polyubiquitin binding.
Copyright © 2023 The Author(s). Published by Elsevier Ltd.. All rights reserved.
Conflict of interest statement
Declaration of interests The authors declare no competing interests.
Figures


Update of
-
Fusion crystallization reveals the behavior of both the 1TEL crystallization chaperone and the TNK1 UBA domain.bioRxiv [Preprint]. 2023 Jun 14:2023.06.14.544429. doi: 10.1101/2023.06.14.544429. bioRxiv. 2023. Update in: Structure. 2023 Dec 7;31(12):1589-1603.e6. doi: 10.1016/j.str.2023.09.001. PMID: 37398013 Free PMC article. Updated. Preprint.
Similar articles
-
Fusion crystallization reveals the behavior of both the 1TEL crystallization chaperone and the TNK1 UBA domain.bioRxiv [Preprint]. 2023 Jun 14:2023.06.14.544429. doi: 10.1101/2023.06.14.544429. bioRxiv. 2023. Update in: Structure. 2023 Dec 7;31(12):1589-1603.e6. doi: 10.1016/j.str.2023.09.001. PMID: 37398013 Free PMC article. Updated. Preprint.
-
Increasing the bulk of the 1TEL-target linker and retaining the 10×His tag in a 1TEL-CMG2-vWa construct improves crystal order and diffraction limits.Acta Crystallogr D Struct Biol. 2023 Oct 1;79(Pt 10):925-943. doi: 10.1107/S2059798323007246. Epub 2023 Sep 25. Acta Crystallogr D Struct Biol. 2023. PMID: 37747038 Free PMC article.
-
Crystals of TELSAM-target protein fusions that exhibit minimal crystal contacts and lack direct inter-TELSAM contacts.Open Biol. 2022 Mar;12(3):210271. doi: 10.1098/rsob.210271. Epub 2022 Mar 2. Open Biol. 2022. PMID: 35232248 Free PMC article.
-
Structural and functional studies of mutations affecting the UBA domain of SQSTM1 (p62) which cause Paget's disease of bone.Biochem Soc Trans. 2004 Nov;32(Pt 5):728-30. doi: 10.1042/BST0320728. Biochem Soc Trans. 2004. PMID: 15493999 Review.
-
Tnk1/Kos1: a novel tumor suppressor.Trans Am Clin Climatol Assoc. 2010;121:281-92; discussion 292-3. Trans Am Clin Climatol Assoc. 2010. PMID: 20697568 Free PMC article. Review.
Cited by
-
Preparing for successful protein crystallization experiments.Acta Crystallogr F Struct Biol Commun. 2025 Jul 1;81(Pt 7):272-280. doi: 10.1107/S2053230X25004650. Epub 2025 Jun 2. Acta Crystallogr F Struct Biol Commun. 2025. PMID: 40454464 Free PMC article.
References
-
- Hoehn GT, Stokland T, Amin S, Ramírez M, Hawkins AL, Griffin CA, Small D and Civin CI (1996). Tnk1: A Novel Intracellular Tyrosine Kinase Gene Isolated from Human Umbilical Cord Blood CD34+/Lin-/CD38- Stem/Progenitor Cells. Oncogene 12, 903–913. https://europepmc.org/article/med/8632913. - PubMed
-
- Henderson MC, Gonzales IM, Arora S, Choudhary A, Trent JM, Von Hoff DD, Mousses S and Azorsa DO (2011). High-throughput RNAi Screening Identifies a Role for TNK1 in Growth and Survival of Pancreatic Cancer Cells Molecular cancer research 9, 724–732. 10.1158/1541-7786.MCR-10-0436. - DOI - PMC - PubMed
-
- Zhu YX, Tiedemann R, Shi CX, Yin H, Schmidt JE, Bruins LA, Keats JJ, Braggio E, Sereduk C, Mousses S, et al. (2011). RNAi Screen of the Druggable Genome Identifies Modulators of Proteasome Inhibitor Sensitivity in Myeloma Including CDK5. Blood 117, 3847–3857. 10.1182/blood-2010-08-304022. - DOI - PMC - PubMed
MeSH terms
Substances
Grants and funding
LinkOut - more resources
Full Text Sources
Molecular Biology Databases

