. 2023 Oct 12;186(21):4632-4651.e23.
doi: 10.1016/j.cell.2023.08.044. Epub 2023 Sep 29.

Multi-omics analysis of mucosal and systemic immunity to SARS-CoV-2 after birth

Affiliations

Multi-omics analysis of mucosal and systemic immunity to SARS-CoV-2 after birth

Florian Wimmers et al. Cell. .

Abstract

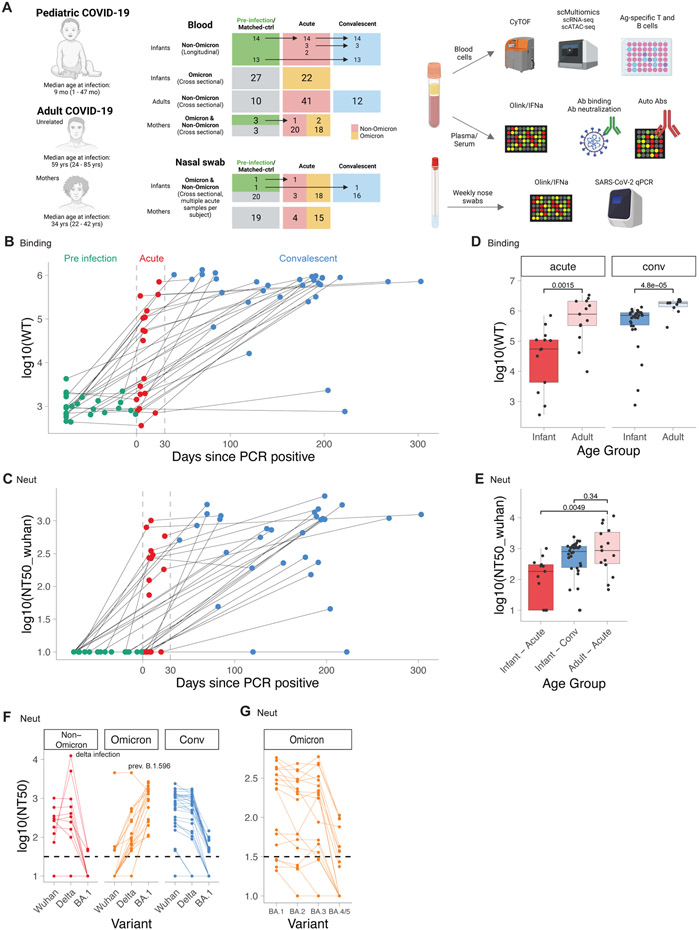
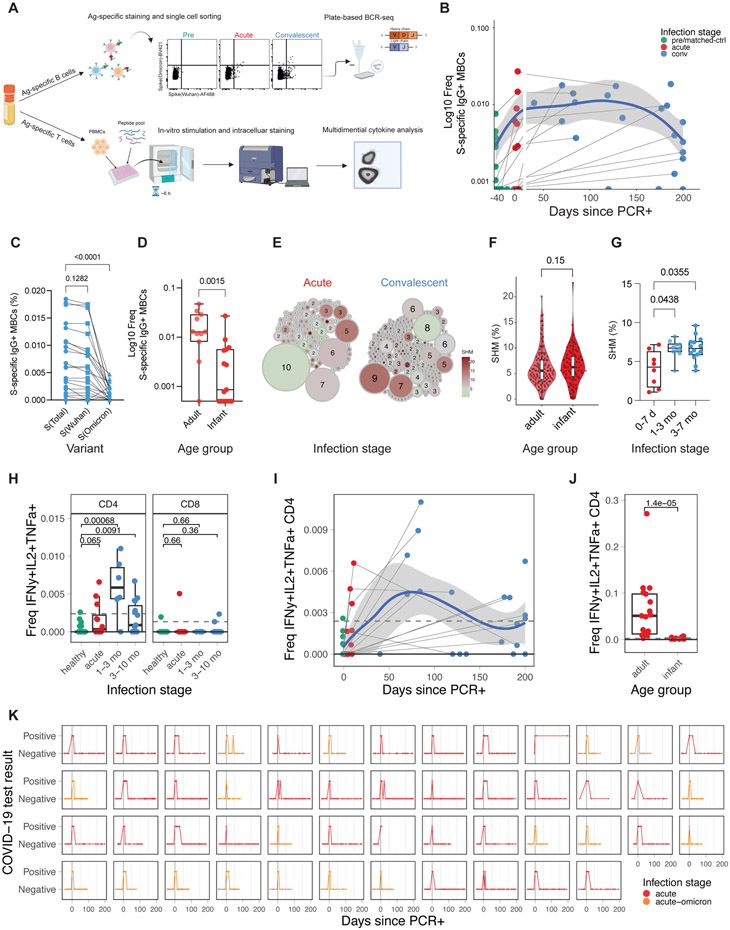
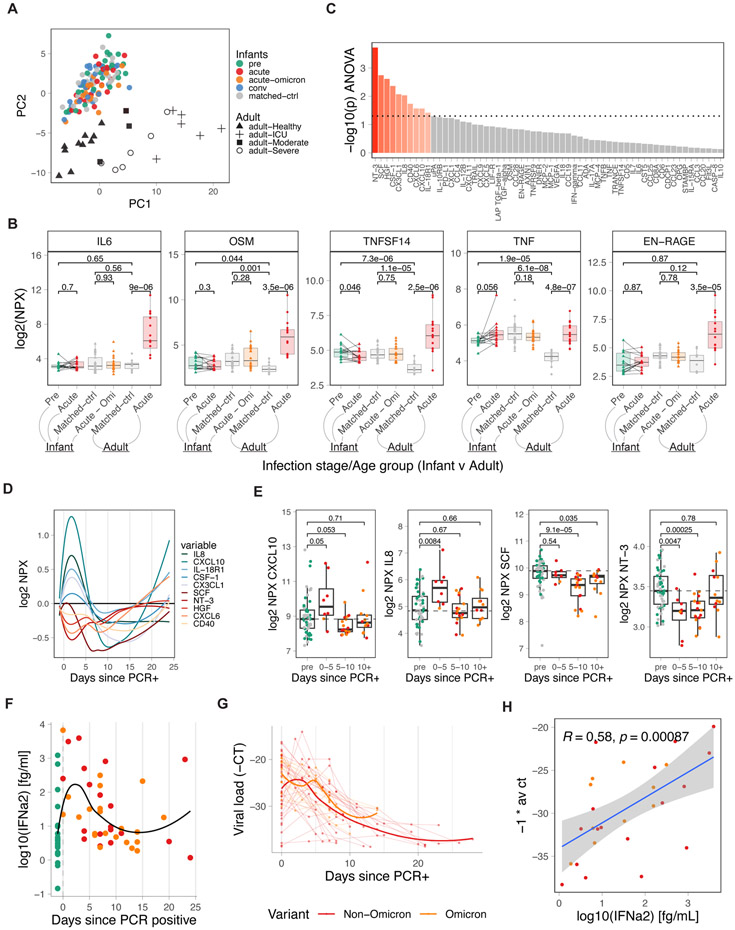
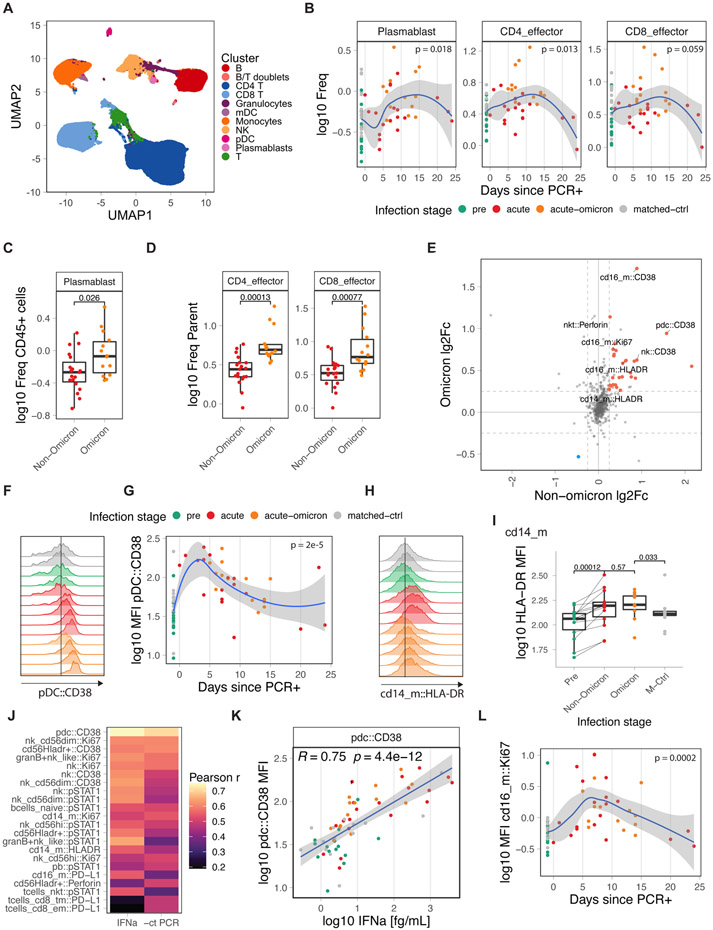
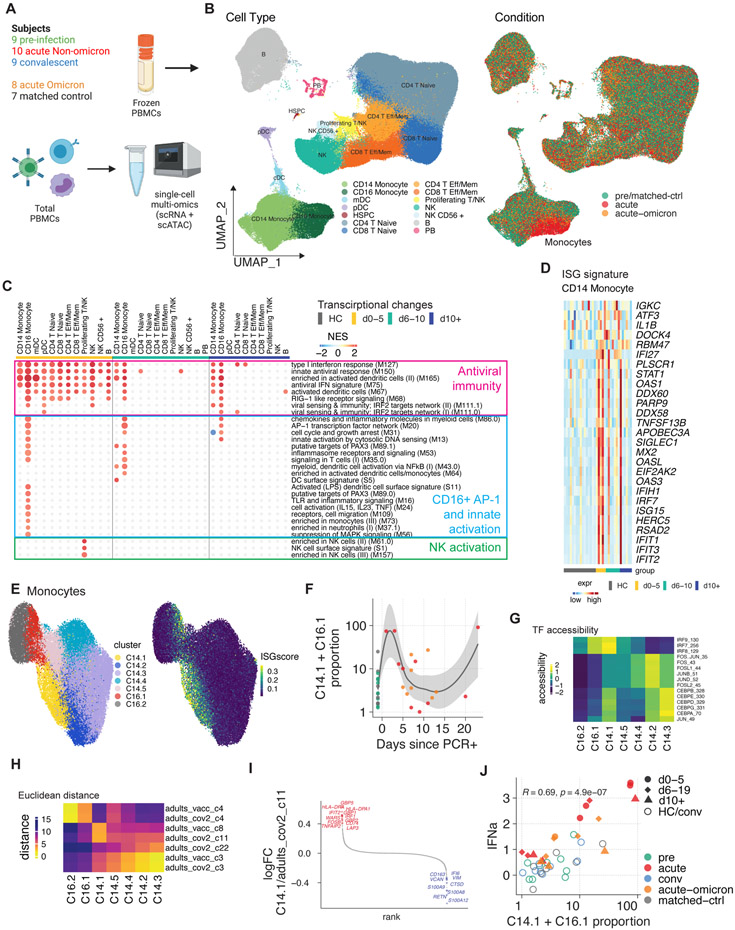
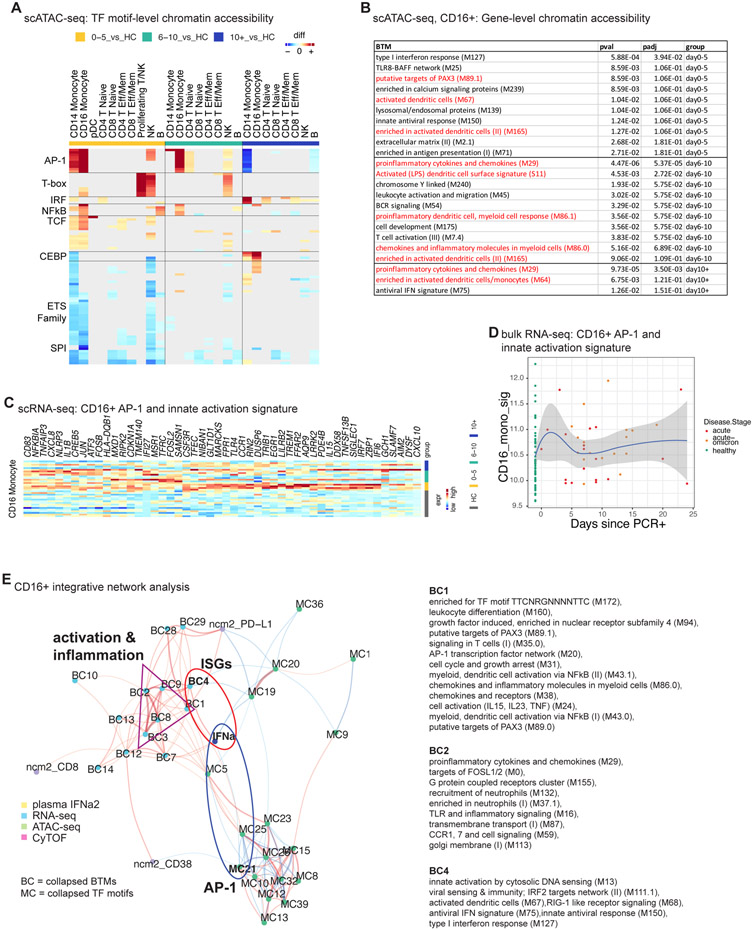
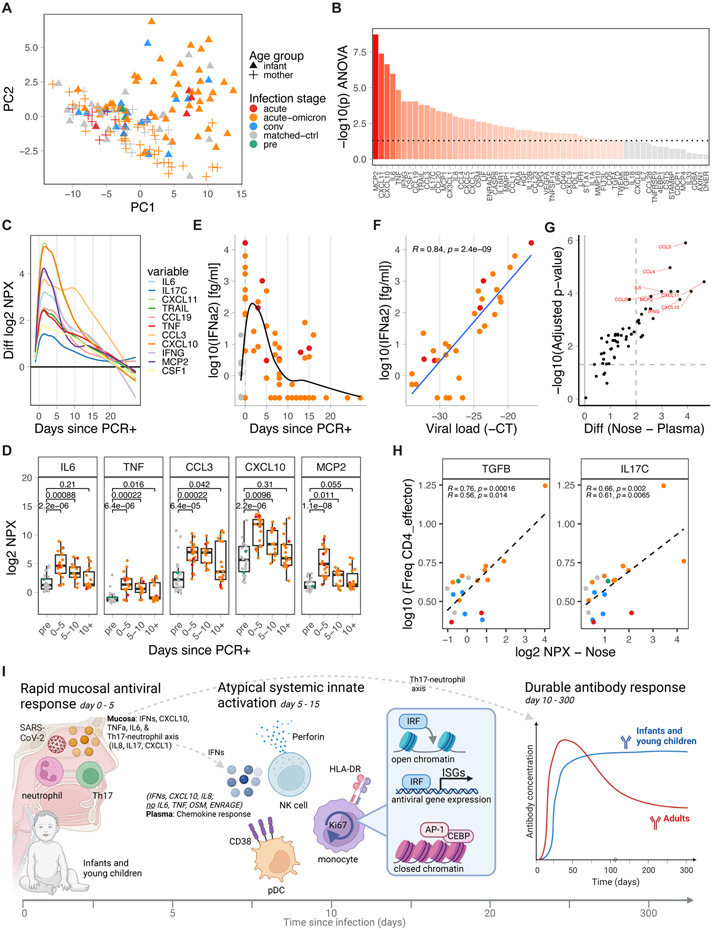
The dynamics of immunity to infection in infants remain obscure. Here, we used a multi-omics approach to perform a longitudinal analysis of immunity to severe acute respiratory syndrome coronavirus 2 (SARS-CoV-2) in infants and young children by analyzing blood samples and weekly nasal swabs collected before, during, and after infection with Omicron and non-Omicron variants. Infection stimulated robust antibody titers that, unlike in adults, showed no sign of decay for up to 300 days. Infants mounted a robust mucosal immune response characterized by inflammatory cytokines, interferon (IFN) α, and T helper (Th) 17 and neutrophil markers (interleukin [IL]-17, IL-8, and CXCL1). The immune response in blood was characterized by upregulation of activation markers on innate cells, no inflammatory cytokines, but several chemokines and IFNα. The latter correlated with viral load and expression of interferon-stimulated genes (ISGs) in myeloid cells measured by single-cell multi-omics. Together, these data provide a snapshot of immunity to infection during the initial weeks and months of life.

Keywords: SARS-CoV-2; durability; infants; mucosal immunity; multi-omics; neonates; single-cell ATAC-seq; single-cell RNA-seq; viral infection.


Conflict of interest statement

Declaration of interests B.P. serves on the External Immunology Board of GSK and on the Scientific Advisory Board of Sanofi, Medicago, Boehringer Ingelheim, Icosavax, and EdJen. F.W. is a consultant for Gilead. A.S. is a consultant for Gritstone Bio, Flow Pharma, Moderna, AstraZeneca, Qiagen, Fortress, Gilead, Sanofi, Merck, RiverVest, MedaCorp, Turnstone, NA Vaccine Institute, Emervax, Gerson Lehrman Group and Guggenheim. LJI has filed for patent protection for various aspects of T cell epitope and vaccine design work.

Figures

Figure 1.
Figure 1.. Durable antibody response in infants and young children with COVID-19.
A) Study layout. B-G) Antibody binding and neutralization titers of infants and adults with COVID-19. B) Antibody binding titers to WT strain in longitudinal samples from infants taken before (Pre, n=27), during (Acute, n=19), and after (Conv, n=30) infection. Dotted lines indicate days 0 and 30 post PCR+. C) Neutralizing antibody titers to Wuhan strain. D) Binding titers to WT strain in adults (Acute, n=13; Conv n=10) and infants (Acute n=13, Conv n=30). E) Neutralizing titers to Wuhan strain in adults (Acute n=15) and infants (Acute n=13, Conv n=30). F, G) Neutralizing titers against different variants in infants (Non-Omicron n=13, Omicron n=18, Conv n=30). D-G) Shown are only samples > 5 days post-infection. Statistical comparisons with Wilcoxon rank sum test. See also Figure S1
Figure 2.
Figure 2.. Transient memory B and T-cell response to COVID-19 infection in infants and young children.
A) Experiment overview. B) Frequency of SARS-CoV-2 spike-specific IgG+ memory B-cells as a proportion of CD20+ B-cells (infants and young children: pre n=12, acute n=12, conv n=21). Blue line indicates average; shaded areas indicate 5th to 95th percentiles. C,D) Frequency of spike-specific IgG+ memory B-cells in C) infants and young children at convalescent phase and D) at acute phase in adults (mild/moderate infection n=11) and infants and young children (non-omicron n=12, omicron n=3). E) Clonality analysis of sorted spike-specific IgG+ memory B-cells in infants and young children (n=220). Circle size indicates the number of IGHV sequences; color represents the mean IGHV somatic hypermutation rate. F) Somatic hypermutation rates of IGHV genes in single sorted spike-specific IgG+ memory B-cells at acute phase. G) Mean somatic hypermutation rate of all cloned IGHV genes in indicated infant samples. H) Fraction of spike-specific multifunctional T-cells (IFNg+, IL-2+, TNFa+) at different infection stages. I) Kinetics of multifunctional CD4+ T-cell response. J) Comparison of multifunctional CD4+ T-cell response during the acute phase of infection in infants and young children and adults. K) Longitudinal overview of weekly COVID-19 test results from infant nasal swabs (Non-Omicron n=32, Omicron n=18). Statistical comparisons were conducted with Wilcoxon rank sum test. Solid line indicates median healthy response; dashed line indicates 3x median healthy response. See also Figure S2
Figure 3.
Figure 3.. IFN-driven plasma cytokine response to COVID-19 infection in infants and young children.
A) PCA analysis of Olink-based plasma cytokines from COVID-19-infected and healthy infants and young children and adults, including matched controls (adult n=10, infant n=27), pre-infection (infant n=27), acute (adult n=15, infant n=19), acute-omicron (infant n=18), and convalescent (n=30) time points, colored by infections stage. Shape indicates disease severity in adult samples. B) Comparison of key inflammatory mediators during COVID-19 infection. Only paired samples are shown for infant pre and acute (n=14). C) ANOVA analysis of time-dependent, infection-associated changes in plasma cytokines. Shown is the p-value for the top 60 analyzed cytokines. P-values < 0.05 are indicated in red. D) Kinetics of indicated plasma cytokines. E) Time-dependent changes in plasma levels of key cytokines. F) Plasma IFNα2 levels in infants and young children relative to the first positive COVID-19 test (healthy n=27, acute n=19, acute-omicron n=22). G) Viral load in nasal swabs of COVID-19-infected infants and young children. Shown are all −1 * Ct values since the first positive COVID-19 test for each infant (acute n=32, acute-omicron n=18). H) Correlation between plasma IFNα2 levels and viral load (−1 * Ct). Statistical comparisons were conducted with the Wilcoxon rank sum test (E) and the paired and unpaired t-test (B). Correlation analyses were conducted using Spearman correlation. Lines were fitted using the loess (D) and linear regression (H) approaches. See also Figure S3
Figure 4.
Figure 4.. Immune cell activation during COVID-19 infection.
A) UMAP overview of cell clusters identified by CyTOF (n: pre=14, acute=19, acute-omicron=14, conv=14, matched-ctrl=14). B) Frequency of plasmablasts and effector T-cells as a proportion of total CD45+ and total T-cells, respectively. C, D) Comparison of plasmablast and effector T-cell frequencies in infants and young children. E) Average log fold-change of marker expression levels in healthy and infected samples. Markers that are significantly changed in Omicron and Non-Omicron cases are colored. F) Distribution of CD38 expression in pDCxs in representative samples. G) Kinetics of CD38 expression in pDCs. H) Distribution of HLA-DR expression in classical monocytes (CD14_m) in representative samples. I) HLA-DR expression in classical monocytes (CD14_m). J) Pearson r for correlations between CyTOF marker expression and plasma IFNα2 levels or viral load (−1 * Ct). K) Scatter graph plotting plasma IFNα2 levels against CD38 expression in pDCs. L) Kinetics of Ki67 expression in non-classical monocytes (cd16_m). Statistical comparisons were conducted with the Wilcoxon rank sum test. Correlation analyses were conducted using Pearson correlation. Lines were fitted using the loess (B,G,L) and linear regression (K) approaches. See also Figure S4
Figure 5 –
Figure 5 –. Single-cell multi-omics analysis of immunity to COVID-19 infection in infants and young children.
A) Cartoon of the conducted experiment. B) UMAP representation of PBMCs from all analyzed samples, colored by cell type (left) and infection stage (right; convalescent samples not shown). C) Pairwise comparison of genes from healthy (n=16) and COVID-19–infected infants and young children at different times during acute infection (D0-5: n=5, D5-10: n=7, D10+: n=6) was conducted for each cluster. DEGs were analyzed for the enrichment of BTMs. Ring plot shows an abridged representation of enriched pathways in each cluster. Size indicates the number of samples with enrichment; colors indicate the normalized enrichment score. Full ring plot in Figure S5a. D) Expression of ISGs enriched in CD14+ monocytes in C) (magenta box). E) UMAP representation of monocyte subclustering analysis. F) Kinetics of CD14.1 and C16.1 monocyte subsets. G) Chromatin accessibility for selected TFs in different monocyte subsets. H) Integrated analysis of monocyte clusters from this study and from adult COVID-19 patients and adult subjects immunized with the COVID-19 vaccine. Shown is the Euclidean distance between infant and adult monocyte subsets. I) DEGs determined between infant C14.1 and adult COVID-19-infection C11 monocyte clusters are plotted and ranked by fold change. J) Spearman’s Rho correlation analysis between plasma IFNα2 levels and fraction of interferon-experienced monocytes (bottom). See also Figure S5
Figure 6.
Figure 6.. Single-cell multi-omics analysis of CD16+ monocyte activation
A) Pairwise comparison of TF motif accessibility (healthy: n=16; D0-5: n=5, D5-10: n=7, D10+: n=6). Color indicates differences in TF accessibility; non-significant changes (FDR>=0.001 or changed in less than three subjects) are grey. B) Enrichment of BTMs in differentially accessible gene scores in CD16+ monocytes at indicated time points. C) Expression of inflammation and AP-1-related genes enriched in CD16+ monocytes in Figure 5c (blue box). D) Kinetics of gene signature from (C) using bulk transcriptomics data (healthy: n=53, acute: n=19, acute-omicron: n=18). E) Integrated network analysis of plasma IFNα2 levels, BTM-based gene expression, TF motif accessibility, and CyTOF protein marker expression. Both line color and thickness indicate Spearman's rank correlation coefficient. See also Figure S6
Figure 7.
Figure 7.. Nasal immune response to SARS-CoV-2 infection in infants and young children.
A) PCA of nasal cytokines from SARS-CoV-2-infected and healthy infants and young children and mothers, including matched controls (infant n=20, mother n=19), pre-infection (infant n=2), acute (infant n=7, mother n=9), acute-omicron (infant n=45, mother n=40), and convalescent (infant n=17) time points, colored by infections stage. Shape indicates age group and vaccination status. B) Time-dependent, infection-associated changes analyzed by ANOVA. Shown is the p-value. P-values < 0.05 are indicated in red. C) Kinetics of top-upregulated nasal swab cytokines. D) Time-dependent changes in nasal swab levels of selected cytokines. E) Nasal swab IFNα2 levels in infants and young children relative to the first positive COVID-19 test (healthy n=22, non-omicron n=7, omicron n=45). F) Correlation between viral load (−1 * Ct) and nasal swab IFNα2 levels during acute infection (n=32). G) Difference in cytokine upregulation during early infection (d0-5) relative to healthy controls between plasma and nasal swab samples. H) Correlation between the frequency of CD4_effector cells and indicated mucosal cytokine levels using matched blood and nasal swab samples (+/− 5 days). I) Cartoon summary of the findings of this study. Statistical comparisons were conducted with the Wilcoxon rank sum test (D) and the unpaired t-test (G). Correlation analyses used Pearson (F, H) and Spearman correlation (H – lower stats). Lines were fitted using the loess (C, E) and linear model approach (F, H). See also Figure S7

References

    1. Olin A, Henckel E, Chen Y, Lakshmikanth T, Pou C, Mikes J, Gustafsson A, Bernhardsson AK, Zhang C, Bohlin K, et al. (2018). Stereotypic Immune System Development in Newborn Children. Cell 174, 1277–1292.e14. 10.1016/j.cell.2018.06.045. - DOI - PMC - PubMed
    1. Simon AK, Hollander GA, and McMichael A (2015). Evolution of the immune system in humans from infancy to old age. Proc. R. Soc. B Biol. Sci 282, 20143085. 10.1098/rspb.2014.3085. - DOI - PMC - PubMed
    1. Sanchez-Schmitz G, and Levy O (2011). Development of Newborn and Infant Vaccines. Sci. Transl. Med 3, 90ps27–90ps27. 10.1126/scitranslmed.3001880. - DOI - PMC - PubMed
    1. Castagnoli R, Votto M, Licari A, Brambilla I, Bruno R, Perlini S, Rovida F, Baldanti F, and Marseglia GL (2020). Severe Acute Respiratory Syndrome Coronavirus 2 (SARS-CoV-2) Infection in Children and Adolescents: A Systematic Review. JAMA Pediatr. 174, 882–889. 10.1001/jamapediatrics.2020.1467. - DOI - PubMed
    1. Provisional COVID-19 Deaths: Focus on Ages 0–18 Years ∣ Data ∣ Centers for Disease Control and Prevention. https://data.cdc.gov/NCHS/Provisional-COVID-19-Deaths-Focus-on-Ages-0-18....

Publication types