. 2023 Sep 30;14(1):6122.
doi: 10.1038/s41467-023-41897-0.

PET-measured human dopamine synthesis capacity and receptor availability predict trading rewards and time-costs during foraging

Affiliations

PET-measured human dopamine synthesis capacity and receptor availability predict trading rewards and time-costs during foraging

Angela M Ianni et al. Nat Commun. .

Abstract

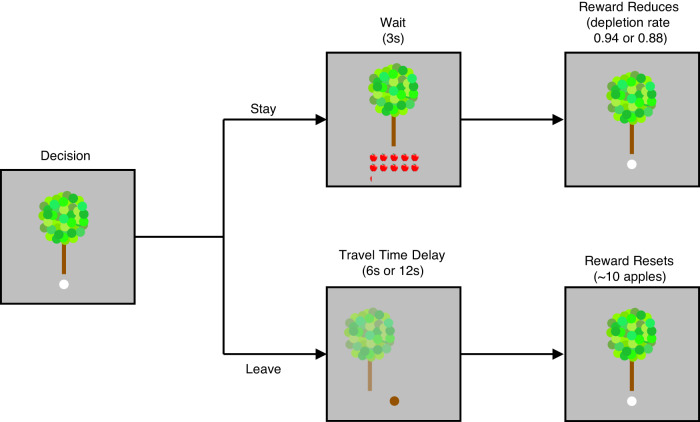
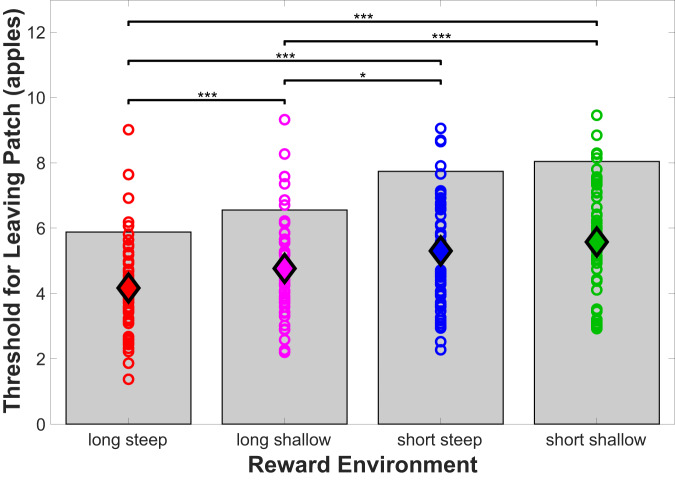
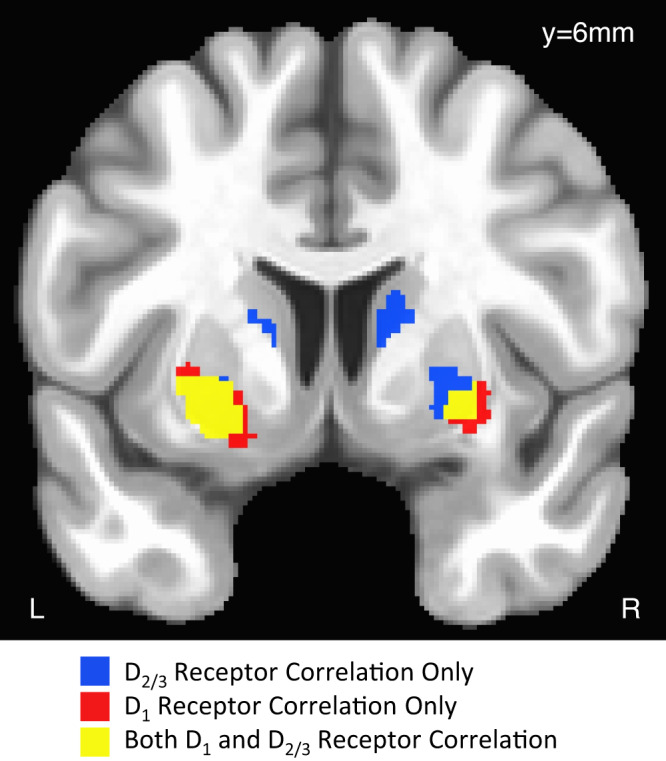
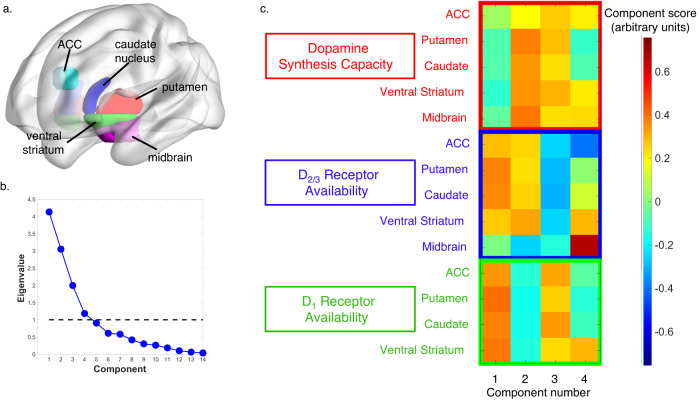
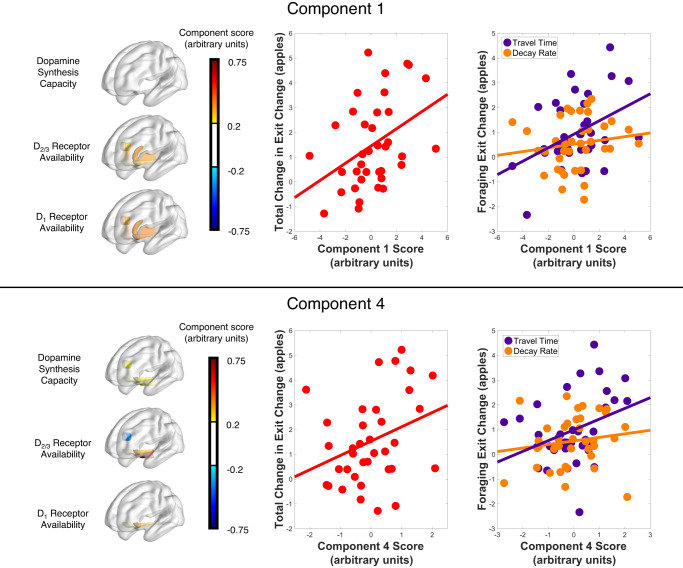
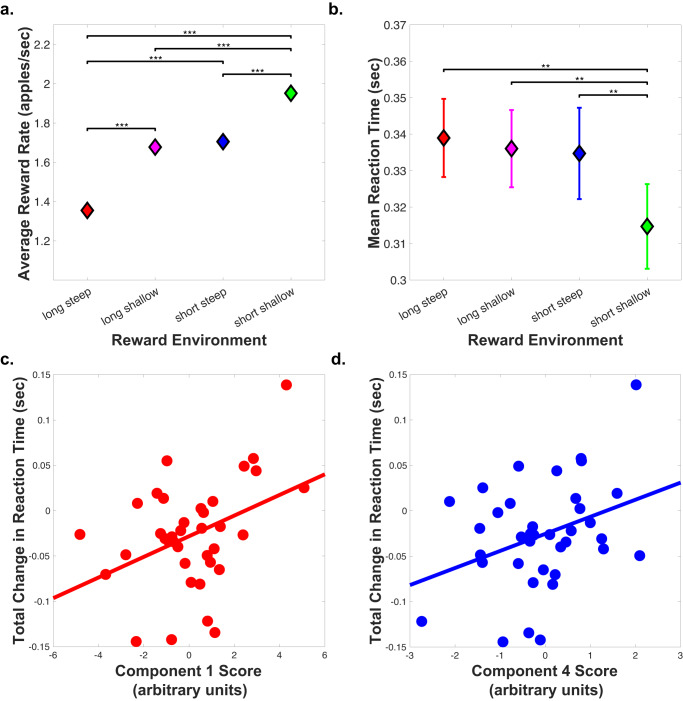
Foraging behavior requires weighing costs of time to decide when to leave one reward patch to search for another. Computational and animal studies suggest that striatal dopamine is key to this process; however, the specific role of dopamine in foraging behavior in humans is not well characterized. We use positron emission tomography (PET) imaging to directly measure dopamine synthesis capacity and D1 and D2/3 receptor availability in 57 healthy adults who complete a computerized foraging task. Using voxelwise data and principal component analysis to identify patterns of variation across PET measures, we show that striatal D1 and D2/3 receptor availability and a pattern of mesolimbic and anterior cingulate cortex dopamine function are important for adjusting the threshold for leaving a patch to explore, with specific sensitivity to changes in travel time. These findings suggest a key role for dopamine in trading reward benefits against temporal costs to modulate behavioral adaptions to changes in the reward environment critical for foraging.

Trial registration: ClinicalTrials.gov NCT00004571 NCT00942981 NCT00024622.


Conflict of interest statement

The authors declare no competing interests.

Figures

Fig. 1
Fig. 1. Patch foraging task schematic.
Participants decided whether to stay at the current tree and harvest it for apples or leave and search for a new tree. If they decided to stay, they would receive a certain number of apples, shown below the tree, which was later translated to monetary reward added to their compensation. The number of apples remaining in the tree would then decrease according to a set depletion rate. Subjects would then make the stay or leave decision again. There were infinite new trees available. If participants decided to leave, they had to endure a travel time delay until they reached a new tree. This task was completed in four different reward environments, varying in travel time, which was either long (12 s) or short (6 s), and reward depletion rate, which was either steep (0.88 times previous reward) or shallow (0.94 times previous reward). Each block lasted 6.5 min and travel time and depletion rate remained constant throughout the block. Blocks were presented in random order across participants. Task adapted for current experiment in collaboration with Sara Constantino.
Fig. 2
Fig. 2. Reward patch leaving thresholds across reward environments.
The average threshold for leaving a reward patch is shown for the group (filled diamonds) and for each participant (open circle, n = 56) for each reward environment. The optimal thresholds as calculated from the marginal value theorem are indicated with the gray bars (5.88, 6.56, 7.74, 8.04 for long steep, long shallow, short steep, and short shallow reward environments, respectively). The group average thresholds are denoted with the colored diamonds. Two factor repeated measures ANOVA revealed independent effects of both decay rate and travel time (p < 0.0373 for decay rate and p < 5.24e−6 for travel time; n = 56 individual participants) but not the interaction (p = 0.438). Post-hoc paired t-tests revealed that the threshold for leaving a patch is significantly lower in the long-steep reward environment compared to the long-shallow (p = 2.23e−4), short-steep (p = 9.16e−7), and short-shallow (p = 3.72e−7) environments. The threshold for leaving a patch was lower in the long-shallow reward environment compared to the short-steep (p = 0.0147) and short-shallow (p = 2.76e−4) environments. Results from post-hoc paired t-tests are indicated on the figure as follows: *p < 0.05, ***p < 0.001. Source data are provided as a Source Data file.
Fig. 3
Fig. 3. Voxelwise results for linear regression of D1 and D2/3 dopamine receptor availability and total change in exit threshold.
Voxels that remain significant at a threshold of TFCE FWE corrected for multiple comparisons at a threshold of p < 0.05, two-sided, small volume corrected within the basal ganglia. Significant voxels for regression between total change in exit threshold and D1-receptor availability (n = 45 individual participants) are colored red, D2/3-receptor availability (n = 40 individual participants) are colored blue, and overlapping voxels significant for both D1- and D2/3-receptor availability are colored yellow.
Fig. 4
Fig. 4. Regions of interest (ROIs) and Dopamine PET principal component analysis (PCA) Results.
a ROIs for one example participant including the dorsal putamen (red), dorsal caudate nucleus (blue), ventral striatum (green) and dopaminergic midbrain (magenta). Anterior cingulate cortex (ACC) ROI (cyan) created as a 5 mm sphere around the MNI coordinates (−4, 32, 20) from Kolling et al. foraging search value peak voxel [7]. b Screen plot of eigenvalues for all components identified with dopamine PET PCA analysis. The cut-off line of one is shown as a dotted black line and the four components with eigenvalues greater than one were used for regression analyses with foraging behavioral parameters. c Component scores (arbitrary units) from the four PCA components with eigenvalues greater than 1. [18F]-FDOPA ROI values are shown in red (Dopamine Synthesis Capacity), [18F]-Fallypride values are shown in blue (D2/3 Receptor Availability), and [11C]-NNC112 values are shown in green (D1 Receptor Availability). Source data are provided as a Source Data file.
Fig. 5
Fig. 5. Correlation of dopamine PCA components 1 and 4 with total change in leaving threshold.
Images on the left are the component weightings for PCA components 1 (top) and 4 (bottom). The middle plots (in red) show that individuals who made greater adjustments in their patch-leaving threshold had higher scores for PCA component 1 and component 4 (linear regression model with all four components F = 3.35, p = 0.0213, two-sided, n = 37 individual participants; component 1 t = 2.699, p = 0.011, component 4 t = 2.390, p = 0.0229). The right-hand plots show that dopamine PCA components 1 and 4 are positively correlated with change in travel time and but not with change in decay rate. Component 1 (top): linear regression model F = 3.78, p = 0.0328, two-sided; threshold change due to travel time t = 2.579, p = 0.0144, threshold change due to decay rate t = 0.760, p = 0.453. Component 4 (bottom): linear regression model F = 2.64, p = 0.0861, two-sided, threshold change due to travel time t = 2.116, p = 0.0417, threshold change due to decay rate t = 0.730, p = 0.470. Reported p-values are unadjusted. Source data are provided as a Source Data file.
Fig. 6
Fig. 6. Correlation of dopamine PCA components and change in reaction time.
a Average of the reward rate across subjects in each reward environment (n = 56 individual participants). Data are presented as mean +/− standard error of the mean (SEM). Paired t-tests revealed that the average reward rate was lower in the long-steep reward environment compared to the long-shallow (p = 1.51e−19), short-steep (p = 3.47e−21), and short-shallow (p = 3.40e−28) environments. In addition, the average reward rate was higher in the short-shallow reward environment compared the long-shallow (p = 7.68e−16) and short-steep (p = 4.12e−13) environments. b Average reaction time across subjects in each reward environment. Data are presented as mean +/− SEM. Paired t-tests showed that the reaction time in the short-shallow reward environment is quicker than the long-steep (p = 0.0022), long-shallow (p = 0.0034), and short-steep (p = 0.0045) environments. c Correlation between total change in reaction time between the short-shallow and long-steep reward environments and dopamine PCA component 1 score (r = 0.395, p = 0.0155). d Correlation between total change in reaction time and dopamine PCA component 4 score (r = 0.349, p = 0.0343). Linear regression model including both components 1 and 4 scores as the independent variables predicting the dependent variable, change in reaction time, revealed a significant model with F = 6.57, p = 0.00386. Both components were significantly associated with the change in reaction time: component 1: t = 2.704, p = 0.0106; component 4: t = 2.406, p = 0.0217. Results from paired t-tests are indicated on the figure as follows: *p < 0.05, **p < 0.01, ***p < 0.001. Source data are provided as a Source Data file.

References

    1. Hayden BY, Pearson JM, Platt ML. Neuronal basis of sequential foraging decisions in a patchy environment. Nat. Neurosci. 2011;14:933–939. - PMC - PubMed
    1. Constantino SM, Daw ND. Learning the opportunity cost of time in a patch-foraging task. Cogn. Affect. Behav. Neurosci. 2015;15:837–853. - PMC - PubMed
    1. Le Heron C, et al. Dopamine modulates dynamic decision-making during foraging. J. Neurosci. 2020;40:5273–5282. - PMC - PubMed
    1. Schulz E, et al. Structured, uncertainty-driven exploration in real-world consumer choice. Proc. Natl Acad. Sci. 2019;116:13903–13908. - PMC - PubMed
    1. Charnov EL. Optimal foraging, the marginal value theorem. Theor. Popul. Biol. 1976;9:129–136. - PubMed

Publication types

Associated data