. 2023 Sep 30;14(1):6113.
doi: 10.1038/s41467-023-41785-7.

Deleterious heteroplasmic mitochondrial mutations are associated with an increased risk of overall and cancer-specific mortality

Affiliations

Deleterious heteroplasmic mitochondrial mutations are associated with an increased risk of overall and cancer-specific mortality

Yun Soo Hong et al. Nat Commun. .

Abstract

Mitochondria carry their own circular genome and disruption of the mitochondrial genome is associated with various aging-related diseases. Unlike the nuclear genome, mitochondrial DNA (mtDNA) can be present at 1000 s to 10,000 s copies in somatic cells and variants may exist in a state of heteroplasmy, where only a fraction of the DNA molecules harbors a particular variant. We quantify mtDNA heteroplasmy in 194,871 participants in the UK Biobank and find that heteroplasmy is associated with a 1.5-fold increased risk of all-cause mortality. Additionally, we functionally characterize mtDNA single nucleotide variants (SNVs) using a constraint-based score, mitochondrial local constraint score sum (MSS) and find it associated with all-cause mortality, and with the prevalence and incidence of cancer and cancer-related mortality, particularly leukemia. These results indicate that mitochondria may have a functional role in certain cancers, and mitochondrial heteroplasmic SNVs may serve as a prognostic marker for cancer, especially for leukemia.


Conflict of interest statement

The authors declare no competing interests.

Figures

Fig. 1
Fig. 1. Single nucleotide variants (SNVs) and invariant sites across mitochondrial DNA.
Circos plot tracks from outer (Track 1) to inner (Track 4): Track 1 is all synonymous and non-coding (tRNA, rRNA and D-loop) heteroplasmic sites. Track 2 is all nonsynonymous and nonsense heteroplasmic SNVs, where nonsense heteroplasmic SNVs are colored in red. The Y-axis of Tracks 1 and 2 is the log(number of participants with a heteroplasmy + 1), scaled from 0 to 9. Track 3 is positions with no heteroplasmy. Three or more adjacent null positions are colored light gray, 2 adjacent positions are colored medium gray, and singlets are colored dark gray. The height of Track 3 bars is scaled by color, light gray is the lowest, followed by medium gray, then dark gray. Innermost track (Track 4) is gene annotations. Genes are colored similarly by complex or by gene type. Source data are provided as a Source Data file.
Fig. 2
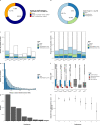
Fig. 2. Overview of mitochondrial SNV distributions.
a Proportion of mitochondrial DNA positions with SNVs. b Proportion of SNVs that are heteroplasmic, homoplasmic, or both. c Number of possible SNVs that are heteroplasmic, homoplasmic, or both, grouped by protein complex or genic context. d Bar chart of the proportion of possible SNVs that are heteroplasmic, homoplasmic, or both grouped by protein complex or genic context scaled to 1. e Histogram of the median variant allele fraction (VAF) for variants seen as only a heteroplasmy or both a hetero- and homoplasmy among individuals with at least one heteroplasmic SNV (n = 59,414). The two histograms are overlaid. f Boxplot of the median VAF by type of mutation. The center line indicates the median, the box limits the lower and upper quartiles, the whiskers the 1.5× interquartile range, and the points outliers. g Number of participants in each haplogroup (n = 194,871). Haplogroups were grouped by phylogenetic similarity into the following: L is L0-L6; M is C, D, E, G, M, Q, Z; N is A, I, N, S, W, X Y; R is B, F, P, R; R0 is R0, HV, V; U is U, K; JT is JT, T; H is H only. h Mean heteroplasmy count (95% confidence intervals) by haplogroup adjusted for age, sex, center, and smoking status. Source data are provided as a Source Data file.
Fig. 3
Fig. 3. Mean heteroplasmic count by age category and smoking status in the UK Biobank (n = 194,871).
Error bars are 95% confidence intervals. Source data are provided as a Source Data file.
Fig. 4
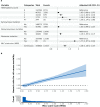
Fig. 4. Hazard ratios (95% confidence intervals) for all-cause mortality by heteroplasmy and mutation type.
a Hazard ratios (HR) for the association of all-cause mortality by heteroplasmy count, presence of synonymous mutation, nonsynonymous mutation, nonsense mutation, and MLC score sum (MSS) were estimated from separately Cox proportional hazards models stratified by assessment center and adjusted for age, sex, and smoking status. The numbers of participants and events reflects the number included in the regression analysis. b Adjusted dose-response relationship between MSS and all-cause mortality and histogram of MSS among participants with at least 1 heteroplasmy count. Hazard ratios (95% confidence intervals) were derived from Cox proportional hazards models that include MSS as restricted cubic splines with 4 degrees of freedom and were stratified by assessment center and adjusted for age, sex, smoking status, alcohol intake, body mass index, white blood cell count, and haplogroup. 58 participants with MSS greater than 2 were excluded from the plot. Source data are provided as a Source Data file.
Fig. 5
Fig. 5. Hazard ratios for each cause of death per 1-unit increase in MLC score sum (MSS).
Hazard ratios for a each specific cause of death, and b cancer-specific mortality, were estimated using Cox proportional hazards models stratified by center and adjusted for age, sex, smoking status, alcohol intake, body mass index, white blood cell count, and haplogroup. FDR-corrected P values accounting for multiple testing are reported in the main text. Uncorrected P values are presented in the plot. Cases of death in fewer than 100 participants (deaths due to benign diseases of the blood [n = 26] or genitourinary disorders [n = 83] in a and deaths due to cancers of lip, oral cavity, and pharynx [n = 91] or thyroid and other endocrine glands [n = 25] in b) are not included in the plot. Neoplasm in a included both benign and malignant neoplasms. Hematologic cancers in b included cancers of the lymphoid, hematopoietic, and related tissues. Lung cancers in b included cancers of the respiratory and intrathoracic organs. All statistical significance was based on two-sided tests. Abbreviations: CNS, central nervous system. The number of events reflect the number of events in participants included in the regression analysis. Source data are provided as a Source Data file.
Fig. 6
Fig. 6. The associations of MSS and cancer prevalence, incidence, and death.
a Prevalence ratios (PRs) and 95% confidence intervals (CIs) for the associations of MSS with prevalent lung cancer, breast cancer, lymphoma, and leukemia were estimated using marginally predicted prevalence from logistic regression models adjusted for age, sex, center, smoking status, alcohol intake, body mass index, white blood cell count, and haplogroup. b Hazard ratios (HRs) and 95% CI for the associations of MSS with incident lung cancer, breast cancer, lymphoma, and leukemia were estimated using Cox proportional hazards models adjusted as above. For incident cancer, we excluded participants with any history of cancer at the time of blood collection. c Sub-distribution HRs and 95% CIs for mortality due to lung cancer, breast cancer, lymphoma, and leukemia were estimated using the Fine and Gray method to account for competing events (mortality from other cancers and non-cancer causes). The analyses were restricted to participants who had prevalent cancer at the time of the UKB visit (“Prevalent”), new cases that developed during follow-up (“Incident”), or either prevalent or incident cancer (“Any”) of the given type of cancer. For incident cases, individuals with prevalent cancer of the given type were excluded. The numbers of participants and events reflect the numbers included in the regression analyses. Source data are provided as a Source Data file.
Fig. 7
Fig. 7. Phenome-wide association study (PheWAS) of MSS.
a X axis indicates disease categories (colors) for phecodes with at least 10 cases, y axis indicates P value for association between phecode and MSS. Up/down arrows indicate positive/negative effect direction for association. The blue horizontal line indicates P value = 0.05. The red horizontal line indicates P value cutoff after Bonferroni correction (3.1 × 10−5). Phecodes with P values < 1.0 × 10−15 are plotted at −log10(P value)) = 15. b Heatmap displaying the significance (−log10(P value)) of the association between MSS and ICD-10 codes for cancer (“Chapter II Neoplasms”) and hematological diseases (“Chapter III Disease of the blood and blood-forming organs and certain disorders involving the immune mechanism”) stratified by mtDNA region/complex. ICD-10 codes were selected if the significance with the overall MSS was <1 × 10−6, and clustered using Pearson’s correlation. −log10(P values) >2 (corresponding to P values > 0.01) were set to 0 for visualization. P values are not corrected for multiple comparison. All statistical significance was based on two-sided tests. Source data are provided as a Source Data file.

References

    1. Stewart JB, Chinnery PF. Extreme heterogeneity of human mitochondrial DNA from organelles to populations. Nat. Rev. Genet. 2021;22:106–118. doi: 10.1038/s41576-020-00284-x. - DOI - PubMed
    1. Gorman GS, et al. Mitochondrial diseases. Nat. Rev. Dis. Primers. 2016;2:16080. doi: 10.1038/nrdp.2016.80. - DOI - PubMed
    1. Wei W, Chinnery PF. Inheritance of mitochondrial DNA in humans: implications for rare and common diseases. J. Intern. Med. 2020;287:634–644. doi: 10.1111/joim.13047. - DOI - PMC - PubMed
    1. Wei W, et al. Germline selection shapes human mitochondrial DNA diversity. Science. 2019;364:eaau6520. doi: 10.1126/science.aau6520. - DOI - PubMed
    1. Laricchia KM, et al. Mitochondrial DNA variation across 56,434 individuals in gnomAD. Genome Res. 2022;32:569–582. doi: 10.1101/gr.276013.121. - DOI - PMC - PubMed

Publication types

Substances

Grants and funding