. 2023 Sep 30;14(9):645.
doi: 10.1038/s41419-023-06164-6.

Crotonylated BEX2 interacts with NDP52 and enhances mitophagy to modulate chemotherapeutic agent-induced apoptosis in non-small-cell lung cancer cells

Affiliations

Crotonylated BEX2 interacts with NDP52 and enhances mitophagy to modulate chemotherapeutic agent-induced apoptosis in non-small-cell lung cancer cells

Ning Mu et al. Cell Death Dis. .

Abstract

Brain expressed X-linked gene 2 (BEX2) encoded protein was originally identified to promote transcription by interacting with several transcription factors in the DNA-binding complexes. Recently, BEX2 was found to be localized in cytosol and/or mitochondria and regulate apoptosis in cancer cells and tumor growth. However, the molecular mechanism underlying its roles in cancer cells remains unclear. Here, we report that crotonylated BEX2 plays an important role in inhibiting chemotherapeutic agent-induced apoptosis via enhancing mitophagy in human lung cancer cells. BEX2 promotes mitophagy by facilitating interaction between NDP52 and LC3B. Moreover, BEX2 crotonylation at K59 is critical in the BEX2-mediated mitophagy in lung cancer cells. The K59R mutation of BEX2 inhibits mitophagy by affecting the interaction of NDP52 and LC3B. BEX2 expression is elevated after anticancer drug treatment, and its overexpression inhibits chemotherapy-induced apoptosis. In addition, inhibition of BEX2-regulated mitophagy sensitizes tumor cells to apoptosis. Furthermore, BEX2 promotes tumor growth and inhibits apoptosis by regulating mitophagy in vivo. We also confirm that BEX2 is overexpressed in lung adenocarcinoma and is associated with poor prognosis in lymph node metastasis-free cancer. Therefore, combination treatment with pharmaceutical approaches targeting BEX2-induced mitophagy and anticancer drugs may represent a potential strategy for NSCLC therapy.


Conflict of interest statement

The authors declare no competing interests.

Figures
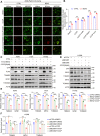
Fig. 1
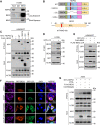
Fig. 1. BEX2 promotes mitophagy in NSCLC cells.
A, B A549 cells were co-transfected with HA-Parkin and mt-Keima, and then the cells were transfected with CTRL(pcDNA3.1) or BEX2. Cells were pre-treated with BafilomycinA1(20 nM), liensinine (20 μM), and 3-MA (5 mM) for 0.5 h then treated with CCCP (20 μM) for 6 h. Mitophagy flux was monitored by confocal microscopy. Green indicates mito-Keima fluorescence excited at 488 nm (measuring mitochondria with a neutral pH), red indicates mt-Keima fluorescence excited at 561 nm (measuring mitochondria with an acidic pH) (A). Quantification of the relative ratio of fluorescence intensity (561 nm: 488 nm) of the cells (B). Data are presented as the mean ± SD (n = 3 independent experiments, 20 cells per experiment), and statistical significance was assessed by two-way ANOVA. **P < 0.01, ns not significant. Scale bars: 10 μm. C A549, H157, and H1792 cells were transfected with GFP-Parkin and CTRL(pcDNA3.1) or BEX2, then cells were further incubated with CCCP (20 μM) for 6 h. Cell lysates were analyzed by western blotting with the indicated antibodies. D H1299 cells were transfected with GFP-Parkin and siCTRL or siBEX2#1, siBEX2#2, and then cells were further incubated with CCCP (20 μM) for 6 h. Cell lysates were analyzed by western blotting with the indicated antibodies. E The relative protein levels in A549, H157, and H1792 cells (C) were further evaluated by densitometry analysis using ImageJ software and quantified for the ratio of TIMM23/MFN1/TOMM20: ACTB. Data are presented as the mean ± SD (n = 3 independent experiments), and statistical significance was assessed by one-way ANOVA. ***P < 0.001. F The relative protein levels in H1299 cells (D) were further evaluated by densitometry analysis using ImageJ software and quantified for the ratio of TIMM23/MFN1/TOMM20: ACTB. Data are presented as the mean ± SD (n = 3 independent experiments), and statistical significance was assessed by one-way ANOVA. **P < 0.01, ***P < 0.001.
Fig. 2
Fig. 2. BEX2 interacts with NDP52 and LC3B to regulate mitophagy in NSCLC cells.
A Co-IP assays were carried out with the BEX2 antibody or IgG in H1299 cells followed by western blotting using anti-BEX2 and anti-NDP52 antibodies. B Schematic diagram of NDP52 and the domain-deleted constructs (top). Schematic diagram of BEX2; LIR, LC3-interacting region (bottom). C HEK293FT cells were co-transfected with MYC-NDP52 or MYC-tagged domain-deleted mutants of NDP52 together with CTRL (pcDNA3.1) or FLAG-BEX2, and then co-IP assays were carried out with an MYC antibody followed by western blotting using the indicated antibodies. D H1299 cells were transfected with CTRL (pcDNA3.1) or GFP-LC3, and then co-IP assays were carried out with GFP antibody followed by western blotting using anti-GFP and anti-BEX2 antibodies. E HEK293FT cells were transfected with FLAG-BEX2 or FLAG-tagged LIR-deleted mutants of BEX2 together with GFP-LC3B, and then co-IP assays were carried out with FLAG antibody followed by western blotting using anti-BEX2 and anti-GFP antibodies. F A549 cells were transfected with RFP-BEX2 and GFP-LC3, and then cells were pre-treated with BafilomycinA1(20 nM) and Liensinine (20 μM) for 0.5 h then incubated with CCCP (20 μM) for 6 h. MitoTracker Deep Red labeled mitochondria. The co-localization with BEX2, LC3 and mitochondria was monitored by confocal microscopy. G A549 cells were co-transfected with MYC-NDP52 and CTRL(pcDNA3.1) or BEX2, and then the cells were incubated with CCCP (20 μM) for 6 h. Cell lysates were incubated with an MYC antibody by co-IP assays followed by western blotting using the indicated antibodies.
Fig. 3
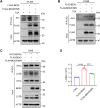
Fig. 3. Crotonylation modification of BEX2 is required for mitophagy regulation.
A IP analyses for FLAG and crotonylation of BEX2 in H1299 cells expressing CTRL(pcDNA3.1), FLAG-BEX2 or FLAG-BEX2 K59R with TSA (3 μM, 12 h) treatment. B IP analyses for FLAG and acetylation of BEX2 in H1299 cells expressing CTRL(pcDNA3.1), FLAG-BEX2 or FLAG-BEX2 K59R with TSA (3 μM, 12 h) treatment. C, D A549 cells were co-transfected with MYC-NDP52 and BEX2 or BEX2K59R, and then the cells were incubated with CCCP (20 μM) for 6 h. Cell lysates were incubated with MYC antibody by co-IP assays followed by western blotting using the indicated antibodies (C). The relative protein levels were further evaluated by densitometry analysis using ImageJ software and quantified for the ratio of LC3B-II: MYC in IP (D). Data are presented as the mean ± SD (n = 3 independent experiments), and statistical significance was assessed by one-way ANOVA. ***P < 0.001, ****P < 0.0001.
Fig. 4
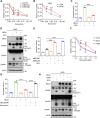
Fig. 4. BEX2 inhibits chemotherapeutic agent-induced apoptosis.
A CCK-8 assays were performed in stably transduced H1299 cells, which were treated with doxorubicin (0, 0.25, 0.5, 1 μM) for 24 h. Data are presented as the mean ± SD (n = 3), and statistical significance was assessed by two-way ANOVA. ***P < 0.001. B CCK-8 assays were performed in stably transduced A549 cells which were treated with doxorubicin (0, 0.25, 0.5, 1 μM) for 24 h. Data are presented as the mean ± SD (n = 3), and statistical significance was assessed by two-way ANOVA. **P < 0.01, ***P < 0.001. C A549 cells were transfected with CTRL(pcDNA3.1) or BEX2 and then treated with doxorubicin for 24 h, cells were stained by Annexin V-FITC/7-AAD and flow cytometry analysis. Data are presented as the mean ± SD (n = 3), and statistical significance was assessed by two-tailed Student’s t-test. ***P < 0.001. D A549 cells were transfected with CTRL(pcDNA3.1) or BEX2 and then incubated with doxorubicin (DOX, 1 μM) for 24 h. Cell lysates were analyzed by western blotting with the indicated antibodies. E H1299 cells were transfected with siCTRL or siBEX2 and then treated with doxorubicin for 24 h, cells were stained by Annexin V-FITC/7-AAD and flow cytometry analysis. Data are presented as the mean ± SD (n = 3), and statistical significance was assessed by two-tailed Student’s t-test. ***P < 0.001. F CCK-8 assays were performed in stably transduced A549 cells, which were treated with doxorubicin (0, 0.25, 0.5, 1 μM) for 24 h. Data are presented as the mean ± SD (n = 3), and statistical significance was assessed by two-way ANOVA. **P < 0.01, ns, not significant for the indicated comparison. G A549 cells were transfected with CTRL(pcDNA3.1), BEX2 and BEX2K59R. After treatment with doxorubicin for 24 h, cells were stained with Annexin V-FITC/7-AAD and detected by flow cytometry analysis. Data are presented as the mean ± SD (n = 3), and statistical significance was assessed by two-tailed Student’s t-test. ****P < 0.0001. H A549 cells were transfected with CTRL(pcDNA3.1), BEX2 or BEX2K59R, and then incubated with doxorubicin (DOX, 1 μM) for 24 h. Cell lysates were analyzed by western blotting with the indicated antibodies.
Fig. 5
Fig. 5. Inhibition of BEX2-regulated mitophagy sensitizes tumor cells to chemotherapy-induced apoptosis.
A A549 cells stably overexpressing BEX2 were pretreated with liensinine (Lien, 20 μM) for 0.5 h and then combined with doxorubicin for the next 24 h. Hoechst 33342 staining analysis of cell apoptosis. Data are presented as the mean ± SD (n = 3 independent experiments, 20 cells per experiment), and statistical significance was assessed by two-tailed Student’s t-test. ***P < 0.001. Scale bar: 50 μm. BD A549 cells were transfected with BEX2 and NDP52 siRNA, and then treated with doxorubicin for 24 h. Cell lysates were analyzed by western blotting with the indicated antibodies (B). Cells were stained with Annexin V-FITC/7-AAD and detected by flow cytometry analysis (C, D). Data are presented as the mean ± SD (n = 3), and statistical significance was assessed by two-tailed Student’s t-test. ****P < 0.0001.
Fig. 6
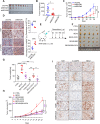
Fig. 6. BEX2 promotes tumor growth in vivo.
AC BALB/c nude mice were injected subcutaneously with stably transduced H1299 cells. The transplanted tumors were removed and photographed (A). Tumors were isolated, and the weight (B) and growth (C) were measured. D Representative immunohistochemical staining for Ki67 and cleaved CASP3 in tumor tissues obtained from each experimental group. Dot plots show the mean value for the percentage of Ki67 and cleaved CASP3-positive cells with statistical evaluation (n = 4). Scale bars: 50 μm. E Schematic showing the model of xenografts. A549NC, A549BEX2 or A549BEX2K59R cells were injected subcutaneously into the BALB/c nude mice (n = 5 per group). After tumor inoculation for 6 days, doxorubicin (3 mg/kg) was intraperitoneally injected at intervals of 4 days. The control groups were injected with saline. After 21 days, the mice were then euthanized. FH The transplanted tumors were removed and photographed (F). Tumors were isolated, and the weight (G) and growth (H) were measured. I Immunohistochemistry analysis showing Ki67, cleaved CASP3 and BEX2 expression in the indicated tumor tissues. Scale bar: 50 μm. Data are presented as the mean ± SEM, and statistical significance was assessed by two-way ANOVA (BD, G, H), *P < 0.05, **P < 0.01, ***P < 0.001.
Fig. 7
Fig. 7. BEX2-regulated mitophagy promotes tumor growth in vivo.
A Schematic showing the model of xenografts. BALB/c nude mice were injected subcutaneously with stably transduced A549NC or A549BEX2 cells. After 6 days, mice were treated with liensinine (Lien, 60 mg/kg) daily and doxorubicin (DOX, 2 mg/kg) were intraperitoneally injected at intervals of 4 days. After 30 days, the mice were then euthanized. BD The transplanted tumors were removed and photographed (B). Tumors were isolated, and the weight (C) and growth (D) were measured. E Immunohistochemistry analysis showing Ki67, cleaved CASP3 and BEX2 expression in the indicated tumor tissues. Scale bar: 50 μm. F Representative immunofluorescence staining detection for determination of the co-localization of LC3B and TOMM20 by confocal microscopy. Scale bars: 10 μm. G Representative immunofluorescence staining detection for determination of the co-localization of LC3B and NDP52 by confocal microscopy. Scale bars: 10 μm. Data are presented as the mean ± SEM, and statistical significance was assessed by two-way ANOVA (C, D), *P < 0.05, **P < 0.01, ***P < 0.001, ****P < 0.0001.
Fig. 8
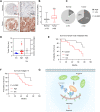
Fig. 8. BEX2 is upregulated in lung adenocarcinoma and high BEX2 expression level is associated with poor prognosis in lymph node metastasis-free cancer.
A Representative IHC images showed the protein levels of BEX2 in TMA. B Immunoreactivity scores (IRS) of BEX2 in normal and tumor tissues shown as a box plot. *** P < 0.001. C Percentages of low and high expression of BEX2 in normal and tumor tissues are shown as a pie chart. P < 0.0001. D Tumor size (>5 cm) of low and high expression of BEX2 in LUAD tissues are shown as a dot plots. *P < 0.05. E, F Survival of lymph node metastasis-free was compared between LUAD patients with low and high level of BEX2 (n = 11, low BEX2 levels; n = 16, high BEX2 levels) (E). Survival of clinical stage (I + II) was compared between LUAD patients with low and high level of BEX2 (n = 13, low BEX2 levels; n = 27, high BEX2 levels) (F). Survival data were analyzed by the Kaplan-Meier method and log-rank test. G Schematic diagram of BEX2-mediated mitophagy activation to inhibit apoptosis in NSCLC cells.

References

    1. Naderi A. Molecular functions of brain expressed X-linked 2 (BEX2) in malignancies. Exp Cell Res. 2019;376:221–6. doi: 10.1016/j.yexcr.2019.02.014. - DOI - PubMed
    1. Tamai K, Nakamura-Shima M, Shibuya-Takahashi R, Kanno SI, Yasui A, Mochizuki M, et al. BEX2 suppresses mitochondrial activity and is required for dormant cancer stem cell maintenance in intrahepatic cholangiocarcinoma. Sci Rep. 2020;10:21592. doi: 10.1038/s41598-020-78539-0. - DOI - PMC - PubMed
    1. Han C, Liu H, Liu J, Yin K, Xie Y, Shen X, et al. Human Bex2 interacts with LMO2 and regulates the transcriptional activity of a novel DNA-binding complex. Nucleic Acids Res. 2005;33:6555–65. doi: 10.1093/nar/gki964. - DOI - PMC - PubMed
    1. Manford AG, Mena EL, Shih KY, Gee CL, McMinimy R, Martinez-Gonzalez B, et al. Structural basis and regulation of the reductive stress response. Cell. 2021;184:5375–90.e16. doi: 10.1016/j.cell.2021.09.002. - DOI - PMC - PubMed
    1. Naderi A, Teschendorff AE, Beigel J, Cariati M, Ellis IO, Brenton JD, et al. BEX2 is overexpressed in a subset of primary breast cancers and mediates nerve growth factor/nuclear factor-kappaB inhibition of apoptosis in breast cancer cell lines. Cancer Res. 2007;67:6725–36. doi: 10.1158/0008-5472.CAN-06-4394. - DOI - PubMed

Publication types