. 2023 Sep 30;14(1):6109.
doi: 10.1038/s41467-023-41683-y.

IFNγ-Stat1 axis drives aging-associated loss of intestinal tissue homeostasis and regeneration

Affiliations

IFNγ-Stat1 axis drives aging-associated loss of intestinal tissue homeostasis and regeneration

Omid Omrani et al. Nat Commun. .

Erratum in

Abstract

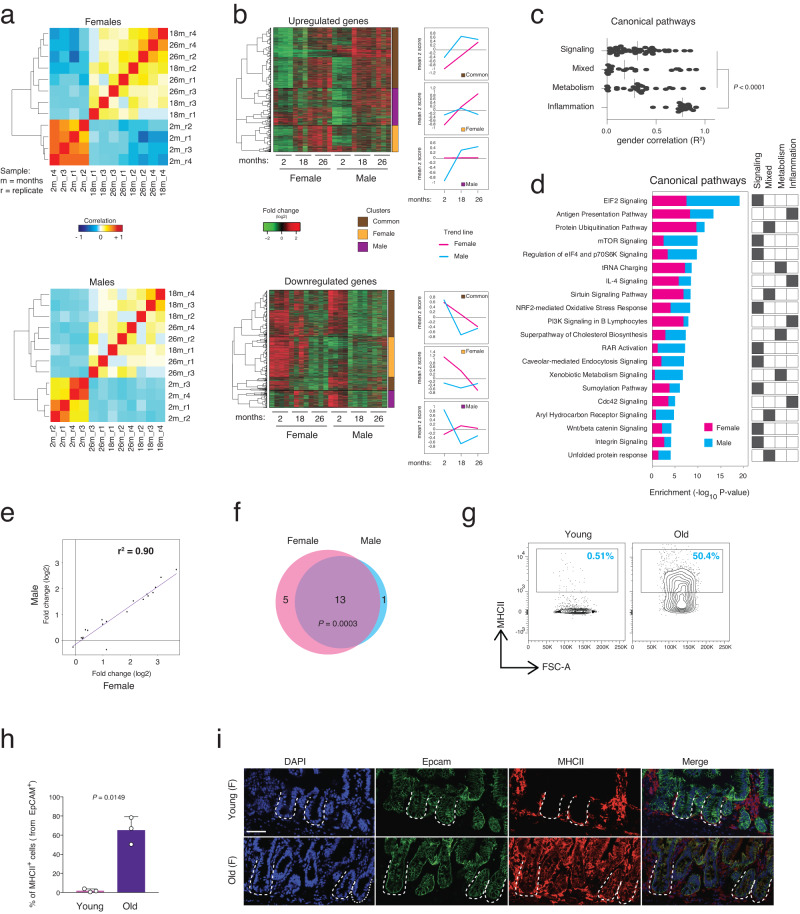
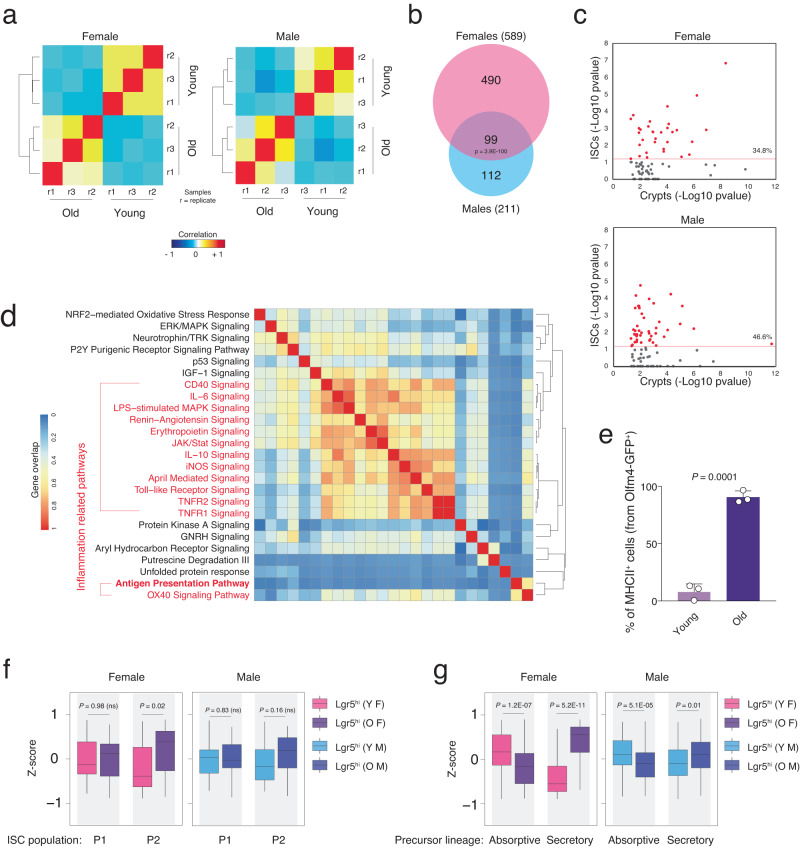
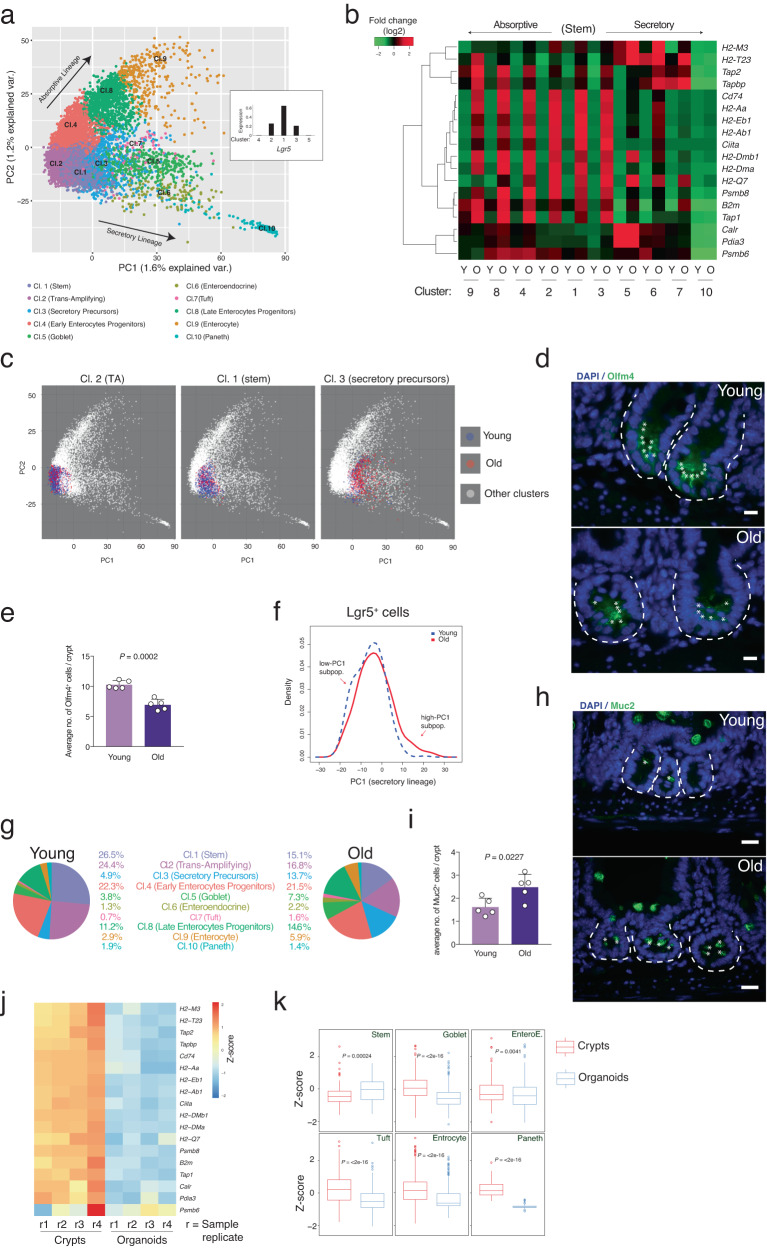
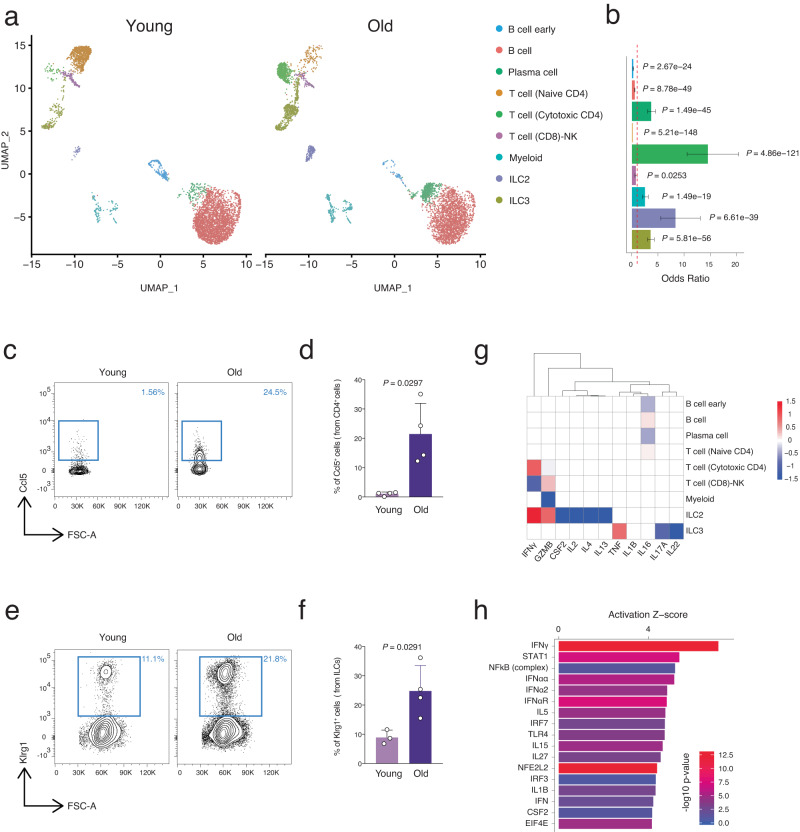
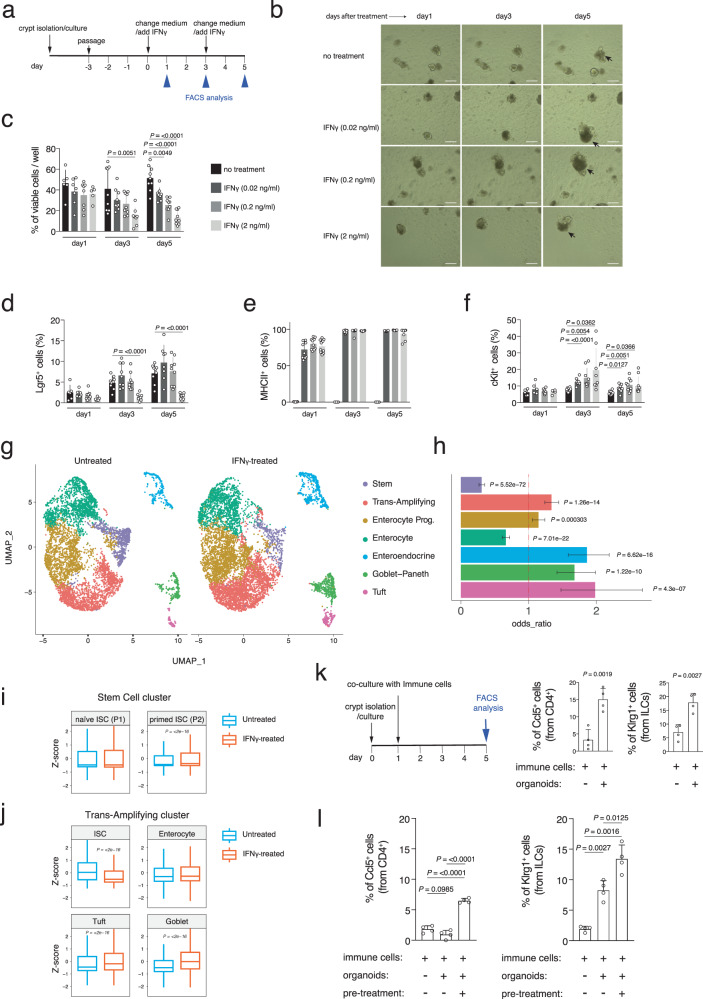
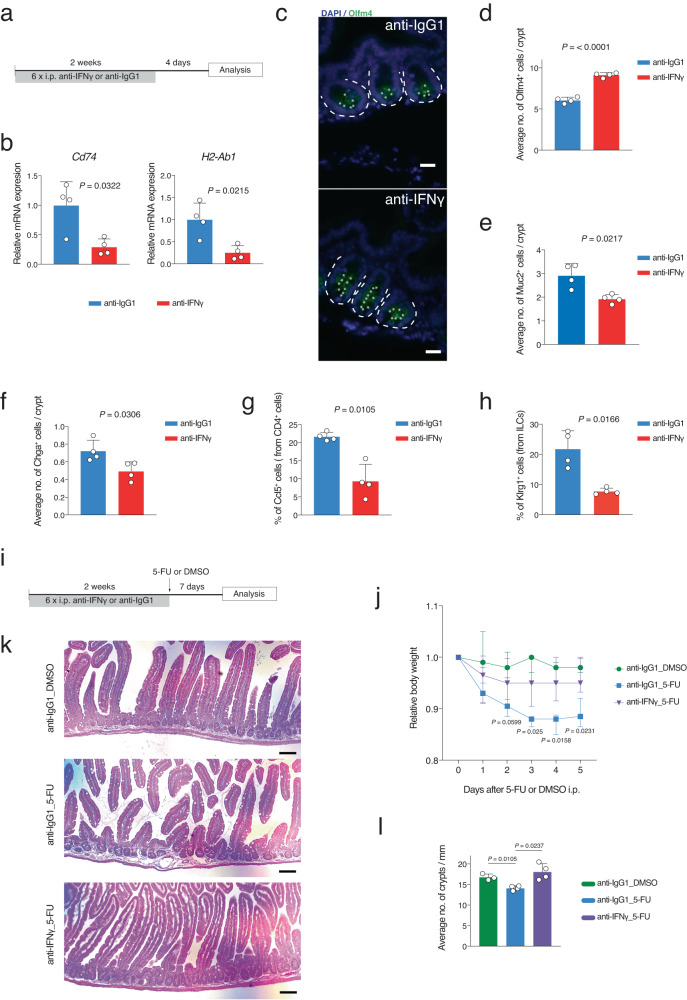
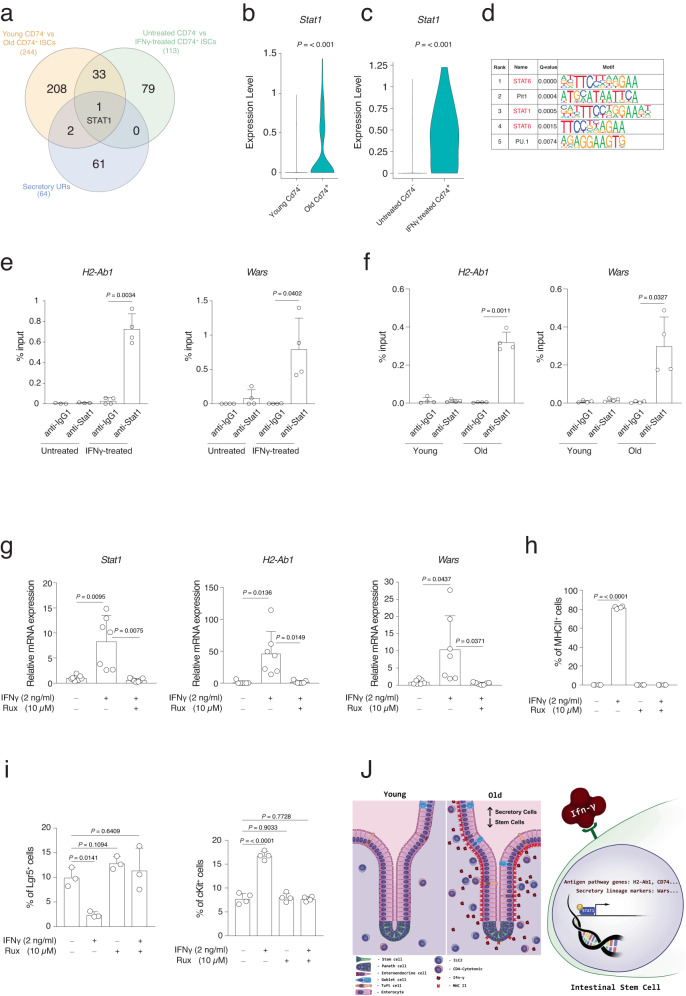
The influence of aging on intestinal stem cells and their niche can explain underlying causes for perturbation in their function observed during aging. Molecular mechanisms for such a decrease in the functionality of intestinal stem cells during aging remain largely undetermined. Using transcriptome-wide approaches, our study demonstrates that aging intestinal stem cells strongly upregulate antigen presenting pathway genes and over-express secretory lineage marker genes resulting in lineage skewed differentiation into the secretory lineage and strong upregulation of MHC class II antigens in the aged intestinal epithelium. Mechanistically, we identified an increase in proinflammatory cells in the lamina propria as the main source of elevated interferon gamma (IFNγ) in the aged intestine, that leads to the induction of Stat1 activity in intestinal stem cells thus priming the aberrant differentiation and elevated antigen presentation in epithelial cells. Of note, systemic inhibition of IFNγ-signaling completely reverses these aging phenotypes and reinstalls regenerative capacity of the aged intestinal epithelium.


Conflict of interest statement

The authors declare no competing interests

Figures

Fig. 1
Fig. 1. Major histocompatibility complex class II (MHCII) is strongly overexpressed during aging in whole intestinal crypts in both genders.
a Hierarchical clustering and heatmap of the Pearson correlation of the RNA-seq datasets of mouse intestinal crypts at the indicated ages. n = 4 mice per group were analyzed. b Left panels showing hierarchical clustering and heatmap of the expression level of the differentially expressed genes (DEGs) in the same datasets as in Fig. 1a. Right panels showing line-plots of DEG regulation (mean of gene base scaled count) during aging that are divided into indicated clusters of genes. c Point plot of the gender correlation (R2) of the DEGs found in each gene ontology (GO) pathways divided by the indicated main GO categories. Vertical lines indicate median. P value was calculated by Mann-Whitney two-tail test. d Stacked bar chart of −log10 enrichment p value (Fisher two-sided exact test) in the most relevant GO pathways found dysregulated in aging. GO categories were assigned by following the clustering in Fig. S1d. e Scatter plot of the log2 fold change of the DEGs during aging in the antigen-presenting pathway. r = coefficient of determination. f Venn diagram of the number of the DEGs in female and male mice in antigen-presenting pathway as in Fig. 1e. P value was calculated by hypergeometric two-sided distribution test. High P value indicating a significant gene overlap. g Representative FACS plots showing percentages of MHCII+ cells in the indicated conditions. h The bar chart shows the percentage of MHCII+ cells from EpCAM+ cells in the indicated groups. n = 3 mice per group were analyzed. Error bars represent SD. P value was calculated by two-sided Welch’s t test. i Representative pictures of Major Histocompatibility Complex class II (MHCII-IA) stain the H2-Aa and H2-Ab1 heterodimer of the Antigen Presentation Pathway in young and aged intestinal crypts. The dotted lines indicate the crypt structure. Scale bar, 50 µm.
Fig. 2
Fig. 2. Inflammation-related pathways are enriched at the intestinal stem cell level.
a Hierarchical clustering and heatmap of the Pearson correlation of the RNA-seq datasets of Lgr5hi intestinal stem cell for indicated ages. n = 3 mice per group were analyzed. b Venn diagram of the DEGs found in the RNA-seq of the Lgr5hi intestinal stem cells for the indicated genders. P value was calculated by two-sided hypergeometric distribution test. c Scatter plot of the −log10 p values of the enrichment score for the GO pathways found significantly enriched in the whole crypt RNA-seq. The scatter plots show the correlation between enrichment scores found in Lgr5hi intestinal stem cells (Y-axis) versus whole crypts (X axis) RNA-seq. Percentage indicates the pathways found statistically enriched both in Lgr5hi intestinal stem cells and whole crypts. d Hierarchical clustering and heatmap of the gene overlap correlation of the top 25 GO pathways found enriched in the Lgr5hi intestinal stem cells during aging. Red-marked pathways are related to immune system signaling and inflammation. e The bar chart shows the percentage of MHCII+ cells from Olfm4+ intestinal stem cells in the indicated groups. n = 3 mice per group were analyzed. Error bars represent the SD. P value was calculated by two-sided Welch’s t test. f, g Box plot of geneset enrichment analysis of the indicated gene datasets in the Lgr5hi intestinal stem cells purified from female (F) and male (M) mice, young (Y) and old (O) mice. n = 3 mice per group were analyzed. P value was calculated by two-sided Wilcoxon paired test. ns  not significant.
Fig. 3
Fig. 3. Intestinal crypt cell composition changes during aging.
a Scatter plot of PC1 and PC2 values of the single cell RNA-seq (scRNA-seq) dataset (both the young and the old RNA-seq merged). Each cell is colored accordingly to its respective cluster (Cl.). Clusters are calculated by K-means. The small central panel represents the average of normalized read counts of the Lgr5 expression value in clusters 1–5. b Hierarchical clustering and heatmap of the expression level of the DEGs in the Antigen Presentation Pathway in the different clusters found in the scRNA-seq of young (Y) or old (O) mouse intestinal crypts. c Scatter plot of PC1 and PC2 values of the single cell RNA-seq (scRNA-seq) dataset (both the young and the old RNA-seq merged). Cells belonging to the indicated clusters are colored in blue (young-derived cells) or in red (old derived cells). d Representative pictures of anti-Olfm4 staining in young and aged proximal small intestine. Scale bar 20 µm. The dotted lines indicate the crypt structure. e The bar chart shows the average number of the Olfm4+ cells per crypts in the indicated groups. n = 5 mice per group were analyzed. Error bars represent the SD. P value was calculated by two-sided Welch’s t test. f Line-plot of the cell population density of the Lgr5-expressing cells (Lgr5+) along the PC1 axis measured by the scRNA-seq experiment. Old Lgr5+ cells show a shift in the PC1 profile with respect to the young ones. g Representative pie charts showing the percentage of cells belonging to each cluster in indicated ages. h Representative pictures of anti-Muc2 staining in the proximal small intestine of indicated ages. Scale bar 20 µm. The dotted lines indicate the crypt structure. i The bar chart shows the average number of the Muc2+ cells in the indicated ages. n = 5 mice per group were analyzed. Error bars represent the SD. P value was calculated by two-sided Welch’s t test. j Heatmap of the expression level (scaled by gene in the row) of the DEGs in the Antigen Presentation Pathway in 2 weeks cultured intestinal organoids. n = 4 mice per group. k Box plot of geneset enrichment analysis of the indicated gene datasets from each cluster as in j from in vivo proximal intestinal crypts and in vitro grown organoids. P value was calculated by two-sided Wilcoxon non-paired test.
Fig. 4
Fig. 4. Aging lamina propria immune cell composition changes towards pro-inflammatory condition.
a UMAP projection of all 8997 immune cells (4423 young cells and 4574 old cells) presenting nine different clusters, identified via shared nearest neighbor modularity optimization-based clustering algorithm, followed by merging of similar clusters. n 3 mice per group were analyzed. b Bar chart of odds ratio with 95% confidence interval showing the relative abundance of different immune cells changing in aging. P value was calculated by two-sided hypergeometric test. c Representative FACS plots showing percentages of CCL5+ CD4 T (cytotoxic) cells in the indicated ages. d The bar chart shows the percentage of CCL5+ cells from CD4 T cells in the indicated ages. n = 4 mice per group were analyzed. Error bars represent the SD. P value was calculated by two-sided Welch’s t test. e Representative FACS plots showing percentages of Klrg1+ ILC2s in the indicated ages. f The bar chart shows the percentage of Klrg1+ ILC2s in the indicated ages. n = 3 (young) and n = 4 (old) mice per group were analyzed. Error bars represent the SD. P value was calculated by two-sided Welch’s t test. g Hierarchical clustering and heatmap of gene expression for identified cytokines in our scRNA-seq datasets. h Upstream regulators associated with the DEGs from RNA-seq of intestinal crypts cells during aging. X axis shows the activation Z score of each upstream regulator, and color code shows enrichment P value (−log10). P value is calculated using the right-tailed Fisher Exact Test.
Fig. 5
Fig. 5. IFNγ treatment of intestinal organoids mimics the intestinal crypt aging phenotype.
a Experimental scheme of IFNγ treatment of intestinal organoids. b Brightfield images of intestinal organoids that were treated with different concentration of IFNγ for 5 days. Non-treated cultures served as control. Apoptotic cells are indicated by arrow. Scale bar 200 µm. cf Time-course analysis of organoids stimulated with different concentration of IFNγ for 5 days. Dissociated organoid cells were analyzed by FACS after cKit, MHCII, and DAPI staining. c viable cell percentage, d Lgr5+ cell percentage, e MHCII+ cell percentage, and f cKit+ cell percentage. Each dot represents one mouse. n = 9 mice per group were analyzed. Error bars represent the SD. P value was calculated by two-sided Welch’s t test. g UMAP projection of organoid culture derived EpCAM+ cells presenting seven different clusters, clustered via shared nearest neighbor modularity optimization-based clustering algorithm. Clusters were identified to epithelial cell types by using expressed markers. n 3 mice per group were analyzed. h Bar chart of odds ratio with 95% confidence interval showing the relative abundance of different epithelial cells changing after IFNγ treatment. P value was calculated by two-sided hypergeometric test. i, j Boxplots of geneset enrichment analyses of the indicated gene datasets in the in vitro treated intestinal organoids treated with 2 ng/ml IFNγ for 24 h. P value was calculated by two-sided Wilcoxon non-paired test. k The bar charts show the percentage of Ccl5+ CD4 Cytotoxic T cells (left panel) and Klrg1+ ILC2s (right panel) in the indicated conditions. Organoids were derived from old mice. n = 4 mice per group were analyzed. Error bars represent the SD. P value was calculated by two-sided Welch’s t test. l The bar charts show the percentage of Ccl5+ CD4 Cytotoxic T cells (left panel) and Klrg1+ ILC2s (right panel) in the indicated conditions. Organoids were derived from young mice. n = 4 mice per group were analyzed. Error bars represent the SD. P value was calculated by two-sided Welch’s t test.
Fig. 6
Fig. 6. In vivo IFNγ inhibition in aged mice rescues the aging-induced alteration in intestinal crypt cells.
a Schematic representation of IFNγ inhibition experiment. Anti-IFNγ antibody (25 mg/kg) was injected intraperitoneally (i.p.) for two weeks (3 injections per week) in old mice. Mice were sacrificed for organ harvest 4 days after the last injection. Anti-IgG1 antibody were used as control. b qRT-PCR validation of Cd74 and H2-Ab1 gene expression levels in indicated conditions. n = 4 mice per group were analyzed. Error bars represent the SD. P value was calculated by two-sided Welch’s t test. c Representative pictures of anti-Olfm4 staining in indicated conditions. Scale bar, 20 µm. The dotted lines indicate the crypt structure. df The bar charts show the immunofluorescence quantification of the Olfm4+, Muc2+, and Chga+ cells in the indicated conditions. n = 4 mice per group were analyzed. Error bars represent the SD. P value was calculated by two-sided Welch’s t test. g, h The bar charts show the percentage of Ccl5+ CD4 T (cytotoxic) and Klrg1+ ILC2 cells quantified by FACS analysis in the indicated conditions. n = 4 mice per group were analyzed. Error bars represent the SD. P value was calculated by two-sided Welch’s t test. i Schematic representation of the in vivo IFNγ inhibition experiment for regeneration analysis. Anti-IFNγ antibody (25 mg/kg) was injected intraperitoneally (i.p.) every second day. 3 injections per week for 2 weeks were performed. One day after the last injection, 5-fluorouracil (5FU; 150 mg/kg) or DMSO as control were intraperitoneally (i.p.) injected. j Body weights of treated old animals shown as mean ± SD. n = 4 mice per group were analyzed. P value was calculated by two-sided Welch’s t test. k Representative picture of H&E-stained longitudinal sections of the proximal part of the intestine from indicated conditions. Scale bars 100 µm. l The bar chart shows the average number of crypts per millimeter of the proximal part of the small intestine of the indicated groups. n = 4 mice per group were analyzed. Error bars represent the SD. P value was calculated by two-sided Welch’s t test.
Fig. 7
Fig. 7. Stat1 transcription factor mediates the IFNγ effect during aging.
a Gene set A: DEGs using young CD74 intestinal stem cell versus old CD74+ intestinal stem cell in crypts, Gene set B: DEGs using control CD74 intestinal stem cell versus IFNγ treated CD74+ intestinal stem cell in organoids, Gene set C: IPA-predicted upstream regulators for secretory lineage. b, c Box plot of Stat1 expression in the indicated groups. P value was calculated by two-tail Wilcoxon rank sum test. d Transcription factor and binding motif prediction on the promoters of the gene markers of the secretory cells in intestine. Top5 significant predicted motifs (q value < 0.001) are shown, indicating STAT6 and STAT1 were significantly enriched to bind secretory lineage gene promoters. P values was calculated by two-tail binomial distribution. Q value was Benjamini-adjusted p value. e, f ChIP-qRT-PCR analysis of the ChIP of Stat1 on H2-Ab1 and Wars promoters in e organoids treated or untreated with IFNγ (2 ng/ml) for 24 h or f intestinal crypts of young or old mice. Each dot represents one mouse. n = 4 mice per group were analyzed. Error bars represent the SD. P value was calculated by paired two-tail t test. g qRT-PCR analysis of Stat1, H2-Ab1, and Wars gene expression level in the indicated conditions. n = 7 mice per group were analyzed. Error bars represent the SD. P value was calculated by two-sided Welch’s t test. h The bar chart shows the percentage of MHCII+ cells in the indicated conditions. Organoids treated with IFNγ (2 ng/ml) with or without Ruxolitinib (Rux) for 3 days. n = 4 mice per group were analyzed. Error bars represent the SD. P value was calculated by two-sided Welch’s t test. i The bar chart shows the percentage of Lgr5+ cells and cKit+ cells in the indicated conditions. n = 4 mice per group were analyzed. Error bars represent the SD. P value was calculated by two-sided Welch’s t test. j Graphical abstract modeling aging-induced alteration in intestinal tissue.

References

    1. Barnett K, et al. Epidemiology of multimorbidity and implications for health care, research, and medical education: a cross-sectional study. Lancet. 2012;380:37–43. - PubMed
    1. Marengoni A, et al. Aging with multimorbidity: a systematic review of the literature. Ageing Res. Rev. 2011;10:430–439. - PubMed
    1. Barker N, et al. Identification of stem cells in small intestine and colon by marker gene Lgr5. Nature. 2007;449:1003–1007. - PubMed
    1. Nalapareddy K, et al. Canonical Wnt signaling ameliorates aging of intestinal stem cells. Cell Rep. 2017;18:2608–2621. - PMC - PubMed
    1. Mihaylova MM, et al. Fasting activates fatty acid oxidation to enhance intestinal stem cell function during homeostasis and aging. Cell Stem Cell. 2018;22:769–778.e4. - PMC - PubMed

Publication types

Substances