. 2023 Sep 30;13(1):16481.
doi: 10.1038/s41598-023-43685-8.

Quantifying the heterogeneous impact of lockdown policies on different socioeconomic classes during the first COVID-19 wave in Colombia

Affiliations

Quantifying the heterogeneous impact of lockdown policies on different socioeconomic classes during the first COVID-19 wave in Colombia

Pablo Valgañón et al. Sci Rep. .

Abstract

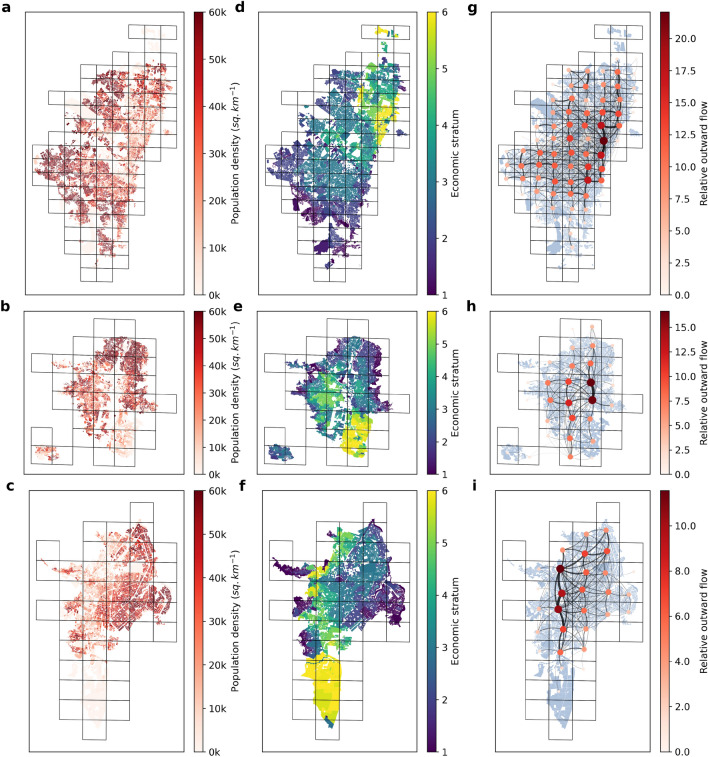
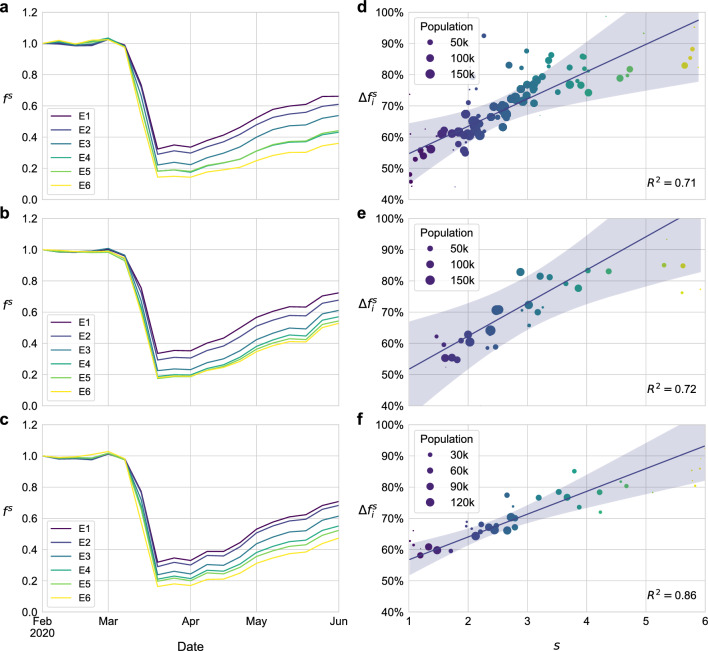
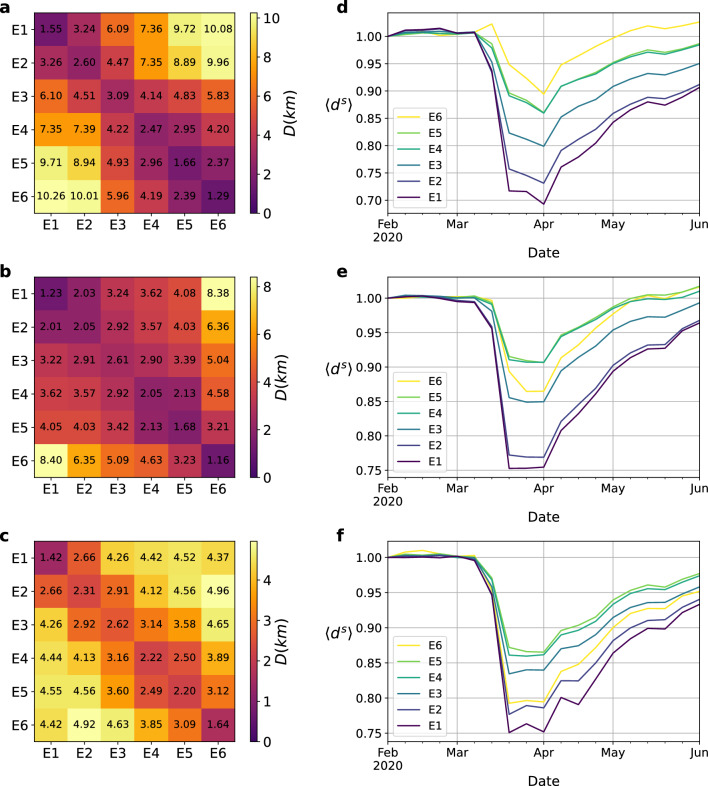
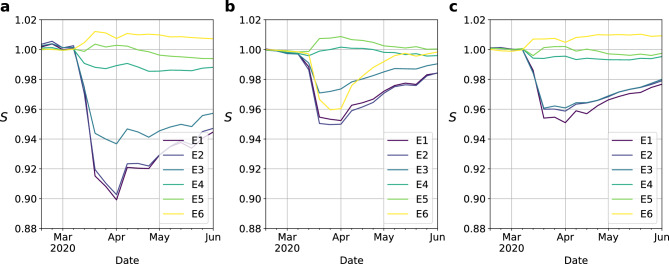
In the absence of vaccines, the most widespread reaction to curb the COVID-19 pandemic worldwide was the implementation of lockdowns or stay-at-home policies. Despite the reported usefulness of such policies, their efficiency was highly constrained by socioeconomic factors determining their feasibility and their associated outcome in terms of mobility reduction and the subsequent limitation of social activity. Here we investigate the impact of lockdown policies on the mobility patterns of different socioeconomic classes in the three major cities of Colombia during the first wave of the COVID-19 pandemic. In global terms, we find a consistent positive correlation between the reduction in mobility levels and the socioeconomic stratum of the population in the three cities, implying that those with lower incomes were less capable of adopting the aforementioned policies. Our analysis also suggests a strong restructuring of the mobility network of lowest socioeconomic strata during COVID-19 lockdown, increasing their endogenous mixing while hampering their connections with wealthiest areas due to a sharp reduction in long-distance trips.


Conflict of interest statement

The authors declare no competing interests.

Figures

Figure 1
Figure 1
(ac) Population density maps at the level of census block, corresponding to the 2018 census. (df) Average economic strata of the different households at the level of census block, ranging from stratum 1 typically gathering those individuals with lowest economic income to stratum 6 associated with wealthiest population. (gi) Schematic representation of the mobility network of each city with a spatial resolution of level 12 s2cells (see “Methods” for further explanations). Both color and size of nodes are proportional to the total number of trips departing from a given area whereas the edge thickness reflects the the number of trips recorded between two locations. From top to bottom, the information shown corresponds to Bogotá, Medellín and Santiago de Cali respectively.
Figure 2
Figure 2
(ac) Time evolution of the aggregated number of trips for each stratum (color code), re-scaled to a reference value set on 2020-02-02, corresponding to the pre-pandemic scenario. (df) Reduction in the trips departing from each patch on the week starting from 2020-03-29 compared to a baseline scenario (2020-02-02) according to the average economic stratum of its residents. The size of the dots denotes the number of residents in the corresponding patch whereas the color encodes the stratum information ranging from poorest areas (blue) to the richest ones (yellow). The shaded area is the prediction interval of the linear regression, and it represents the standard error of the predictions from the model, obtained with the member var_pred_mean from the Python library statsmodels. From top to bottom, the information shown corresponds to Bogotá, Medellín and Santiago de Cali respectively.
Figure 3
Figure 3
(ac) Distance matrices D encoding the average distance of trips departing from areas associated with one stratum (rows) and arriving in going to stratum s2 areas (see “Methods” for an explanation of their computation). These values are computed using mobility patterns from the week starting on 02-02-2020, which corresponds to a pre-pandemic scenario. (df) Time evolution of the average distance of travels made by individuals belonging to each stratum s, ds (color code). Note that the values represented have been re-scaled by those corresponding to the pre-pandemic scenario. From top to bottom, the information shown corresponds to Bogotá, Medellín and Cali respectively.
Figure 4
Figure 4
(ac) Mixing matrices M encoding the fraction of trips corresponding to a certain stratum (rows) arriving in areas associated with another stratum (columns) on 2020-02-02 (pre-pandemic scenario). The sum of the elements on each row is equal to one. (df) Re-normalized mixing matrices MN based on the proportion of the population belonging to each stratum, as detailed in the “Methods” section. In these matrices, entries above (below) one denote a higher (lower) tendency to interact with a given stratum than the one expected in a well-mixed population. (gi) Relative change of these matrices ΔM comparing a lockdown scenario, corresponding to the week starting on 2020-03-29, with a pre-pandemic scenario, corresponding to the week starting on 2020-02-02. From top to bottom, the information shown corresponds to the cities of Bogotá, Medellín and Santiago de Cali respectively.
Figure 5
Figure 5
Time evolution of the relative entropy S for each row of the mixing matrix, which encodes the socioeconomic structure of the destinations visited by each stratum (color code), in Bogotá (a), Medellín (b) and Cali (c) respectively. Note that the values represented have been re-scaled to those corresponding to the week starting on 02-02-2020, corresponding to a pre-pandemic scenario. Let us note that lower entropy values reflect more concentrated flows towards a small number of economic strata.

References

    1. Estrada E. Covid-19 and sars-cov-2, modeling the present, looking at the future. Phys. Rep. 2020;869:1–51. - PMC - PubMed
    1. Perra N. Non-pharmaceutical interventions during the covid-19 pandemic: A review. Phys. Rep. 2021;913:1–52. - PMC - PubMed
    1. Flaxman S, et al. Estimating the effects of non-pharmaceutical interventions on Covid-19 in Europe. Nature. 2020;584:257–261. - PubMed
    1. Haug N, et al. Ranking the effectiveness of worldwide covid-19 government interventions. Nat. Hum. Behav. 2020;4:1303–1312. - PubMed
    1. Cheng Y, et al. Face masks effectively limit the probability of sars-cov-2 transmission. Science. 2021;372:1439–1443. - PMC - PubMed

Publication types