. 2023 Sep 30;20(1):222.
doi: 10.1186/s12974-023-02903-w.

Inhibition of neutrophil extracellular trap formation ameliorates neuroinflammation and neuronal apoptosis via STING-dependent IRE1α/ASK1/JNK signaling pathway in mice with traumatic brain injury

Affiliations

Inhibition of neutrophil extracellular trap formation ameliorates neuroinflammation and neuronal apoptosis via STING-dependent IRE1α/ASK1/JNK signaling pathway in mice with traumatic brain injury

Guihong Shi et al. J Neuroinflammation. .

Abstract

Background: Neuroinflammation is one of the most important pathogeneses in secondary brain injury after traumatic brain injury (TBI). Neutrophil extracellular traps (NETs) forming neutrophils were found throughout the brain tissue of TBI patients and elevated plasma NET biomarkers correlated with worse outcomes. However, the biological function and underlying mechanisms of NETs in TBI-induced neural damage are not yet fully understood. Here, we used Cl-amidine, a selective inhibitor of NETs to investigate the role of NETs in neural damage after TBI.

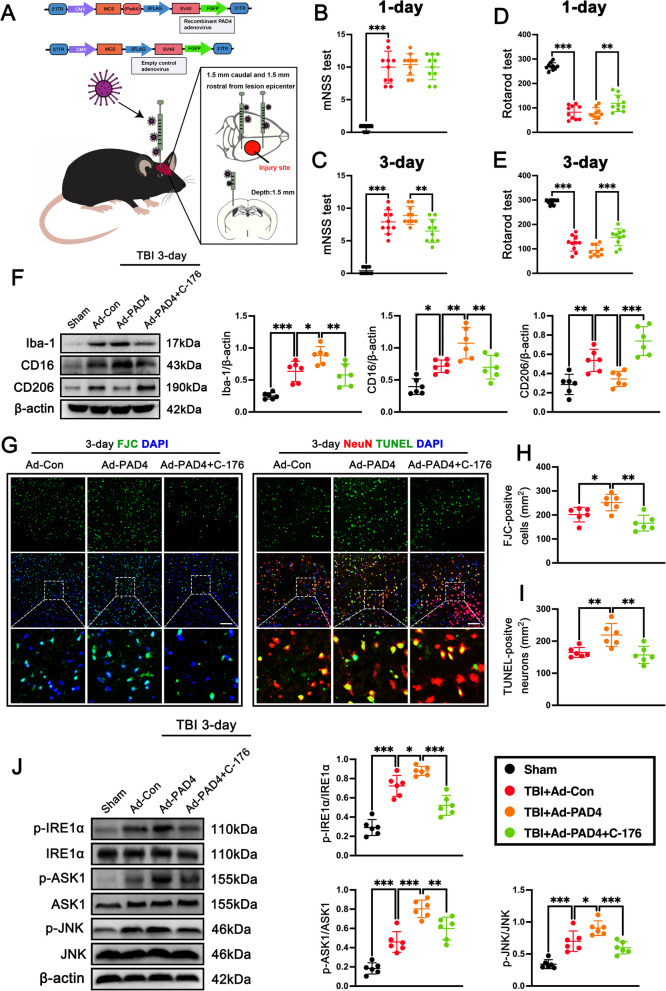
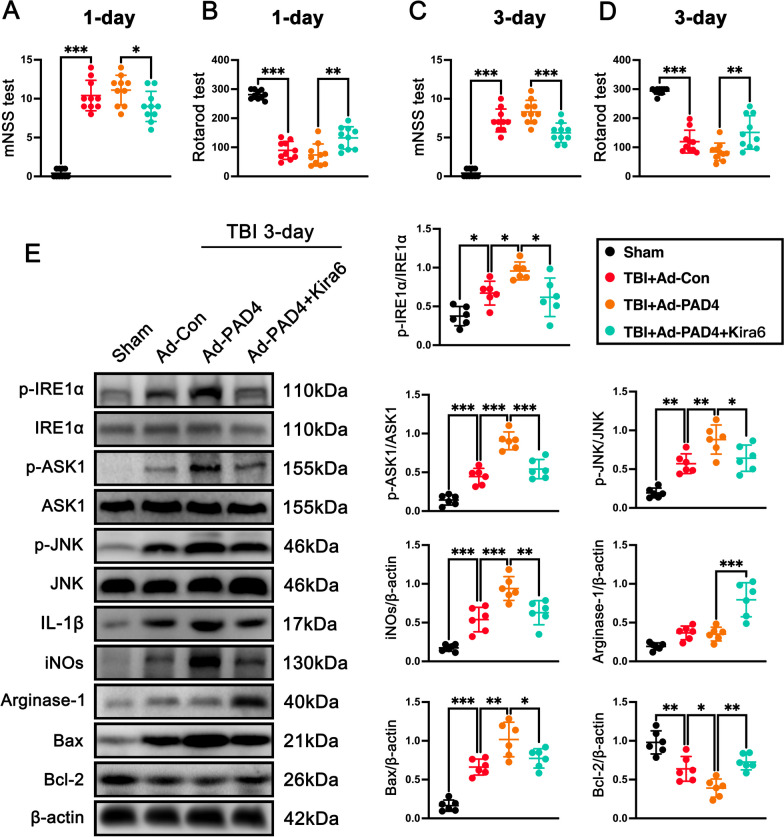
Methods: Controlled cortical impact model was performed to establish TBI. Cl-amidine, 2'3'-cGAMP (an activator of stimulating Interferon genes (STING)), C-176 (a selective STING inhibitor), and Kira6 [a selectively phosphorylated inositol-requiring enzyme-1 alpha [IRE1α] inhibitor] were administrated to explore the mechanism by which NETs promote neuroinflammation and neuronal apoptosis after TBI. Peptidyl arginine deiminase 4 (PAD4), an essential enzyme for neutrophil extracellular trap formation, is overexpressed with adenoviruses in the cortex of mice 1 day before TBI. The short-term neurobehavior tests, magnetic resonance imaging (MRI), laser speckle contrast imaging (LSCI), Evans blue extravasation assay, Fluoro-Jade C (FJC), TUNEL, immunofluorescence, enzyme-linked immunosorbent assay (ELISA), western blotting, and quantitative-PCR were performed in this study.

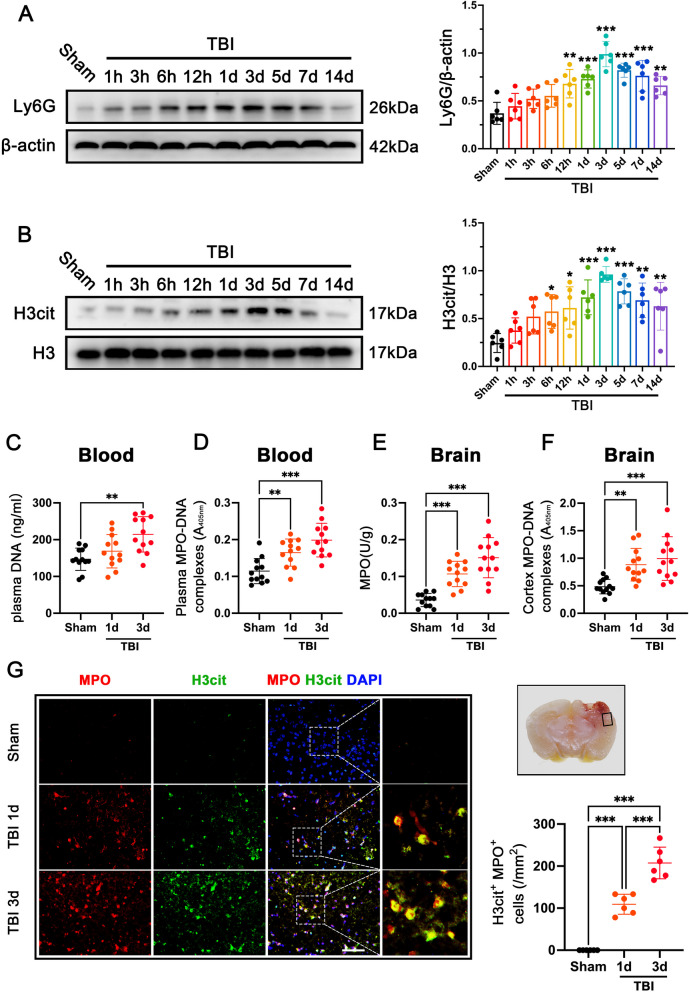
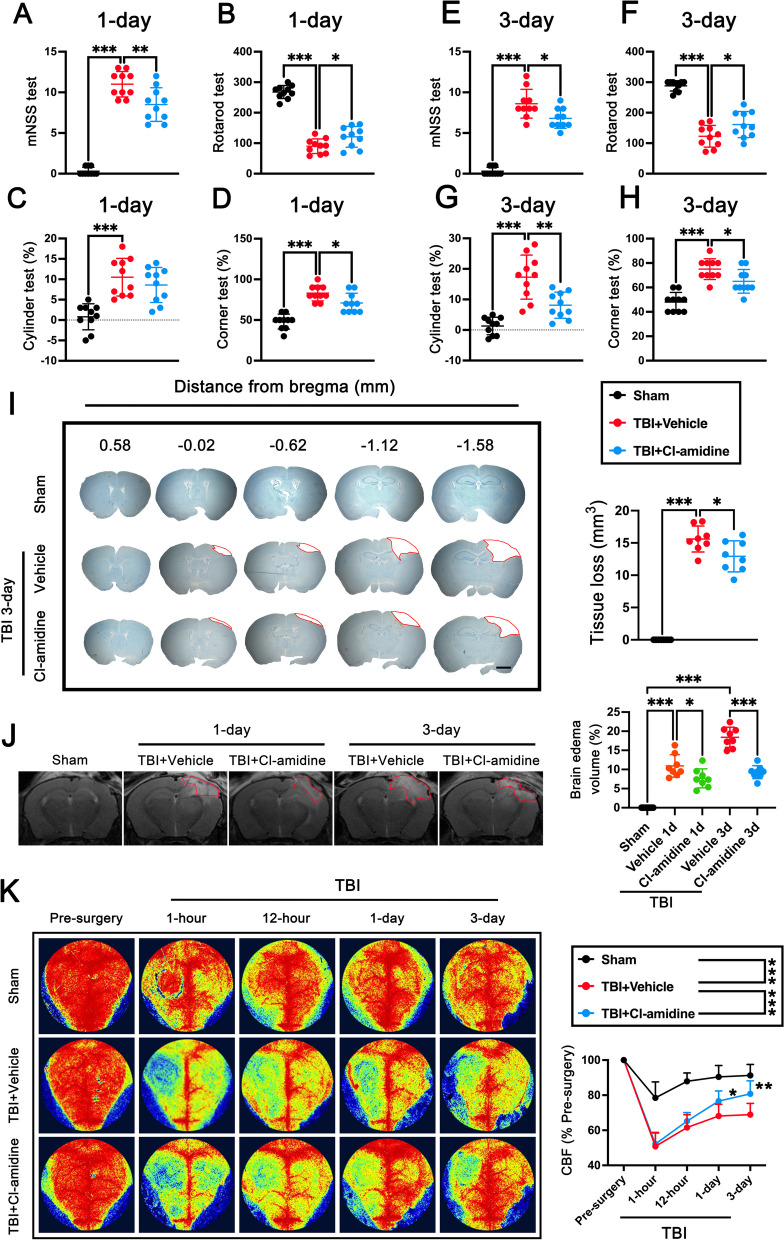
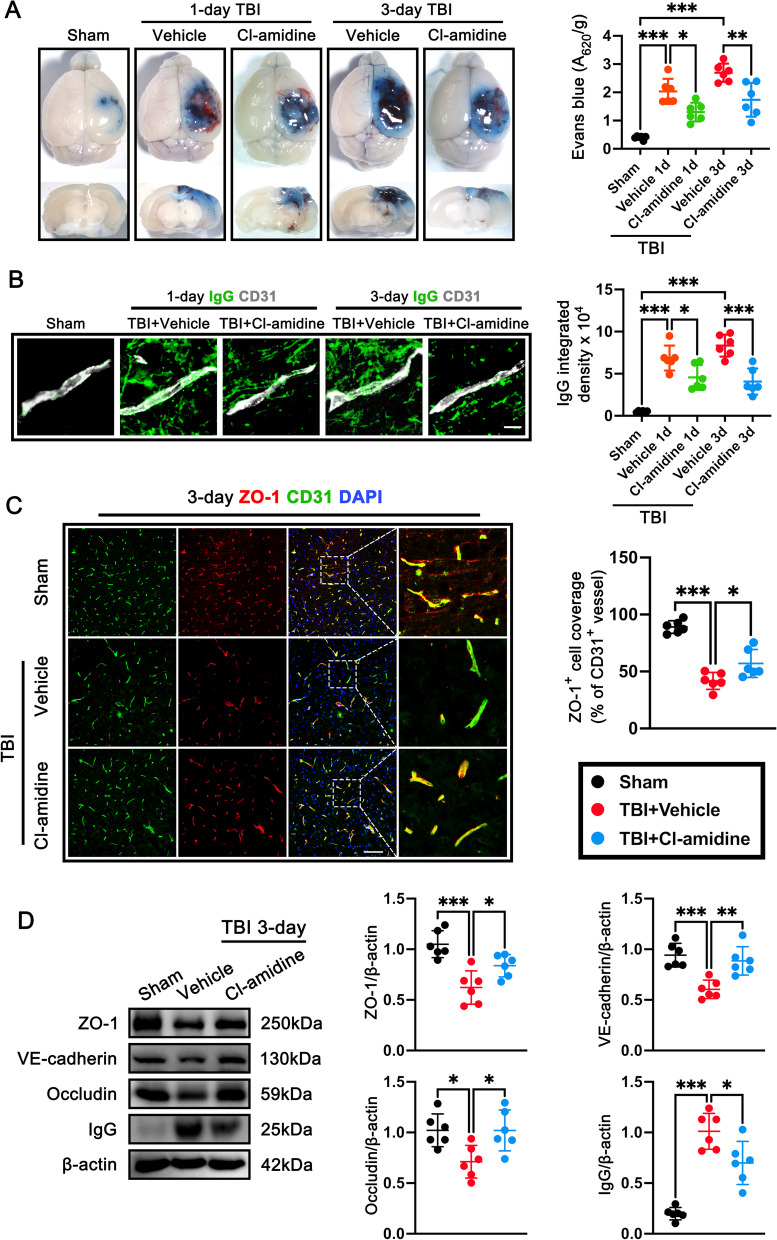
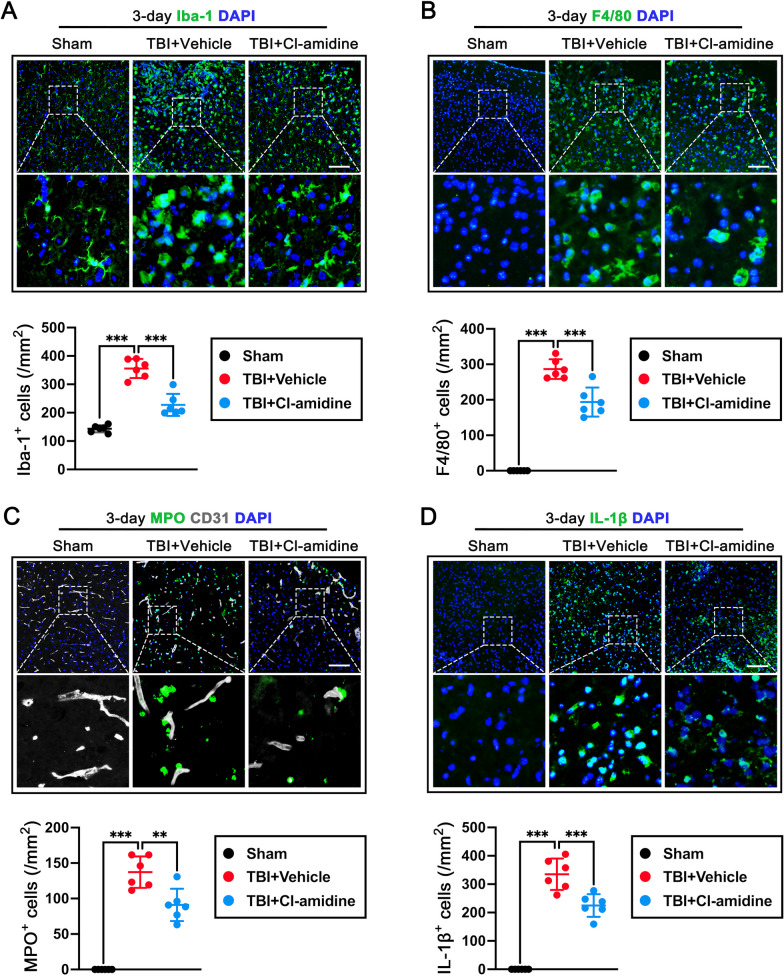
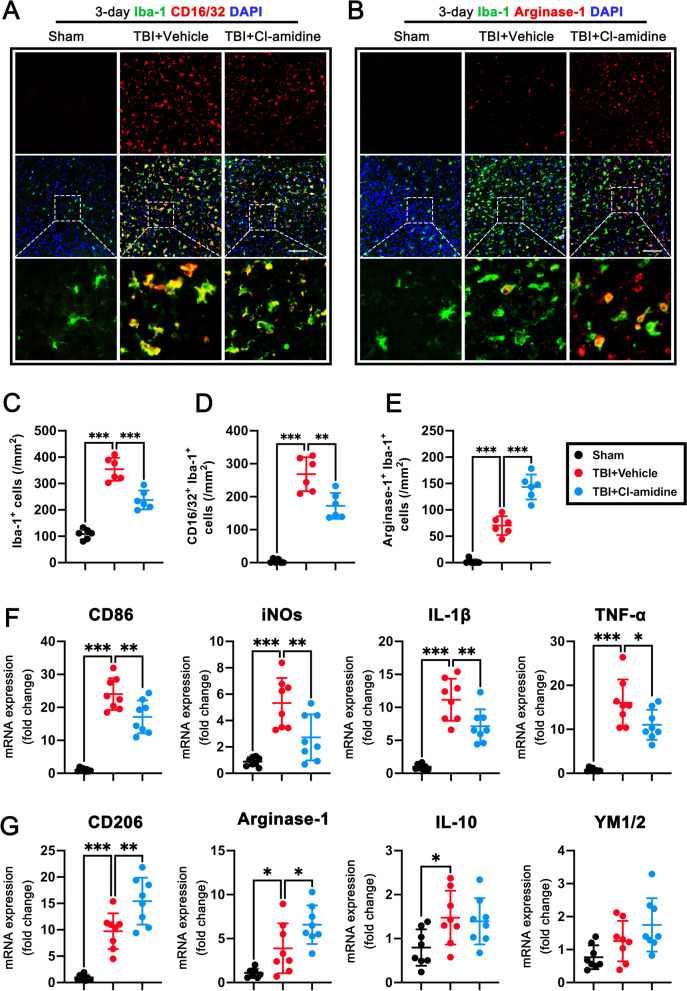
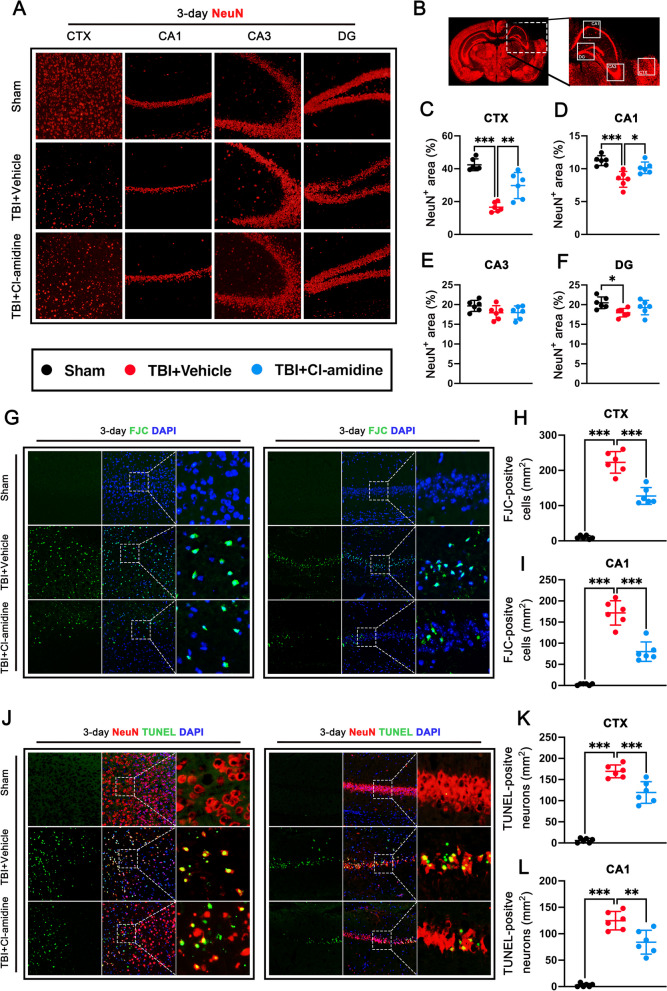
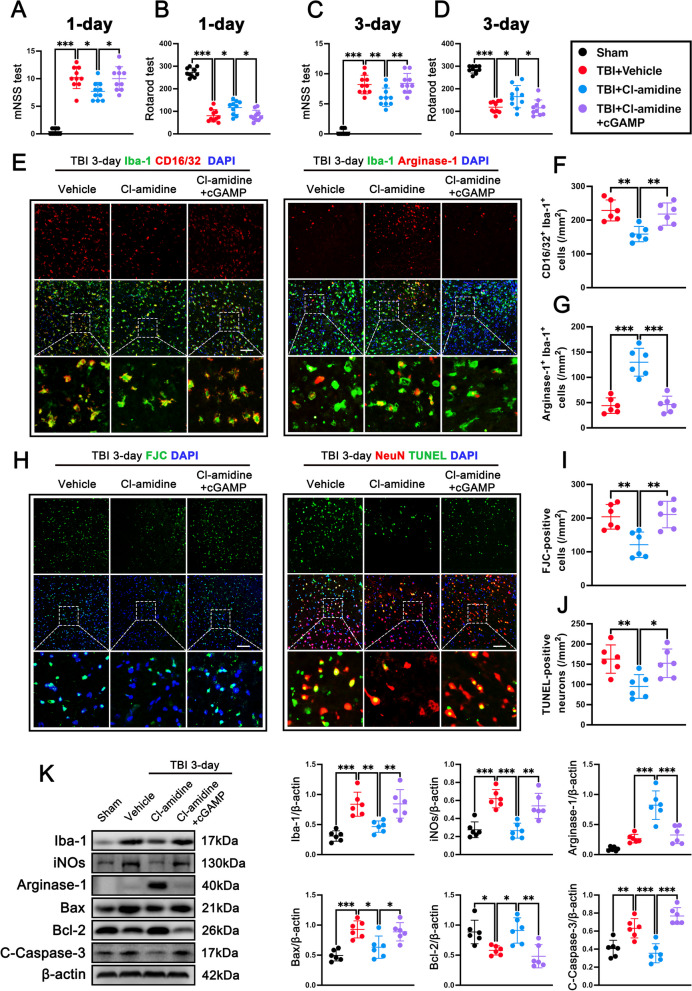
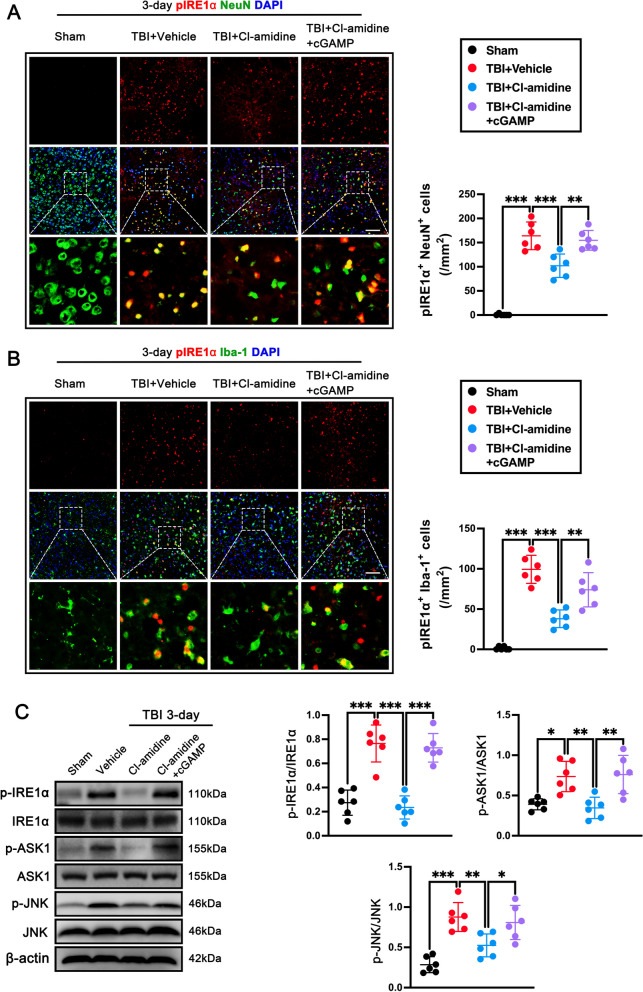
Results: Neutrophils form NETs presenting in the circulation and brain at 3 days after TBI. NETs inhibitor Cl-amidine treatment improved short-term neurological functions, reduced cerebral lesion volume, reduced brain edema, and restored cerebral blood flow (CBF) after TBI. In addition, Cl-amidine exerted neuroprotective effects by attenuating BBB disruption, inhibiting immune cell infiltration, and alleviating neuronal death after TBI. Moreover, Cl-amidine treatment inhibited microglia/macrophage pro-inflammatory polarization and promoted anti-inflammatory polarization at 3 days after TBI. Mechanistically, STING ligand 2'3'-cGAMP abolished the neuroprotection of Cl-amidine via IRE1α/ASK1/JNK signaling pathway after TBI. Importantly, overexpression of PAD4 promotes neuroinflammation and neuronal death via the IRE1α/ASK1/JNK signaling pathway after TBI. However, STING inhibitor C-176 or IRE1α inhibitor Kira6 effectively abolished the neurodestructive effects of PAD4 overexpression after TBI.

Conclusion: Altogether, we are the first to demonstrate that NETs inhibition with Cl-amidine ameliorated neuroinflammation, neuronal apoptosis, and neurological deficits via STING-dependent IRE1α/ASK1/JNK signaling pathway after TBI. Thus, Cl-amidine treatment may provide a promising therapeutic approach for the early management of TBI.

Keywords: Cl-amidine; IRE1α; Neuroinflammation; Neuronal apoptosis; Neutrophil extracellular traps; STING; Traumatic brain injury.


Conflict of interest statement

The authors declare that they have no competing interests.

Figures

Fig. 1
Fig. 1
Neutrophils form NETs presenting in the circulation and brain after TBI. A Representative western blot bands of the time course of Ly6G and densitometric quantification of Ly6G after TBI. **p < 0.01, ***p < 0.001, n = 6 per group. B Representative western blot bands of the time course of H3cit and densitometric quantification of H3cit after TBI. **p < 0.01, ***p < 0.001, n = 6 per group. C Quantitative analyses of plasma DNA at 1 day and 3 days after TBI. **p < 0.01, n = 12 per group. D Quantitative analyses of plasma MPO-DNA complexes at 1 day and 3 days after TBI. **p < 0.01, ***p < 0.001, n = 12 per group. E Quantification of MPO activity in the brain of mice at 1 day and 3 days after TBI. ***p < 0.001, n = 12 per group. F Quantitative analyses of cortex MPO-DNA complexes at 1 day and 3 days after TBI. **p < 0.01, ***p < 0.001, n = 12 per group. G Representative images of the colocalization of H3cit (green) with neutrophils (MPO, red) and quantitative analysis of H3cit-positive neutrophils at the lesion site at 1 days and 3 days after TBI. Nuclei were stained with DAPI (blue). Scale bar = 50 μm, ***p < 0.001, n = 6 per group
Fig. 2
Fig. 2
The effects of Cl-amidine treatment on short-term neurological functions, cerebral lesion volume, brain edema, and CBF after TBI. AD mNSS test (A), Rotarod test (B), Cylinder test (C), and Corner test (D) at 1 day post-TBI. *p < 0.05, **p < 0.01, ***p < 0.001, n = 10 per group EH mNSS test (E), Rotarod test (F), Cylinder test (G), and Corner test (H) at 3 days post-TBI. *p < 0.05, **p < 0.01, ***p < 0.001, n = 10 per group. I Representative images of serial coronal sections labeled by Nissl and quantitative analysis of tissue loss at 3 days after TBI. Scale bar = 1 mm, *p < 0.05, ***p < 0.001, n = 8 per group. J Representative images of MRI scanning at 1 day and 3 days after TBI and quantitative analysis of brain edema volume at 1 day and 3 days after TBI. *p < 0.05 ***p < 0.001, n = 8 per group. K Representative images of CBF by LSCI in different groups at different time points after TBI and quantitative analysis of continuous CBF changes before and after CCI. *p < 0.05, **p < 0.01, ***p < 0.001, n = 8 per group
Fig. 3
Fig. 3
The effects of Cl-amidine treatment on BBB disruption after TBI. A Representative horizontal image of brains after EB injection and quantitative analysis of EB leakage intensity. *p < 0.05, **p < 0.01, ***p < 0.001, n = 6 per group. B Representative images and quantitation of IgG extravascular deposits (green). Capillaries were stained with CD31 (white). Nuclei were stained with DAPI (blue). Scale bar = 10 μm, *p < 0.05, ***p < 0.001, n = 6 per group. C Representative images of double immunofluorescence staining of ZO-1(red) and endothelial cells (CD31, green) and quantification of fluorescence intensity analysis of ZO-1 (relative to CD31) at 3 days after TBI. Nuclei were stained with DAPI (blue). Scale bar = 100 μm. *p < 0.05, ***p < 0.001, n = 6 per group. D Representative western blot bands and densitometric quantification of ZO-1, VE-cadherin, Occludin, and IgG at 3 days after TBI. *p < 0.05, **p < 0.01, ***p < 0.001, n = 6 per group
Fig. 4
Fig. 4
The effects of Cl-amidine treatment on microglia/macrophage activation, neutrophil, and macrophage infiltration, and the expression of IL‑1β at 3 days after TBI. A Representative image of immunofluorescence staining of Iba-1 (green) and quantitative analysis of Iba-1-positive microglia at 3 days after TBI. Nuclei were stained with DAPI (blue). ***p < 0.001, n = 6 per group. Scale bar = 100 μm. B Representative image of immunofluorescence staining of F4/80 (green) and quantitative analysis of F4/80-positive macrophages at 3 days after TBI. Nuclei were stained with DAPI (blue). ***p < 0.001, n = 6 per group. Scale bar = 100 μm. C Representative image of double immunofluorescence staining of MPO (green) and CD31 (grey), and quantitative analysis of MPO-positive neutrophils at 3 days after TBI. Nuclei were stained with DAPI (blue). **p < 0.01, ***p < 0.001, n = 6 per group. Scale bar = 100 μm. D Representative image of immunofluorescence staining of IL-1β (green) and quantitative analysis of IL-1β-positive cells at 3 days after TBI. Nuclei were stained with DAPI (blue). ***p < 0.001, n = 6 per group. Scale bar = 100 μm
Fig. 5
Fig. 5
Cl-amidine promotes the phenotype of microglia/macrophage from pro-inflammatory to anti-inflammatory at 3 days after TBI. A Representative double immunofluorescence staining for Iba1 (green) and CD16/32 (red) in the contused cortex at 3 days after TBI. Nuclei were stained with DAPI (blue). Scale bar = 100 μm. B Representative double immunofluorescence staining for Iba1 (green) and Arginase-1 (red) in the contused cortex at 3 days after TBI. Nuclei were stained with DAPI (blue). Scale bar = 100 μm. CE Quantitative analyses of Iba1+ microglia/ macrophage (C), Iba1+/CD16/32+ M1 microglia/macrophage (D), and Iba1+/Arginase-1+ M2 microglia/macrophage (E) in the contused cortex at 3 days after TBI. **p < 0.01, ***p < 0.001, n = 6 per group. F M1-associated mRNA levels were evaluated including CD86, iNOs, IL-1β, and TNF-α. G M2-associated mRNA levels were evaluated including CD206, Arginase-1, IL-10, and YM1/2. *p < 0.05, **p < 0.01, ***p < 0.001, n = 6 per group
Fig. 6
Fig. 6
Effects of Cl-amidine treatment on neuronal death at 3 days after TBI. A Representative image of NeuN immunostaining in the ipsilateral CTX, CA1, CA3, and DG regions at 3 days after TBI. Nuclei were stained with DAPI (blue). Scale bar = 200 μm. B Ipsilateral brain areas (rectangles) in the CTX, CA1, CA3, and DG where images in A were captured. Scale bar = 1 mm. CF Quantitative analysis of NeuN‑immunopositive neurons in the ipsilateral CTX (C), CA1(D), CA3 (E), and DG (F) regions at 3 days after TBI. G Representative image of the FJC (green) staining in the CTX and CA1 at 3 days after TBI. Nuclei were stained with DAPI (blue). Scale bar = 100 μm. H, I Quantitative analysis of FJC -positive cells in the CTX (H) and CA1 (I) at 3 days after TBI. ***p < 0.001, n = 6 per group. J Representative images of TUNEL (green) co-localization with neurons (NeuN, red) in the CTX and CA1 at 3 days after TBI. Nuclei were stained with DAPI (blue). Scale bar = 100 μm. K, L Quantitative analysis of TUNEL-positive neurons in the CTX (K) and CA1 (L) at 3 days after TBI. **p < 0.01, ***p < 0.001, n = 6 per group
Fig. 7
Fig. 7
STING agonist 2′3′-cGAMP abolished the anti-inflammatory and anti-apoptotic effects of Cl-amidine after TBI. A, B mNSS test (A) and Rotarod test (B) at 1 day post-TBI. *p < 0.05, ***p < 0.001, n = 10 per group C, D mNSS test (C) and Rotarod test (D) at 3 days post-TBI. *p < 0.05, **p < 0.01, ***p < 0.001, n = 10 per group. E Representative double immunofluorescence staining for Iba1 (green) and CD16/32 (red) and representative double immunofluorescence staining for Iba1 (green) and Arginase-1 (red) in the contused cortex at 3 days after TBI. Nuclei were stained with DAPI (blue). Scale bar = 100 μm. F, G Quantitative analyses of Iba1+/CD16/32+ M1 microglia/macrophage (F), and Iba1+/Arginase-1+ M2 microglia/macrophage (G) in the contused cortex at 3 days after TBI. **p < 0.01, ***p < 0.001, n = 6 per group. H Representative image of the FJC (green) staining and representative images of TUNEL (green) co-localization with neurons (NeuN, red) in the contused cortex at 3 days after TBI. Nuclei were stained with DAPI (blue). Scale bar = 100 μm. I, J Quantitative analysis of FJC-positive cells (I) and quantitative analysis of TUNEL-positive neurons (J) in the contused cortex at 3 days after TBI. *p < 0.05, **p < 0.01, n = 6 per group. K Representative western blot bands and densitometric quantification of Iba-1, iNOs, Arginase-1, Bax, Bcl-2, and C-Caspase-3 after TBI. *p < 0.05, **p < 0.01, ***p < 0.001, n = 6 per group
Fig. 8
Fig. 8
STING agonist abolished the neuroprotective effects of Cl-amidine via IRE1α/ASK1/JNK signaling pathway after TBI. A Representative double immunofluorescence staining for NeuN (green) and pIRE1α (red) and quantitative analyses of pIRE1α+ neuron in the contused cortex at 3 days after TBI. Nuclei were stained with DAPI (blue). Scale bar = 100 μm. **p < 0.01, ***p < 0.001, n = 6 per group. B Representative double immunofluorescence staining for Iba-1 (green) and pIRE1α (red) and quantitative analyses of pIRE1α+ microglia in the contused cortex at 3 days after TBI. Nuclei were stained with DAPI (blue). Scale bar = 100 μm. **p < 0.01, ***p < 0.001, n = 6 per group. C Representative western blot bands and densitometric quantification of pIRE1α, pASK1, and pJNK in the contused cortex after TBI. *p < 0.05, **p < 0.01, ***p < 0.001, n = 6 per group
Fig. 9
Fig. 9
PAD4 promotes neuroinflammation and neuronal death via IRE1α/ASK1/JNK signaling pathway after TBI. A Schematic image of adeno-PAD4-EGFP and overexpression of PAD4 in the cortex of the mouse. B, C mNSS test on day 1 (B) and days 3 (C) post-TBI. **p < 0.01, ***p < 0.001, n = 10 per group. D, E Rotarod test on day 1 (D) and days 3 (E) post-TBI. *p < 0.05, **p < 0.01, ***p < 0.001, n = 10 per group. F Representative western blot bands and densitometric quantification of Iba-1, CD16, and CD206 in the contused cortex after TBI. *p < 0.05, **p < 0.01, ***p < 0.001, n = 6 per group. G Representative image of the FJC (green) staining and representative images of TUNEL (green) co-localization with neurons (NeuN, red) in the contused cortex at 3 days after TBI. Nuclei were stained with DAPI (blue). Scale bar = 100 μm. H, I Quantitative analysis of FJC-positive cells (H) and quantitative analysis of TUNEL-positive neurons (I) in the contused cortex at 3 days after TBI. *p < 0.05, **p < 0.01, n = 6 per group. J Representative western blot bands and densitometric quantification of pIRE1α, pASK1, and pJNK in the contused cortex after TBI. *p < 0.05, **p < 0.01, ***p < 0.001, n = 6 per group
Fig. 10
Fig. 10
Inhibition of IRE1α abolished the neurodestructive effects caused by PAD4 overexpression after TBI. A, B mNSS test (A) and Rotarod test (B) at 1 day post-TBI. *p < 0.05, **p < 0.01, ***p < 0.001, n = 10 per group C, D mNSS test (C) and Rotarod test (D) at 3 days post-TBI. **p < 0.01, ***p < 0.001, n = 10 per group. E Representative western blot bands and densitometric quantification of pIRE1α, pASK1, pJNK, IL-1β, INOs, Arginase-1, Bax, and Bcl-2 after TBI. *p < 0.05, **p < 0.01, ***p < 0.001, n = 6 per group

Similar articles

Cited by

References

    1. Collaborators GBDN. Global, regional, and national burden of neurological disorders, 1990–2016: a systematic analysis for the Global Burden of Disease Study 2016. Lancet Neurol. 2019;18(5):459–480. - PMC - PubMed
    1. Nizamutdinov D, Shapiro LA. Overview of traumatic brain injury: an immunological context. Brain Sci. 2017;7(1):11. - PMC - PubMed
    1. Tehse J, Taghibiglou C. The overlooked aspect of excitotoxicity: glutamate-independent excitotoxicity in traumatic brain injuries. Eur J Neurosci. 2019;49(9):1157–1170. - PubMed
    1. Morganti-Kossmann MC, et al. The complexity of neuroinflammation consequent to traumatic brain injury: from research evidence to potential treatments. Acta Neuropathol. 2019;137(5):731–755. - PubMed
    1. Willis EF, et al. Repopulating microglia promote brain repair in an IL-6-dependent manner. Cell. 2020;180(5):833–846.e16. - PubMed