

Targeting and cytotoxicity of chimeric antigen receptor T cells grafted with PD1 extramembrane domain
- PMID: 37777797
- PMCID: PMC10543853
- DOI: 10.1186/s40164-023-00438-7
Targeting and cytotoxicity of chimeric antigen receptor T cells grafted with PD1 extramembrane domain
Erratum in
-
Correction: Targeting and cytotoxicity of chimeric antigen receptor T cells grafted with PD1 extramembrane domain.Exp Hematol Oncol. 2025 Apr 2;14(1):50. doi: 10.1186/s40164-025-00645-4. Exp Hematol Oncol. 2025. PMID: 40176177 Free PMC article. No abstract available.
Abstract
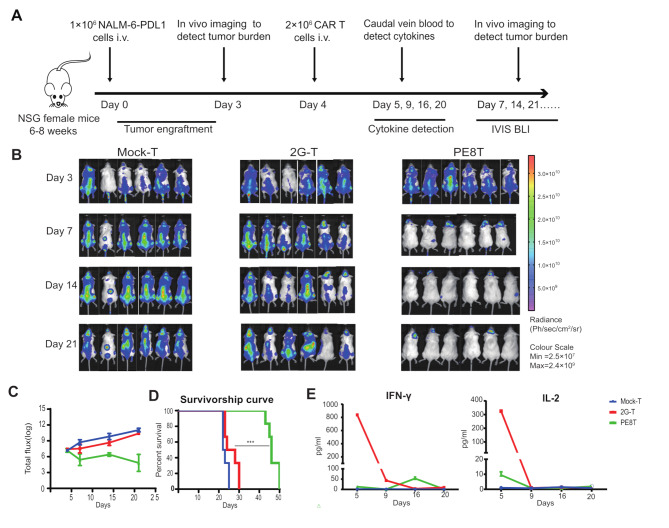
Background: Immunosuppression induced by programmed cell death protein 1 (PD1) presents a significant constraint on the effectiveness of chimeric antigen receptor (CAR)-T therapy. The potential of combining PD1/PDL1 (Programmed cell death 1 ligand 1) axis blockade with CAR-T cell therapy is promising. However, developing a highly efficient and minimally toxic approach requires further exploration. Our attempt to devise a novel CAR structure capable of recognizing both tumor antigens and PDL1 encountered challenges since direct targeting of PDL1 resulted in systemic adverse effects.
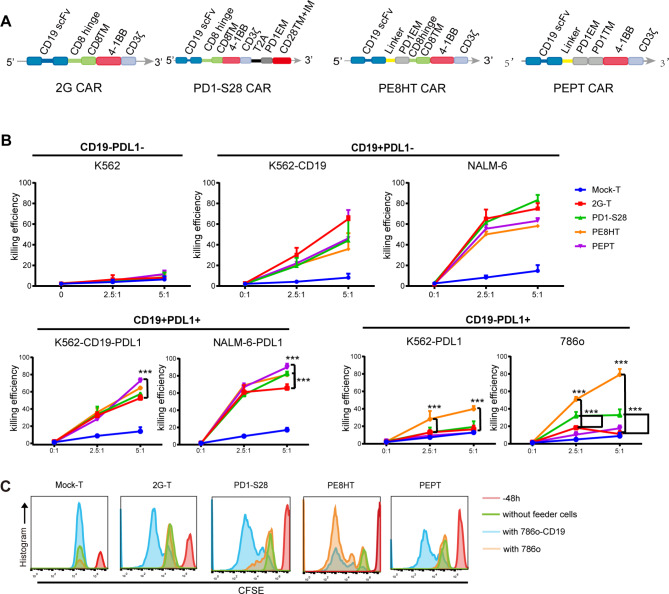
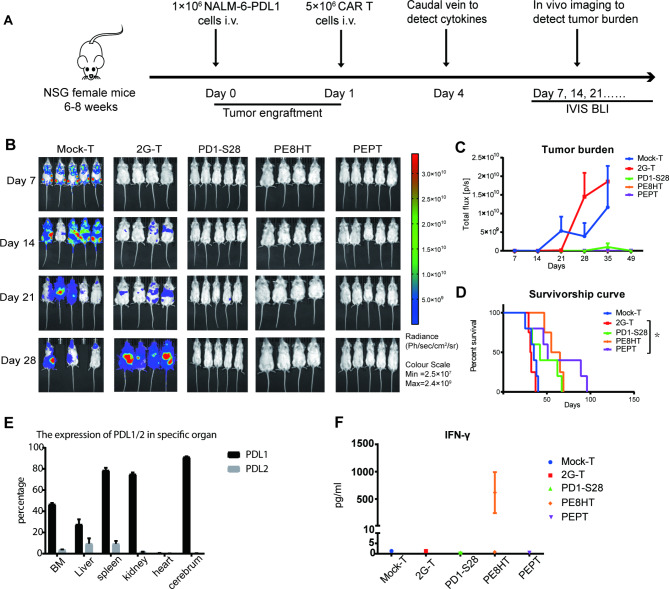
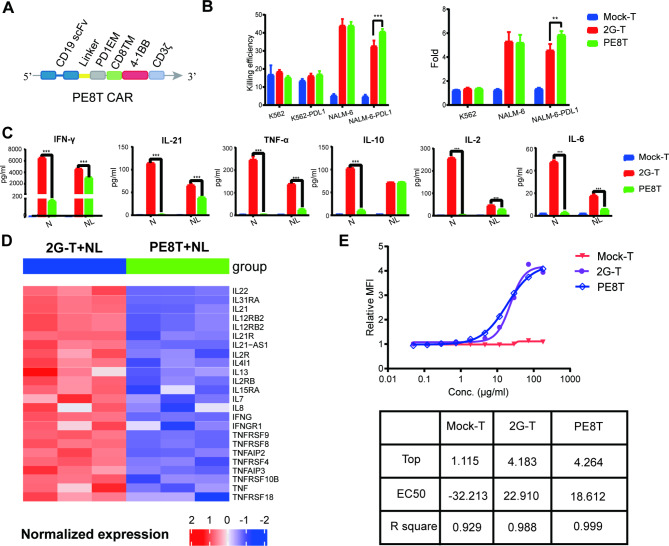
Methods: In this research, we innovatively engineered novel CARs by grafting the PD1 domain into a conventional second-generation (2G) CAR specifically targeting CD19. These CARs exist in two distinct forms: one with PD1 extramembrane domain (EMD) directly linked to a transmembrane domain (TMD), referred to as PE CAR, and the other with PD1 EMD connected to a TMD via a CD8 hinge domain (HD), known as PE8HT CAR. To evaluate their efficacy, we conducted comprehensive assessments of their cytotoxicity, cytokine release, and potential off-target effects both in vitro and in vivo using tumor models that overexpress CD19/PDL1.
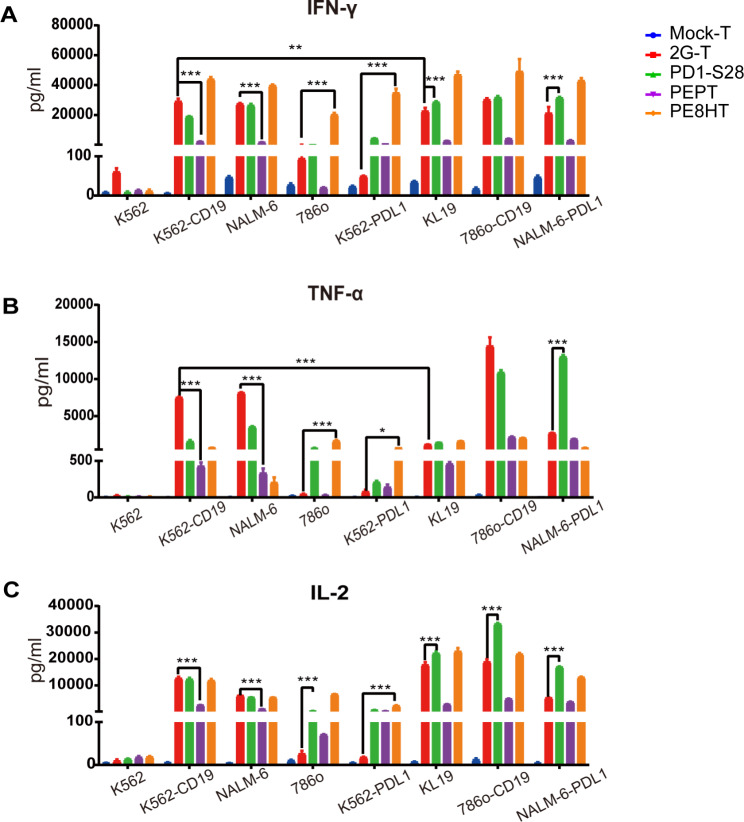
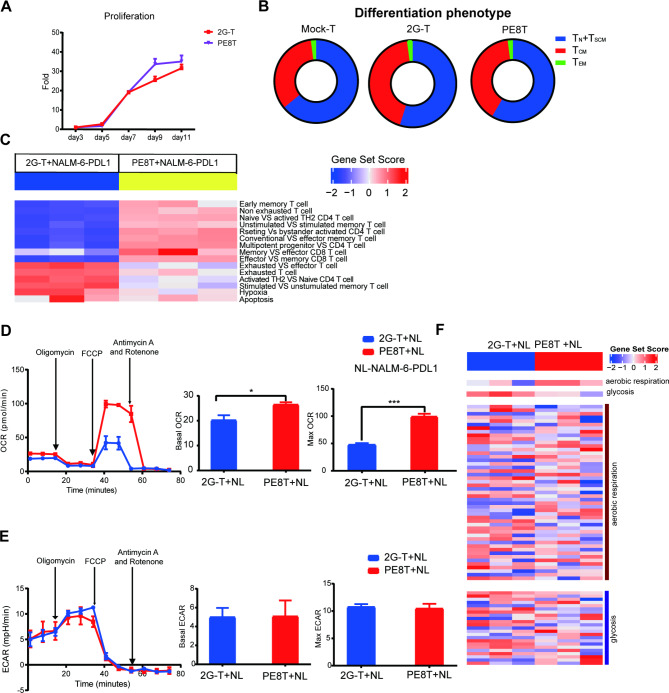
Results: The findings of our study indicate that PE CAR demonstrates enhanced cytotoxicity and reduced cytokine release specifically towards CD19 + PDL1 + tumor cells, without off-target effects to CD19-PDL1 + tumor cells, in contrast to 2G CAR-T cells. Additionally, PE CAR showed ameliorative differentiation, exhaustion, and apoptosis phenotypes as assessed by flow cytometry, RNA-sequencing, and metabolic parameter analysis, after encountering CD19 + PDL1 + tumor cells.
Conclusion: Our results revealed that CAR grafted with PD1 exhibits enhanced antitumor activity with lower cytokine release and no PD1-related off-target toxicity in tumor models that overexpress CD19 and PDL1. These findings suggest that our CAR design holds the potential for effectively addressing the PD1 signal.
Keywords: Chimeric antigen receptor T cell; Hinge domain; Off-target toxicity; PD1; Tumor microenvironment.
© 2023. YUMED Inc. and BioMed Central Ltd.
Conflict of interest statement
All authors declare that the research was conducted without any commercial or financial relationships that could be construed as a potential conflict of interest. SAFE Pharmaceutical Research Institute Company employed J. Du and QJ Wang.
Figures
Similar articles
-
Enhancing T cell anti-tumor efficacy with a PD1-TIGIT chimeric immune-checkpoint switch receptor.Oncoimmunology. 2023 Oct 5;12(1):2265703. doi: 10.1080/2162402X.2023.2265703. eCollection 2023. Oncoimmunology. 2023. PMID: 37808405 Free PMC article.
-
The Third Generation Anti-HER2 Chimeric Antigen Receptor Mouse T Cells Alone or Together With Anti-PD1 Antibody Inhibits the Growth of Mouse Breast Tumor Cells Expressing HER2 in vitro and in Immune Competent Mice.Front Oncol. 2020 Jul 14;10:1143. doi: 10.3389/fonc.2020.01143. eCollection 2020. Front Oncol. 2020. PMID: 32766150 Free PMC article.
-
Therapeutic effect of dual CAR-T targeting PDL1 and MUC16 antigens on ovarian cancer cells in mice.BMC Cancer. 2020 Jul 20;20(1):678. doi: 10.1186/s12885-020-07180-x. BMC Cancer. 2020. PMID: 32689954 Free PMC article.
-
The Antitumor Activity of CAR-T-PD1 Cells Enhanced by HPV16mE7-Pulsed and SOCS1-Silenced DCs in Cervical Cancer Models.Cancer Manag Res. 2021 Aug 4;13:6045-6053. doi: 10.2147/CMAR.S321402. eCollection 2021. Cancer Manag Res. 2021. PMID: 34377023 Free PMC article.
-
Chimeric antigen receptor T cells therapy in solid tumors.Clin Transl Oncol. 2023 Aug;25(8):2279-2296. doi: 10.1007/s12094-023-03122-8. Epub 2023 Feb 28. Clin Transl Oncol. 2023. PMID: 36853399 Review.
Cited by
-
Optimizing CAR-T cell therapy for solid tumors: current challenges and potential strategies.J Hematol Oncol. 2024 Nov 5;17(1):105. doi: 10.1186/s13045-024-01625-7. J Hematol Oncol. 2024. PMID: 39501358 Free PMC article. Review.
-
Adoptive cell therapy against tumor immune evasion: mechanisms, innovations, and future directions.Front Oncol. 2025 Feb 28;15:1530541. doi: 10.3389/fonc.2025.1530541. eCollection 2025. Front Oncol. 2025. PMID: 40094019 Free PMC article. Review.
-
Challenges and strategies associated with CAR-T cell therapy in blood malignancies.Exp Hematol Oncol. 2024 Feb 24;13(1):22. doi: 10.1186/s40164-024-00490-x. Exp Hematol Oncol. 2024. PMID: 38402232 Free PMC article. Review.
-
Exploring the potential of the convergence between extracellular vesicles and CAR technology as a novel immunotherapy approach.J Extracell Biol. 2024 Sep 26;3(9):e70011. doi: 10.1002/jex2.70011. eCollection 2024 Sep. J Extracell Biol. 2024. PMID: 39328262 Free PMC article. Review.
-
Correction: Targeting and cytotoxicity of chimeric antigen receptor T cells grafted with PD1 extramembrane domain.Exp Hematol Oncol. 2025 Apr 2;14(1):50. doi: 10.1186/s40164-025-00645-4. Exp Hematol Oncol. 2025. PMID: 40176177 Free PMC article. No abstract available.
References
-
- June CH, O’Connor RS, Kawalekar OU, Ghassemi S, Milone MC. CAR T cell immunotherapy for human cancer. Science. 2018;359(6382):1361–5. 10.1126/science.aar6711. - PubMed
-
- Marple AH, Bonifant CL, Shah NN. Improving CAR T-cells: the next generation. Semin Hematol. 2020;57(3):115–21. 10.1053/j.seminhematol.2020.07.002. - PubMed
Grants and funding
LinkOut - more resources
Full Text Sources
Research Materials
