

Development and testing of a random forest-based machine learning model for predicting events among breast cancer patients with a poor response to neoadjuvant chemotherapy
- PMID: 37777809
- PMCID: PMC10543332
- DOI: 10.1186/s40001-023-01361-7
Development and testing of a random forest-based machine learning model for predicting events among breast cancer patients with a poor response to neoadjuvant chemotherapy
Abstract
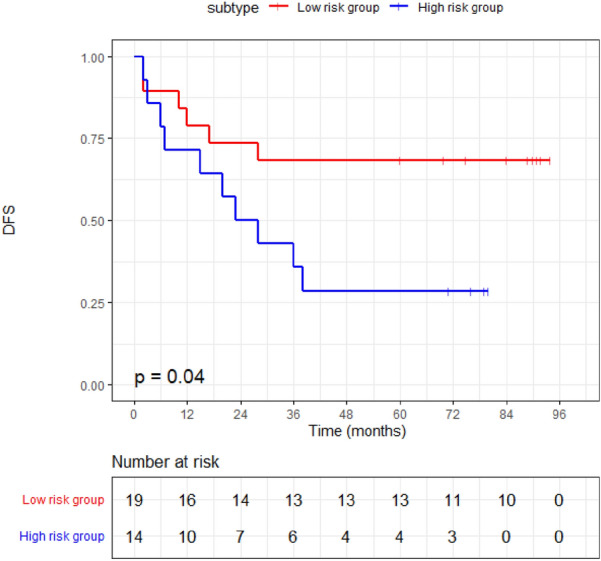
Background: Breast cancer (BC) is the most common malignant tumor around the world. Timely detection of the tumor progression after treatment could improve the survival outcome of patients. This study aimed to develop machine learning models to predict events (defined as either (1) the first tumor relapse locally, regionally, or distantly; (2) a diagnosis of secondary malignant tumor; or (3) death because of any reason.) in BC patients post-treatment.
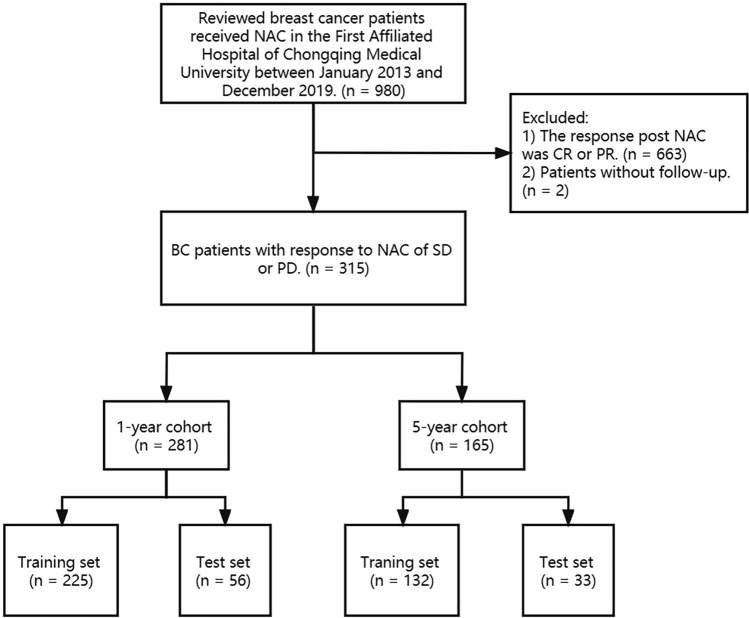
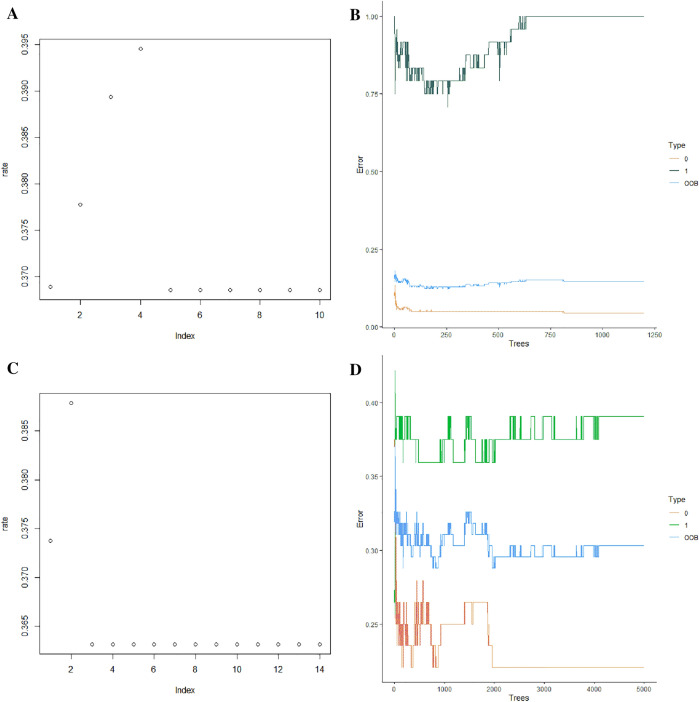
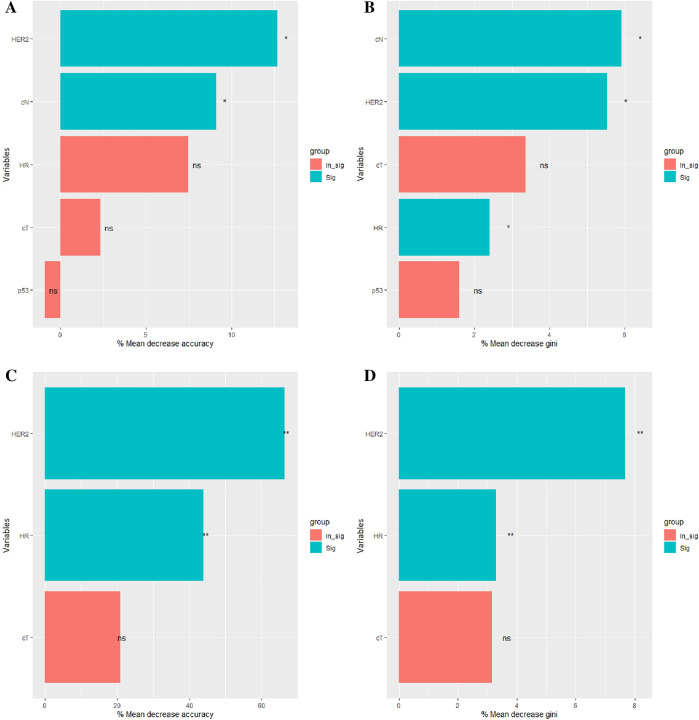
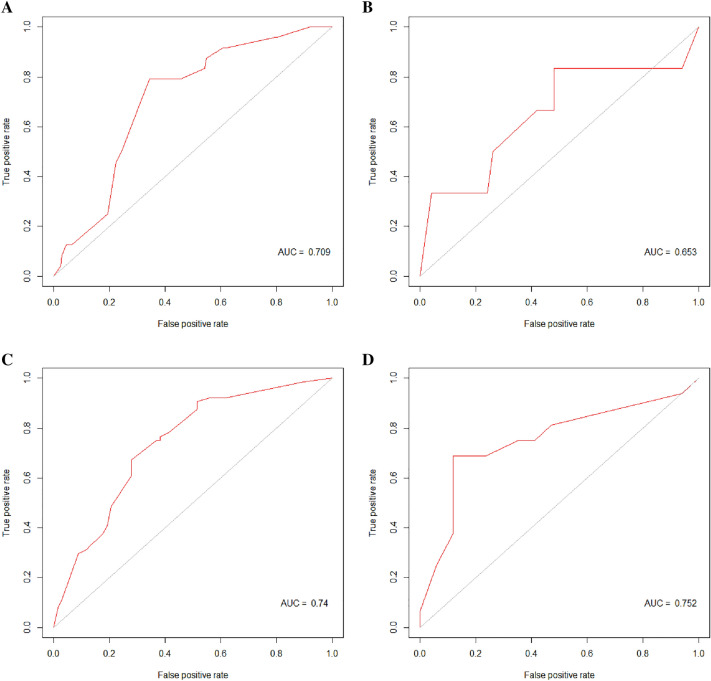
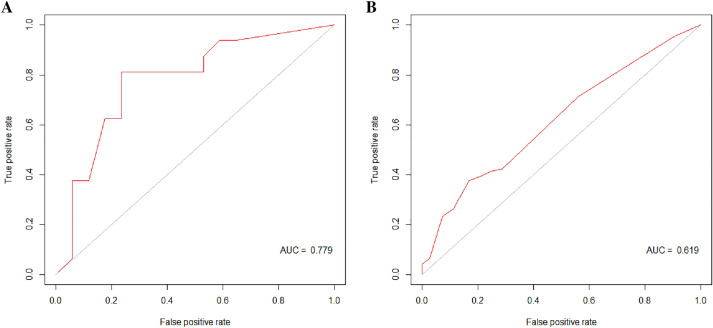
Methods: The patients with the response of stable disease (SD) and progressive disease (PD) after neoadjuvant chemotherapy (NAC) were selected. The clinicopathological features and the survival data were recorded in 1 year and 5 years, respectively. Patients were randomly divided into the training set and test set in the ratio of 8:2. A random forest (RF) and a logistic regression were established in both of 1-year cohort and the 5-year cohort. The performance was compared between the two models. The models were validated using data from the Surveillance, Epidemiology, and End Results (SEER) database.
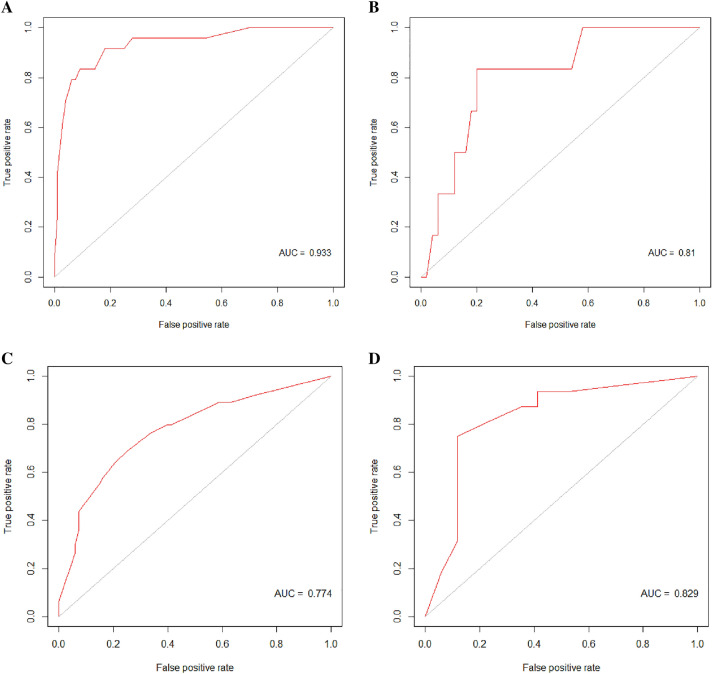
Results: A total of 315 patients were included. In the 1-year cohort, 197 patients were divided into a training set while 87 were into a test set. The specificity, sensitivity, and AUC were 0.800, 0.833, and 0.810 in the RF model. And 0.520, 0.833, and 0.653 of the logistic regression. In the 5-year cohort, 132 patients were divided into the training set while 33 were into the test set. The specificity, sensitivity, and AUC were 0.882, 0.750, and 0.829 in the RF model. And 0.882, 0.688, and 0.752 of the logistic regression. In the external validation set, of the RF model, the specificity, sensitivity, and AUC were 0.765, 0.812, and 0.779. Of the logistics regression model, the specificity, sensitivity, and AUC were 0.833, 0.376, and 0.619.
Conclusion: The RF model has a good performance in predicting events among BC patients with SD and PD post-NAC. It may be beneficial to BC patients, assisting in detecting tumor recurrence.
Keywords: Breast cancer; Event; Logistic regression; Machine learning; Random forest.
© 2023. BioMed Central Ltd., part of Springer Nature.
Conflict of interest statement
The authors declare that no competing interests exist.
Figures
References
Publication types
MeSH terms
Grants and funding
- CSTC2021jscx-gksb-N0027/the Key Research and Development Project of Chongqing's Technology Innovation and Application Development Special Big Health Field
- 472020320220007/the First-class Discipline Construction Project of Clinical Medicine in the First Clinical College of Chongqing Medical University
LinkOut - more resources
Full Text Sources
Medical
