

Genomic selection for survival under naturally occurring Saprolegnia oomycete infection in farmed European whitefish Coregonus lavaretus
- PMID: 37777972
- PMCID: PMC10583997
- DOI: 10.1093/jas/skad333
Genomic selection for survival under naturally occurring Saprolegnia oomycete infection in farmed European whitefish Coregonus lavaretus
Abstract
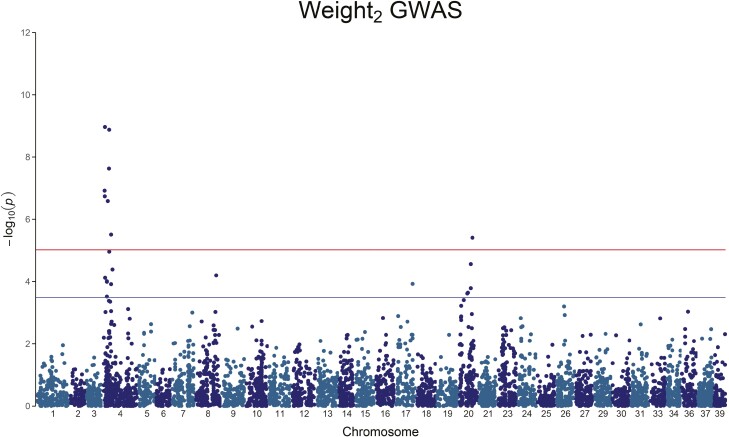
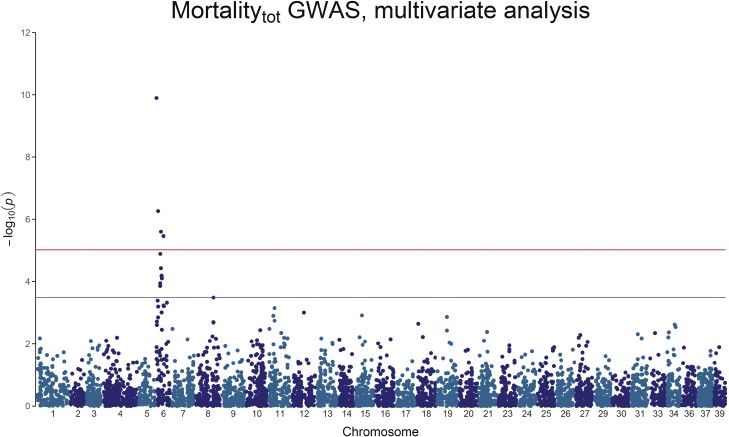
Saprolegnia oomycete infection causes serious economic losses and reduces fish health in aquaculture. Genomic selection based on thousands of DNA markers is a powerful tool to improve fish traits in selective breeding programs. Our goal was to develop a single nucleotide polymorphism (SNP) marker panel and to test its use in genomic selection for improved survival against Saprolegnia infection in European whitefish Coregonus lavaretus, the second most important farmed fish species in Finland. We used a double digest restriction site associated DNA (ddRAD) genotyping by sequencing method to produce a SNP panel, and we tested it analyzing data from a cohort of 1,335 fish, which were measured at different times for mortality to Saprolegnia oomycete infection and weight traits. We calculated the genetic relationship matrix (GRM) from the genome-wide genetic data, integrating it in multivariate mixed models used for the estimation of variance components and genomic breeding values (GEBVs), and to carry out Genome-Wide Association Studies for the presence of quantitative trait loci (QTL) affecting the phenotypes in analysis. We identified one major QTL on chromosome 6 affecting mortality to Saprolegnia infection, explaining 7.7% to 51.3% of genetic variance, and a QTL for weight on chromosome 4, explaining 1.8% to 5.4% of genetic variance. Heritability for mortality was 0.20 to 0.43 on the liability scale, and heritability for weight was 0.44 to 0.53. The QTL for mortality showed an additive allelic effect. We tested whether integrating the QTL for mortality as a fixed factor, together with a new GRM calculated excluding the QTL from the genetic data, would improve the accuracy estimation of GEBVs. This test was done through a cross-validation approach, which indicated that the inclusion of the QTL increased the mean accuracy of the GEBVs by 0.28 points, from 0.33 to 0.61, relative to the use of full GRM only. The area under the curve of the receiver-operator curve for mortality increased from 0.58 to 0.67 when the QTL was included in the model. The inclusion of the QTL as a fixed effect in the model increased the correlation between the GEBVs of early mortality with the late mortality, compared to a model that did not include the QTL. These results validate the usability of the produced SNP panel for genomic selection in European whitefish and highlight the opportunity for modeling QTLs in genomic evaluation of mortality due to Saprolegnia infection.
Keywords: Saprolegnia; ddRAD; genomic selection; infection resistance; whitefish.
Plain language summary
Saprolegnia infection causes serious economic losses and reduces fish health in aquaculture. We created a novel set of genetic markers to use in the selective breeding of European whitefish to reduce mortality due to the fungus. Using genetic markers, we estimated how much different fish traits are determined by genetic variation, and thus what potential traits have to be selected. We observed that resistance to infection was controlled by both a genetic variant with a major effect on mortality and by many other variants with a small effect distributed across the genome. We tested whether we could increase the precision of genomic breeding values used in the selective breeding by explicitly adding the major genetic variant to the analysis, and we observed an increase in precision in our results. We conclude that directly including information about the major genetic variant increases the precision of our predictions, rather than assuming that all genetic variants each explain a small amount of the genetic variation.
© The Author(s) 2023. Published by Oxford University Press on behalf of the American Society of Animal Science.
Conflict of interest statement
The authors declare no conflict of interest.
Figures


References
-
- Aslam, M. L., Carraro R., Sonesson A. K., Meuwissen T., Tsigenopoulos C. S., Rigos G., Bargelloni L., and Tzokas K... 2020. Genetic variation, GWAS and accuracy of prediction for host resistance to Sparicotyle chrysophrii in farmed gilthead sea bream (Sparus aurata). Front. Genet. 11:594770. doi:10.3389/fgene.2020.594770 - DOI - PMC - PubMed
-
- Calboli, F. C. F., Koskinen H., Nousianen A., Fraslin C., Houston R. D., and Kause A... 2022. Conserved QTL and chromosomal inversion affect resistance to columnaris disease in 2 rainbow trout (Oncorhyncus mykiss) populations. G3 (Bethesda). 12:jkac137. doi:10.1093/g3journal/jkac137 - DOI - PMC - PubMed
MeSH terms
LinkOut - more resources
Full Text Sources
