. 2023 Oct;55(10):2220-2237.
doi: 10.1038/s12276-023-01091-0. Epub 2023 Oct 2.

Oncogenic KRAS mutation confers chemoresistance by upregulating SIRT1 in non-small cell lung cancer

Affiliations

Oncogenic KRAS mutation confers chemoresistance by upregulating SIRT1 in non-small cell lung cancer

Dong Hoon Shin et al. Exp Mol Med. 2023 Oct.

Abstract

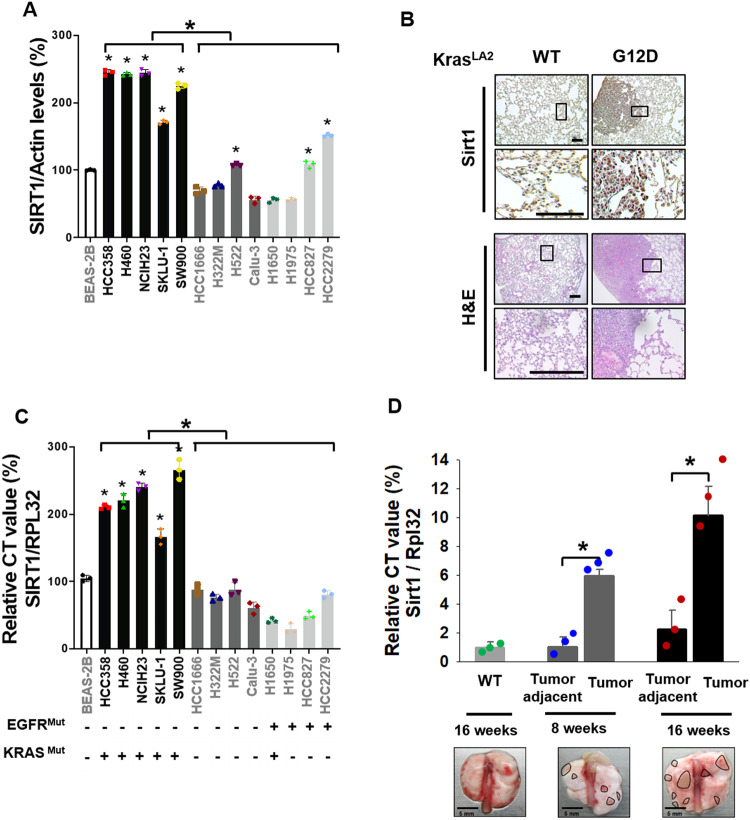
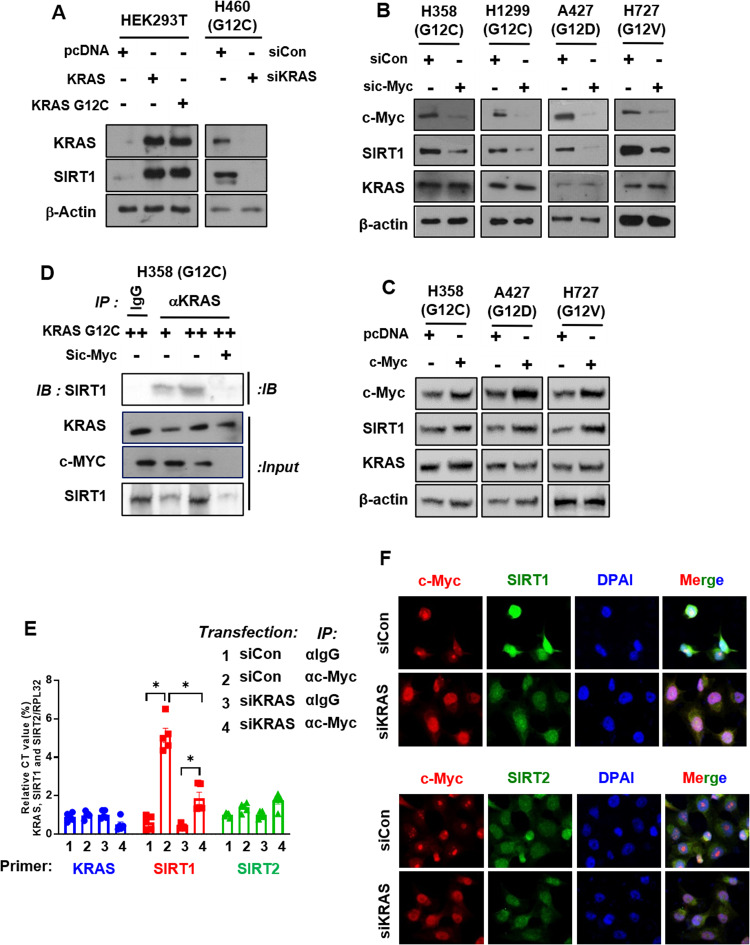
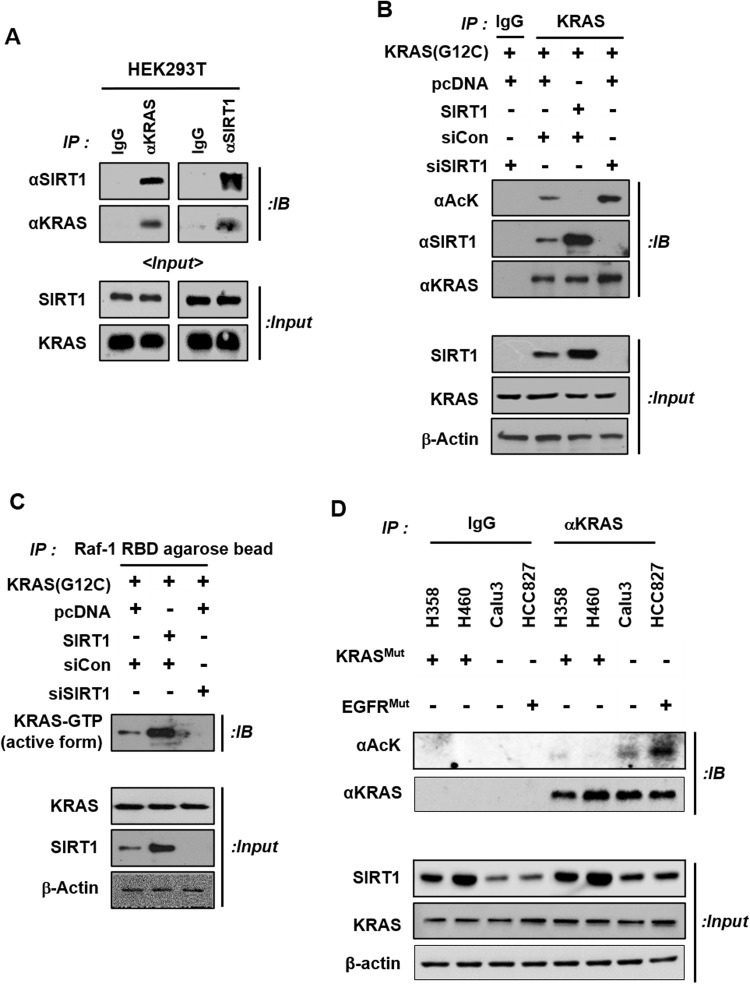
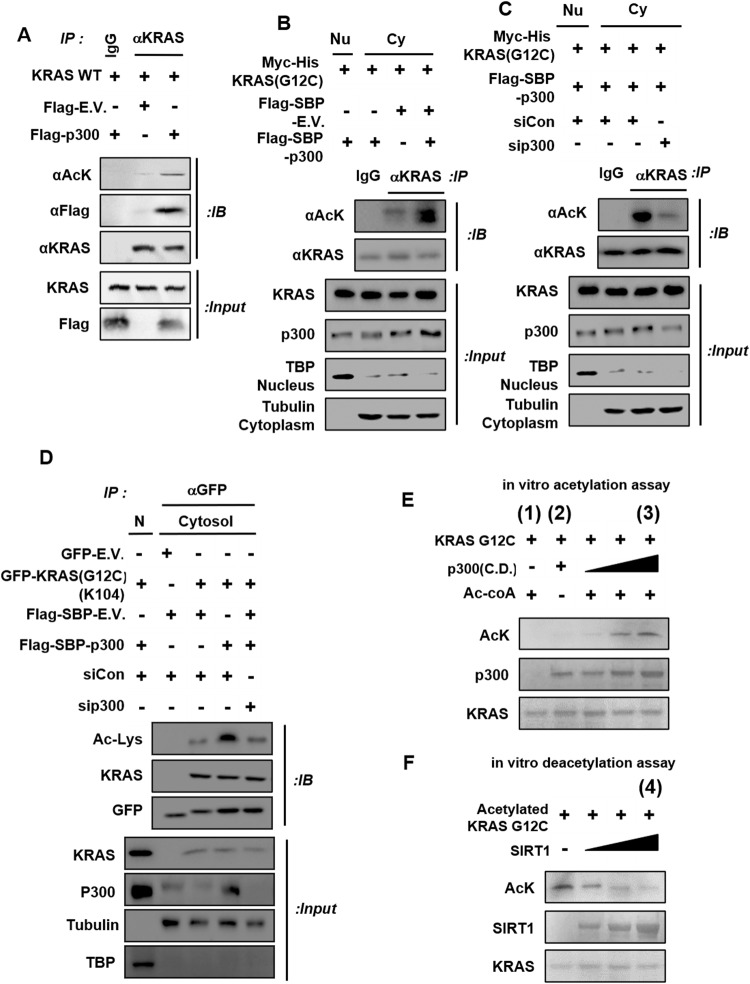
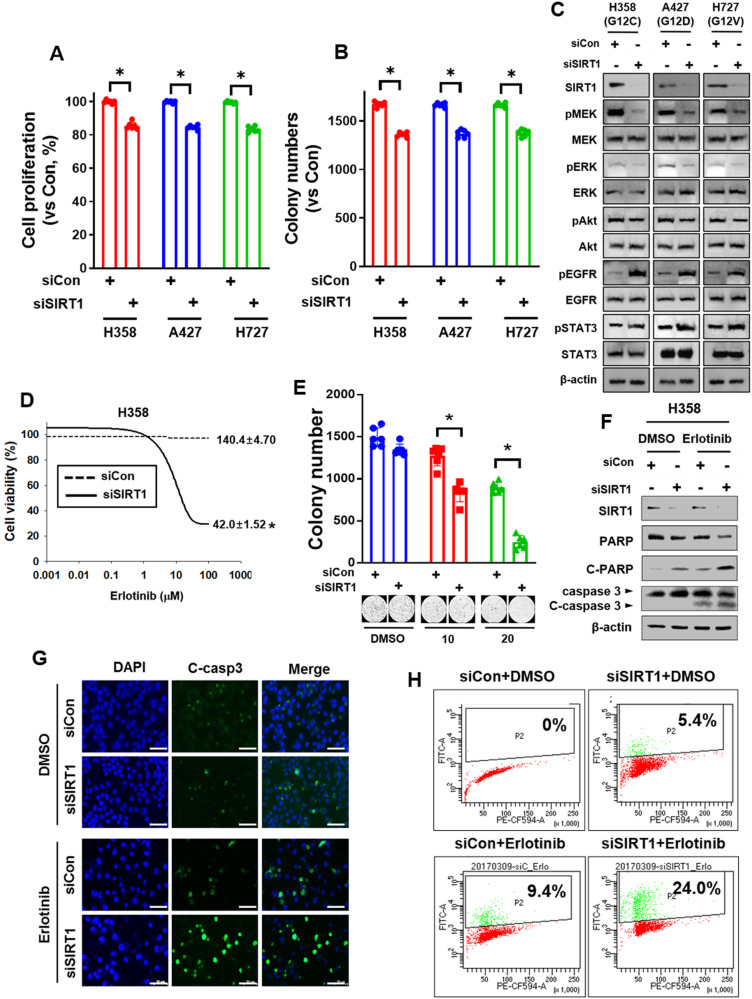
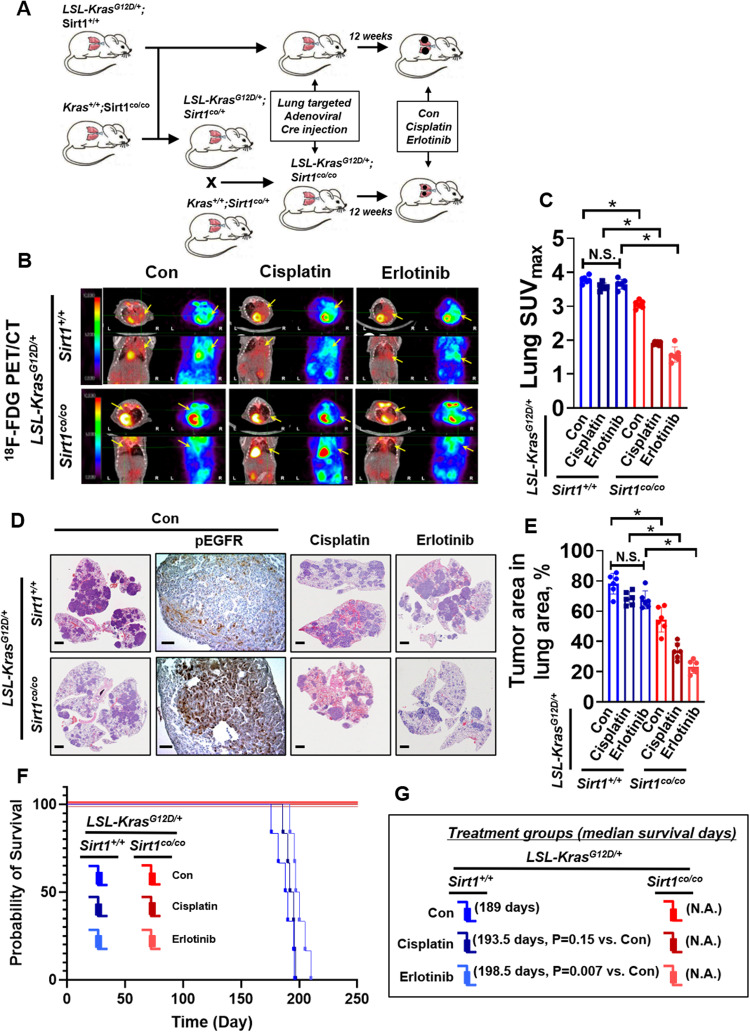
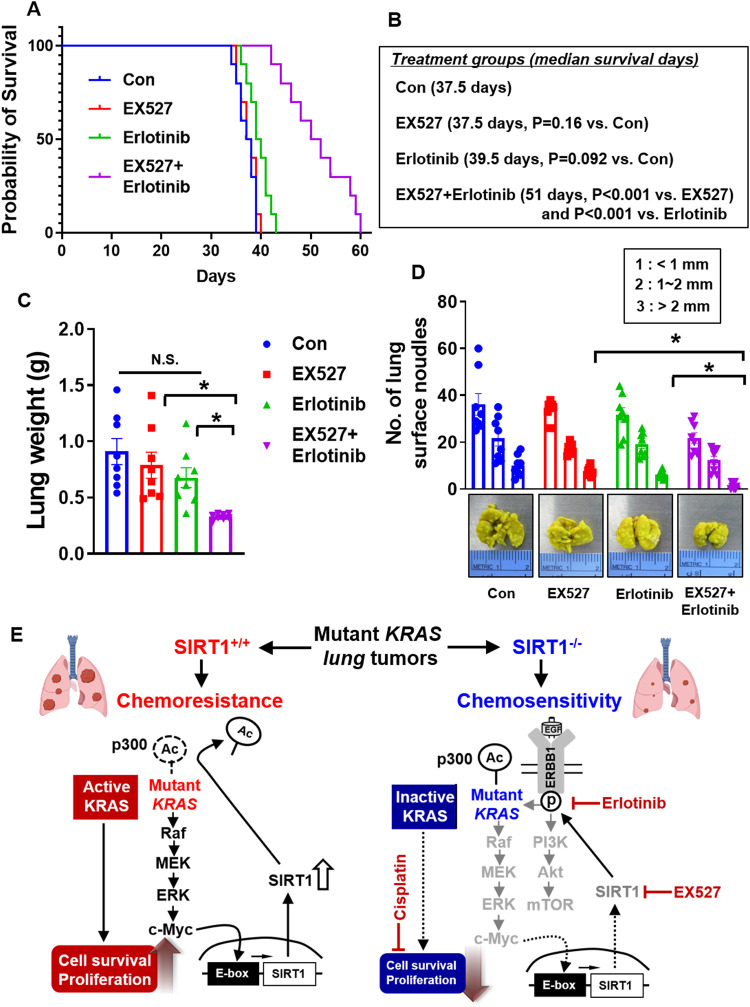
Kirsten rat sarcoma viral oncogene homologue (KRAS) is a frequent oncogenic driver of solid tumors, including non-small cell lung cancer (NSCLC). The treatment and outcomes of KRAS-mutant cancers have not been dramatically revolutionized by direct KRAS-targeted therapies because of the lack of deep binding pockets for specific small molecule inhibitors. Here, we demonstrated that the mRNA and protein levels of the class III histone deacetylase SIRT1 were upregulated by the KRASMut-Raf-MEK-c-Myc axis in KRASMut lung cancer cells and in lung tumors of a mouse model with spontaneous KrasG12D expression. KRASMut-induced SIRT1 bound to KRASMut and stably deacetylated KRASMut at lysine 104, which increased KRASMut activity. SIRT1 knockdown (K/D) or the SIRT1H363Y mutation increased KRASMut acetylation, which decreased KRASMut activity and sensitized tumors to the anticancer effects of cisplatin and erlotinib. Furthermore, in KrasG12D/+;Sirt1co/co mice, treatment with cisplatin and erlotinib robustly reduced the tumor burden and increased survival rates compared with those in spontaneous LSL-KrasG12D/+;Sirt1+/+ mice and mice in each single-drug treatment group. Then, we identified p300 as a KRASMut acetyltransferase that reinforced KRASMut lysine 104 acetylation and robustly decreased KRASMut activity. KRASMut lysine 104 acetylation by p300 and deacetylation by SIRT1 were confirmed by LC‒MS/MS. Consistent with this finding, the SIRT1 inhibitor EX527 suppressed KRASMut activity, which synergistically abolished cell proliferation and colony formation, as well as the tumor burden in KRASMut mice, when combined with cisplatin or erlotinib. Our data reveal a novel pathway critical for the regulation of KRASMut lung cancer progression and provide important evidence for the potential application of SIRT1 inhibitors and p300 activators for the combination treatment of KRASMut lung cancer patients.


Conflict of interest statement

The authors declare no competing interests.

Figures

Fig. 1
Fig. 1. SIRT1 is aberrantly upregulated in KRASMut NSCLC cell lines and tumors.
A SIRT1 protein expression was measured in one noncancerous lung epithelial cell line (BEAS-2B), five KRASMut cell lines (H358, H460, NCIH23, SKLU-1, and SW960), a KRASMut/EGFRMut cell line (H1650), five KRASWT/EGFRWT cell lines (HCC1666, H322M, H522, Calu-3, and H1650), and three EGFRMut cell lines (H1975, HCC827, and HCC2279). The area density of each band was measured with ImageJ software. The data were normalized to actin and are presented as the ratio with respect to the area density of actin. The data are plotted relative to the values obtained in the BEAS-2B cell line with SIRT1 expression. Student’s t test, mean ± SD; n = 3; *p < 0.05. B Representative immunohistochemical staining for SIRT1 and H&E staining in KrasLA2_WT and KrasLA2_G12D Tg mouse lungs at 16 weeks of age. Representative images are shown. Scale bar, 100 μm. The high-magnification images correspond to the areas marked by the black box. C SIRT1 mRNA expression was measured by quantitative real-time PCR in the same cell lines shown in Fig. 1A. RPL32 was used as an internal control and for normalization. Student’s t test, mean ± SD; n = 3; *p < 0.05. D The mRNA expression of Sirt1 was measured by RT‒qPCR in cancerous and adjacent noncancerous lung tissues of KrasLA2_G12D Tg mice. Rpl32 was used as an internal control and for normalization. Student’s t test, mean ± SEM; n = 3; *p < 0.05.
Fig. 2
Fig. 2. SIRT1 upregulation is mediated by c-Myc downstream of KRAS.
A HEK293T cells were transfected with pcDNA and KRASG12C plasmids (2 μg). H460 cells were transfected with siCon and siKRAS (80 nM). The cells were harvested with lysis buffer and subjected to western blotting. B, C KRASMut cells (H358, NCIH23, SKLU-1, SW900, A427, H727), KRASWT cells, and KRASG12C cells (H1299G12C) were transfected with siCon, c-Myc specific siRNA (80 nM), pcDNA, or c-Myc plasmid (2 μg) for 48 h, and the levels of the KRAS downstream effectors c-Myc and SIRT1 were measured. D H358 cells were transfected with KRASG12C and siCon or sic-Myc, and cell extracts were immunoprecipitated with an anti-KRAS antibody and immunoblotted with anti-SIRT1, anti-c-Myc, and anti-KRAS antibodies. E Chromatin immunoprecipitation-qPCR analysis of KRAS, SIRT1, and SIRT2 was performed in H358 cells transfected with siCon or siKRAS (80 nM) for 48 h and then immunoprecipitated using an anti-c-Myc antibody or mouse IgG as a negative control. The relative enrichment was calculated by normalizing the qPCR signals. The data are plotted as the mean values determined from at least two independent chromatin immunoprecipitation assays and three independent amplification reactions. Student’s t test, mean ± SD; n = 6; *p < 0.05. F H358 cells were transfected with siCon and siKRAS (80 nM) for 48 h and then fixed after 4 h. c-Myc expression was detected with an RFP emission filter, and SIRT1 expression was detected with a GFP emission filter.
Fig. 3
Fig. 3. KRASMut-induced SIRT1 rebinds to KRASMut and increases KRAS activity via deacetylation.
A HEK293T cells were transfected with KRASG12C and SIRT1 plasmids (4 μg), and cell extracts were immunoprecipitated with anti-KRAS and anti-SIRT1 antibodies and immunoblotted with the reciprocal antibody. B, C Plasmids (pcDNA, KRASG12C, and SIRT1 each 4 μg) and siRNAs (siCon and siSIRT1, each 80 nM) were transfected into HEK293T cells. Cell extracts were immunoprecipitated with an anti-KRAS antibody and Raf-1 agarose beads and analyzed using anti-acetylated lysine, anti-SIRT1, anti-KRAS, and anti-KRAS-GTP antibodies. D Normal lung epithelial cell, fibroblast, and KRAS Mut cell lysates were immunoprecipitated with an anti-KRAS antibody and immunoblotted with anti-acetyl-lysine and anti-KRAS antibodies.
Fig. 4
Fig. 4. SIRT1 deacetylates lysine 104 of KRASG12C.
A H358 cell extracts were immunoprecipitated with anti-KRAS and anti-SIRT1 antibodies and immunoblotted with anti-KRAS and anti-SIRT1 antibodies. B H358 cells were transfected with pcDNA and SIRT1 (4 μg), siCon, and siSIRT1 (80 nM) and then immunoblotted with anti-acetylated lysine, anti-KRAS-GTP, and anti-KRAS antibodies. C The amino acid sequence of KRASG12C is shown. Lysine acetylation residues are marked as K in bold font. D HEK293T cells were transfected with GFP-E.V., GFP-KRASG12C (with three of the four lysine acetylation residues [K101, K104, K128, and K147] sequentially mutated to arginine), Flag-SBP-E.V., Flag-SBP-SIRT1, siCon, and/or siSIRT1 and incubated for 48 h. Protein lysates were subjected to immunoprecipitation with an anti-GFP antibody and then immunoblotted using anti-acetylated lysine, anti-KRAS, and anti-GFP antibodies.
Fig. 5
Fig. 5. KRASMut lysine 104 is acetylated by the p300 acetyltransferase.
A HEK293T cells were transfected with KRASWT, Flag-E.V., and Flag-p300 plasmids. Cell lysates were immunoprecipitated with IgG and an anti-KRAS antibody and then immunoblotted with anti-acetyl-lysine, anti-Flag, and anti-KRAS antibodies. B, C Myc-His-KRASG12C, Flag-SBP-E.V., Flag-SBP-p300, siCon, and/or sip300 were overexpressed in HEK293T cells; after 48 h, cell lysates were separated into nuclear and cytoplasmic fractions, which were subjected to immunoprecipitation with an anti-KRAS antibody and immunoblotting with anti-acetylated lysine and anti-KRAS antibodies. TATA-binding protein was used as a nuclear marker, and tubulin was used as a cytoplasmic marker to verify that nuclear separation was successful. D HEK293T cells were transfected with GFP-E.V., GFP-KRAS (all lysine residues between a.a. 101 and 147 except for K104 mutated to arginine), Flag-SBP-E.V., Flag-SBP-p300, siCon, and/or sip300. Protein lysates were immunoprecipitated with an anti-GFP antibody and then immunoblotted with anti-acetylated lysine, anti-KRAS, and anti-GFP antibodies. E The recombinant KRASG12C protein and the p300 C.D. (catalytic domain, aa 1284–1674, 45.1 kDa) were incubated in the acetylation assay reaction mixture at 32 °C for 4 h, and lysine-acetylated peptides were then identified using an anti-acetyl-lysine antibody. F Lysine-acetylated KRASG12C peptides were also incubated with recombinant SIRT1 protein in the deacetylation assay reaction mixture for 4 h. Deacetylation was quantified using an anti-acetyl-lysine antibody.
Fig. 6
Fig. 6. SIRT1 inactivation increases apoptosis and therapeutic efficacy in KRASMut cells.
A, B and D, E H358 cells were transfected with siCon or siSIRT1 (80 nM) and then seeded into 96-well plates for a growth assay A, D and into 12-well plates on agarose gel for a colony formation assay B, E. A, B without erlotinib; D, E dose-dependent treatment with erlotinib. Student’s t test, mean ± SD; n = 6; *p < 0.05. C H358, A427, and H727 cells were transfected with siCon or siSIRT1 (80 nM) and then immunoblotted with anti-SIRT1, anti-pMEK, anti-MEK, anti-pERK, anti-ERK, anti-pAkt, anti-Akt, anti-pEGFR, anti-EGFR, anti-pSTAT3, anti-STAT3, and anti β-actin antibodies. FH H358 cells were transfected with siCon or siSIRT1 (80 nM) and treated with erlotinib (10 μM). F Cell lysates were immunoblotted with anti-PARP and anti-caspase-3 antibodies. G Cells treated with the drugs were subjected to immunofluorescence staining and H analysis of DNA damage using the APO-BrdU TUNEL assay.
Fig. 7
Fig. 7. Sirt1 potentiates the anticancer effect of chemotherapy and EGFR TKI treatment against KrasG12D-induced lung tumorigenesis.
A Schematic of genetic manipulation of LSL-KrasG12D/+ and/or Sirt1co/co mice before and after adenoviral Cre administration. B PET images of mice between 22 and 23 weeks of age. All images were normalized to the same maximal standard uptake value (SUVmax) to facilitate the comparison of PET lesions. The yellow arrow indicates the tumor region. Cisplatin (7 mg/kg/1 time/week, i.p.) and erlotinib (15 mg/kg/2 times/week, i.p.) were administered beginning 13 weeks after Ad-cre virus injection. C Quantification of the tumor uptake value (SUVmax) and mean standardized uptake value (SUVmax) in the lung. Student’s t test, mean ± SEM; n = 6; *p < 0.05. D Representative H&E-stained lung sections from LSL-KrasG12D/+;Sirt1+/+ and LSL-KrasG12D/+;Sirt1co/co mice. The bars represent 800 μm. E Average tumor number per lung area in specimens collected from LSL-KrasG12D/+;Sirt1+/+ (n = 6) and LSL-KrasG12D/+;Sirt1co/co (n = 6) mice between 24 and 27 weeks. Student’s t test, mean ± SEM; n = 6; *p < 0.05. F Survival rates of LSL-KrasG12D/+;Sirt1+/+ (n = 6) and LSL-KrasG12D/+;Sirt1co/co (n = 6) mice following Cre induction (log-rank test). G Median survival times (days) and P values were calculated using the log-rank test and Gehan-Breslow-Wilcoxon test on the basis of Student’s t test, respectively.
Fig. 8
Fig. 8. SIRT1 inhibitor treatment is required for the synergistic therapeutic efficacy of EGFR TKIs in the KRASG12C lung orthotopic tumor model.
A H358 cells were injected intratracheally into nude mice (1 × 106 cells/mouse). Tumors were allowed to establish for 10 days before the mice were randomized into treatment groups. Survival curves of lung orthotopic tumor-bearing mice. n = 10; *p < 0.05. Two-way ANOVA. The mouse survival curves were generated and visualized using the Kaplan‒Meier method. Therapeutic candidate drugs, including EX527 (10 mg/kg/3 times/week, i.p.) and erlotinib (15 mg/kg/2 times/week, i.p.) were administered as specified. Mice were euthanized at the first indication of morbidity, and the lungs were excised and stained with Bouin’s fixative. B Median survival times (days) and P values were calculated by the log-rank test and Gehan-Breslow-Wilcoxon test, respectively. *p < 0.001. On the basis of Student’s t test. C Tumor weights were measured after tumor excision from the mice. Student’s t test was performed for statistical analysis, and the values are shown as the means ± SEMs; n = 8; *p < 0.05. D The colonies formed in the lungs were counted based on colony size: less than 1 mm, between 1 mm and 2 mm, and more than 2 mm. Student’s t test was performed for statistical analysis, and the values are shown as the means ± SEMs; n = 8; *p < 0.05. E Schematic overview of the chemoresistance mechanism of KRASMut-induced SIRT1 and definition of a rational combination strategy to overcome chemoresistance in KRASMut cancers.

References

    1. Ferlay J, et al. Cancer incidence and mortality worldwide: sources, methods and major patterns in GLOBOCAN 2012. Int. J. Cancer. 2015;136:E359–E386. doi: 10.1002/ijc.29210. - DOI - PubMed
    1. Wong M, Lao XQ, Ho K-F, Goggins WB, Tse SL. Incidence arend mortality of lung cancer: global trends and association with socioeconomic status. Sci. Rep. 2017;7:1–9. - PMC - PubMed
    1. Brambilla E, Travis WD, Colby T, Corrin B, Shimosato Y. The new World Health Organization classification of lung tumours. Eur. Resp. J. 2001;18:1059–1068. doi: 10.1183/09031936.01.00275301. - DOI - PubMed
    1. Group NM-aC. Preoperative chemotherapy for non-small-cell lung cancer: a systematic review and meta-analysis of individual participant data. Lancet. 2014;383:1561–1571. doi: 10.1016/S0140-6736(13)62159-5. - DOI - PMC - PubMed
    1. Chevallier M, Borgeaud M, Addeo A, Friedlaender A. Oncogenic driver mutations in non-small cell lung cancer: past, present and future. World J. Clin. Oncol. 2021;12:217. doi: 10.5306/wjco.v12.i4.217. - DOI - PMC - PubMed

Publication types

MeSH terms