. 2023 Oct;55(10):2238-2247.
doi: 10.1038/s12276-023-01095-w. Epub 2023 Oct 2.

Lactate as a major epigenetic carbon source for histone acetylation via nuclear LDH metabolism

Affiliations

Lactate as a major epigenetic carbon source for histone acetylation via nuclear LDH metabolism

Yong Jin An et al. Exp Mol Med. 2023 Oct.

Abstract

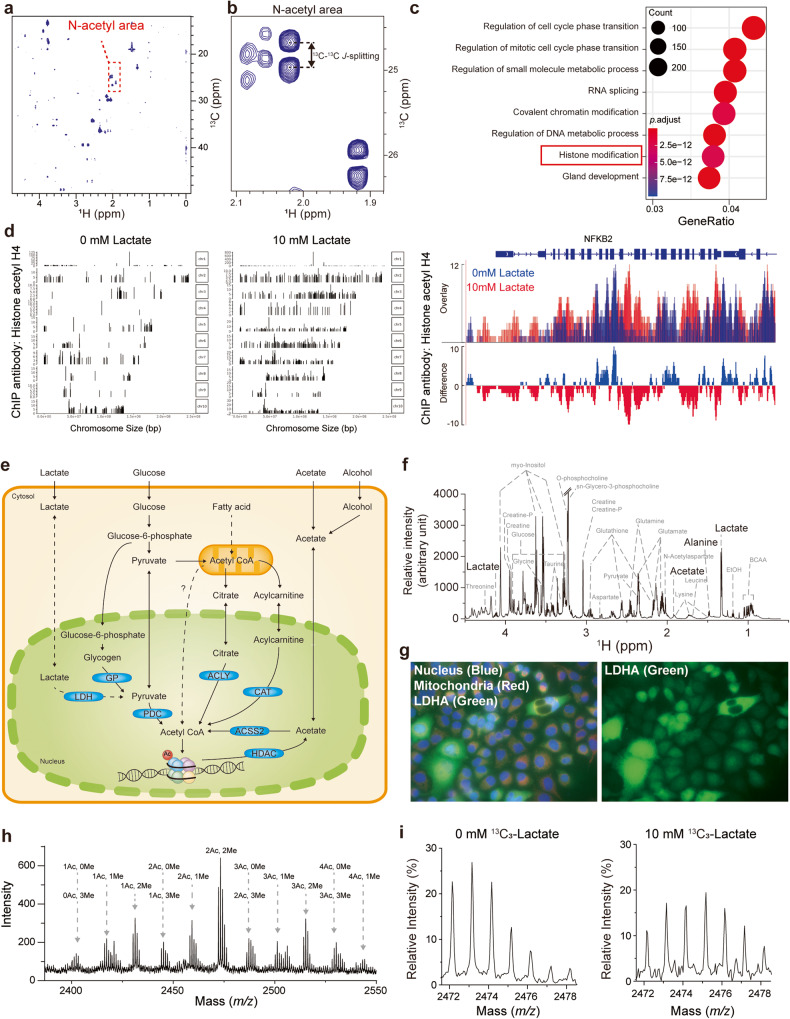
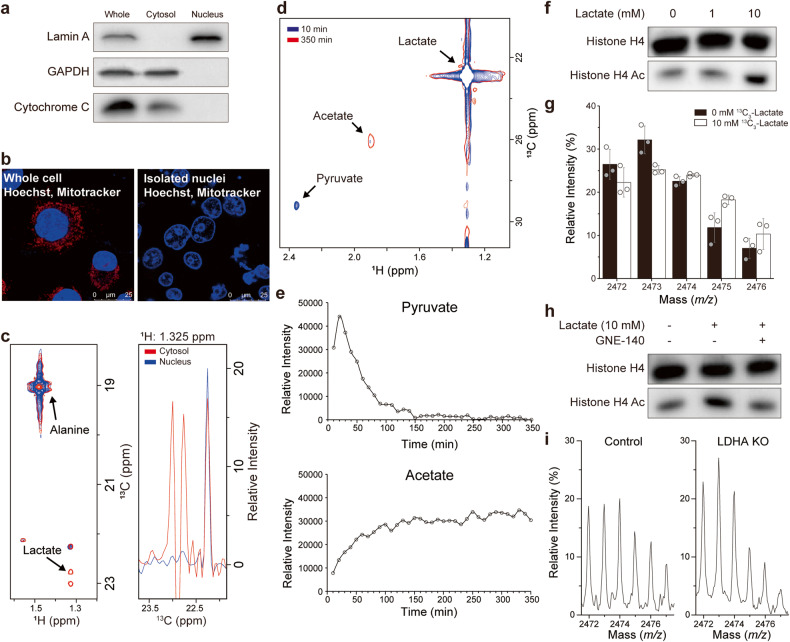
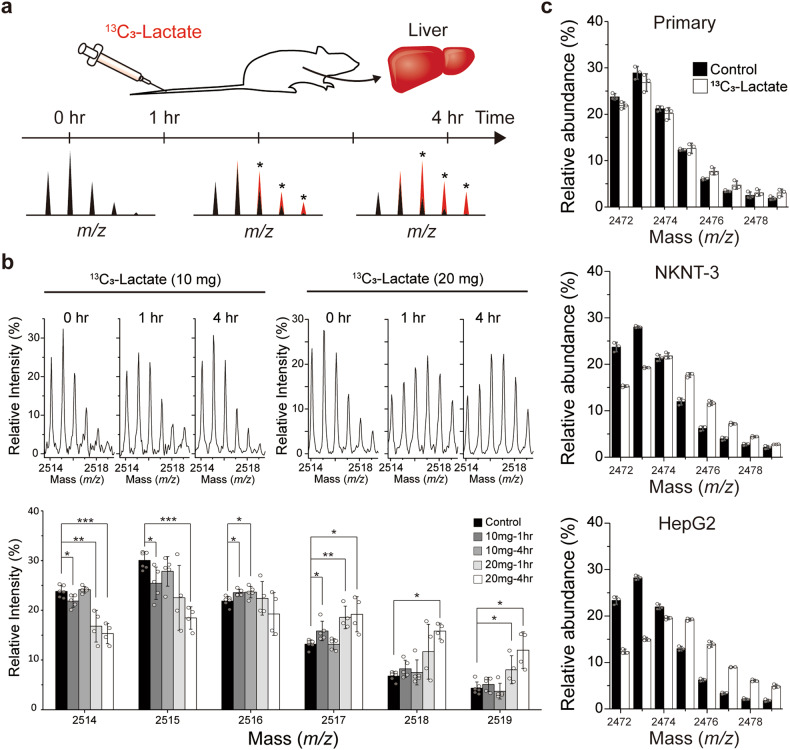
Histone acetylation involves the transfer of two-carbon units to the nucleus that are embedded in low-concentration metabolites. We found that lactate, a high-concentration metabolic byproduct, can be a major carbon source for histone acetylation through oxidation-dependent metabolism. Both in cells and in purified nuclei, 13C3-lactate carbons are incorporated into histone H4 (maximum incorporation: ~60%). In the purified nucleus, this process depends on nucleus-localized lactate dehydrogenase (LDHA), knockout (KO) of which abrogates incorporation. Heterologous expression of nucleus-localized LDHA reverses the KO effect. Lactate itself increases histone acetylation, whereas inhibition of LDHA reduces acetylation. In vitro and in vivo settings exhibit different lactate incorporation patterns, suggesting an influence on the microenvironment. Higher nuclear LDHA localization is observed in pancreatic cancer than in normal tissues, showing disease relevance. Overall, lactate and nuclear LDHA can be major structural and regulatory players in the metabolism-epigenetics axis controlled by the cell's own status or the environmental status.


Conflict of interest statement

The authors declare no competing interests.

Figures

Fig. 1
Fig. 1. Cellular lactate metabolism provides carbons for histone acetylation.
a 1H-13C 2D HSQC spectrum for the extract of PANC-1 cells treated with 10 mM 13C3-lactate. The dashed box corresponds to the acetyl signals from N-acetyl compounds. b 13C-13C J-splitting of acetyl signals of N-acetyl compounds. c Gene Ontology analysis of genes affected by 10 mM lactate treatment in MCF-7 cells. d Differences in ChIP peaks of histone acetyl H4 on chromosomes following 0 or 10 mM lactate treatment in PANC-1 cells (left panel). Difference in the ChIP peak of histone acetyl H4 at the NFKB2 gene region, chr10:102,392,109-102,404,529 (right panel). 0 mM lactate: blue; 10 mM lactate: red; gray box: promoter region. e External carbon sources for histone acetylation and related metabolism: lactate (current study) and others from the literature. CAT carnitine acetyltransferase, GP glycogen phosphorylase, HDAC histone deacetylases, PDC pyruvate dehydrogenase complex. f Intracellular metabolites of PANC-1 cells as observed by 1H-NMR. PANC-1 cells were grown in 100 pi dishes with DMEM, and metabolites were extracted using chloroform, methanol, and DW. Metabolite concentrations were obtained from the integration of these peaks with Chenomx software (Edmonton, Canada). g Nuclear localization of LDHA in PANC-1 cells as visualized by immunofluorescence. The nucleus was stained with Hoechst (blue), mitochondria with MitoTracker (red), and LDHA with an antibody conjugated with Alexa 488 (green). h MALDI-TOF spectrum of the histone H4 tail generated by Asp-N digestion of histones from PANC-1 cells. Peak clusters for different combinations of methylation and acetylation are indicated. i 2Ac, 2Me cluster on H4 MALDI-TOF spectrum from PANC-1 treated with 0 or 10 mM 13C3-lactate. The spectra were normalized according to the total intensities within each cluster.
Fig. 2
Fig. 2. Lactate incorporation into H4 in isolated nuclei by nuclear LDHA.
a Analysis of the purity of isolated nuclei by western blotting. Lamin A was used as a nuclear marker, GAPDH was used as a cytosolic marker, and Cytochrome C was used as a mitochondrial marker. b Purity and membrane integrity of isolated nuclei by immunofluorescence. The nucleus was stained with Hoechst (blue), and the mitochondria were stained with MitoTracker (red). c Test of cytosolic contamination with cytosolic alanine transaminase activity. Left, overlay of 1H-13C 2D HSQC spectra for separated cytosol (red) and nuclear (blue) fractions after addition of 13C3-alanine. Right, 1D slice of the left 2D spectra along the lactate peak at 1H = 1.325 ppm. d Metabolism of 13C3-lactate in isolated nuclei as observed with 35 cycles of 10 min by 1H-13C 2D HSQC. The figure shows the spectra of the first cycle (blue) and the last cycle (red). e Real-time metabolism of 13C3-lactate in isolated nuclei monitored with in-nucleus NMR. The graphs represent the peak intensities for pyruvate (upper) and acetate (lower), hence the time-dependent metabolite changes. f Concentration-dependent effects of lactate on H4 histone acetylation in isolated nuclei. g M/z values of the MALDI-TOF spectrum of the Asp-N digest of H4 obtained from isolated nuclei treated with 0 (filled bars) or 10 mM (empty bars) 13C3-lactate. The plot is for the 2-methylation and 2-acetylation cluster normalized to the sum of the total intensities of each group. h Effects of GNE-140 (100 μM), an LDH inhibitor, on histone acetylation in isolated nuclei. i Representative MALDI-TOF spectra of the Asp-N digest of histone H4 for isolated nuclei from control and LDHA-KO PANC-1 cells treated with 10 mM 13C3-lactate (same cluster and normalization as in g).
Fig. 3
Fig. 3. Lactate incorporation into H4 in the mouse liver.
a Strategies for the in vivo labeling experiment with circulating lactate. 13C3-lactate at doses of 0.5 and 1 g/kg was injected into the tail veins, and the mice were sacrificed at 0, 1, and 4 hr. Liver tissues were obtained and analyzed for 13C-labeled histone with MALDI-TOF. The schematic spectra at the bottom represent the expected patterns. b Representative MALDI-TOF spectra for the Asp-N-digested H4 tail obtained from mouse liver. The cluster of 2-methylated, 3-acetylated histone H4 and normalization are as in Fig. 2g. The bottom graphs are for the peak intensities from the biological replicates (n = 6 for control, 5 for 10 mg groups, and 4 for 20 mg groups), *p < 0.05, **p < 0.005, ***p < 0.0005 (Student’s t test). c Acetylation status of the histone H4 tail in different liver cell lines treated with 13C3-lactate (10 mM). H4 incorporation was analyzed according to the MALDI-TOF spectrum. The cluster of 2-methylated, 2-acetylated histone H4 was normalized by the sum of its total intensities (n = 3).
Fig. 4
Fig. 4. Differential nuclear localization of LDHA in human cancer and normal tissues.
Immunohistochemical staining of LDHA in human normal tissues (left) and cancer tissues (right). a Liver tissues from the Human Protein Atlas. b Pancreatic tissues from the Human Protein Atlas. c Representative images from the patient samples that were stained in the current study (n = 5). Upper: normal tissues; Lower: cancer tissues. Left-most: Bright field images. From the second-left to right: IHC Profiler analysis of LDHA level (DAB), nuclear space (hematoxylin), and overlay of DAB and hematoxylin. d Quantification of the nuclear localization of LDHA with IHC Profiler for the images in c. Filled bars are for normal tissues, and empty bars are for cancer tissues. Five random areas (empty circles) were chosen from the images in c, and the pixel intensities were analyzed. The error bars indicate the standard deviations.

References

    1. Faubert B, et al. Lactate metabolism in human lung tumors. Cell. 2017;171:358–371.e9. doi: 10.1016/j.cell.2017.09.019. - DOI - PMC - PubMed
    1. Kennedy KM, et al. Catabolism of exogenous lactate reveals it as a legitimate metabolic substrate in breast cancer. PLoS ONE. 2013;8:e75154. doi: 10.1371/journal.pone.0075154. - DOI - PMC - PubMed
    1. Lee DC, et al. A lactate-induced response to hypoxia. Cell. 2015;161:595–609. doi: 10.1016/j.cell.2015.03.011. - DOI - PubMed
    1. Roland CL, et al. Cell surface lactate receptor GPR81 is crucial for cancer cell survival. Cancer Res. 2014;74:5301–5310. doi: 10.1158/0008-5472.CAN-14-0319. - DOI - PMC - PubMed
    1. Hui S, et al. Glucose feeds the TCA cycle via circulating lactate. Nature. 2017;551:115–118. doi: 10.1038/nature24057. - DOI - PMC - PubMed

Publication types