. 2023 Oct 2;13(1):34.
doi: 10.1007/s13659-023-00401-3.

Marine natural product lepadin A as a novel inducer of immunogenic cell death via CD91-dependent pathway

Affiliations

Marine natural product lepadin A as a novel inducer of immunogenic cell death via CD91-dependent pathway

Dalila Carbone et al. Nat Prod Bioprospect. .

Abstract

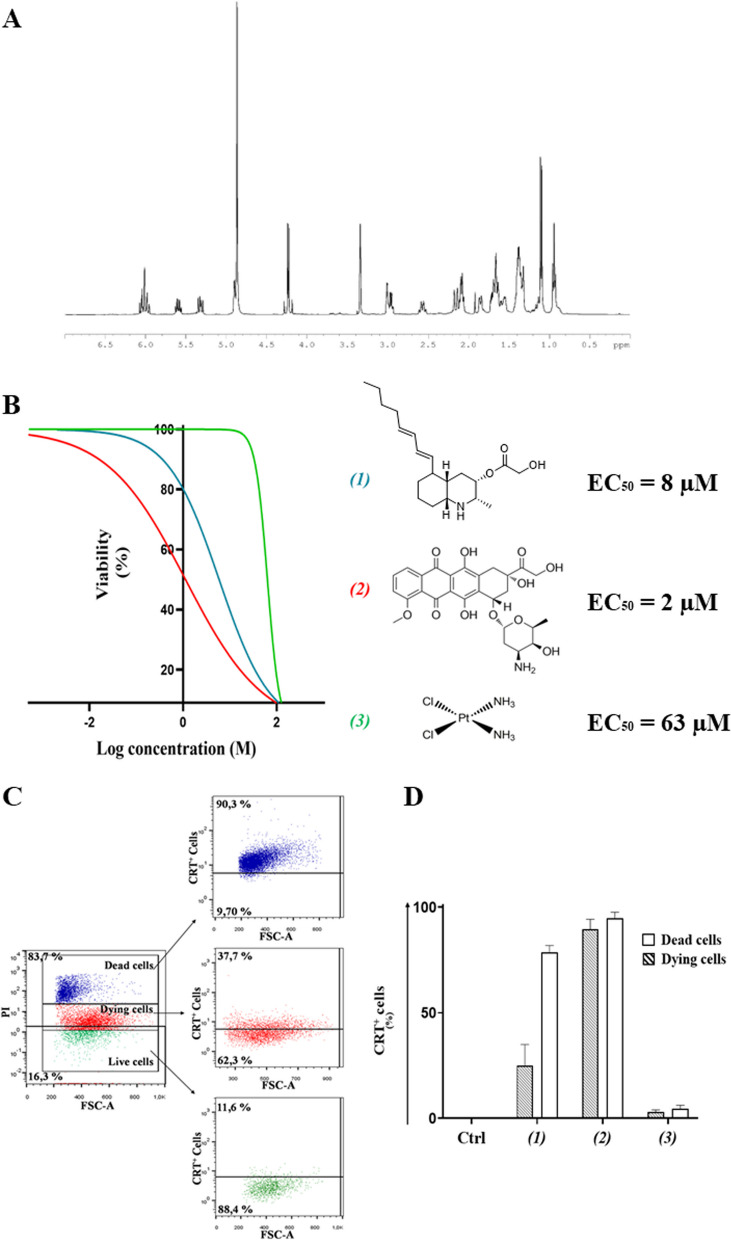
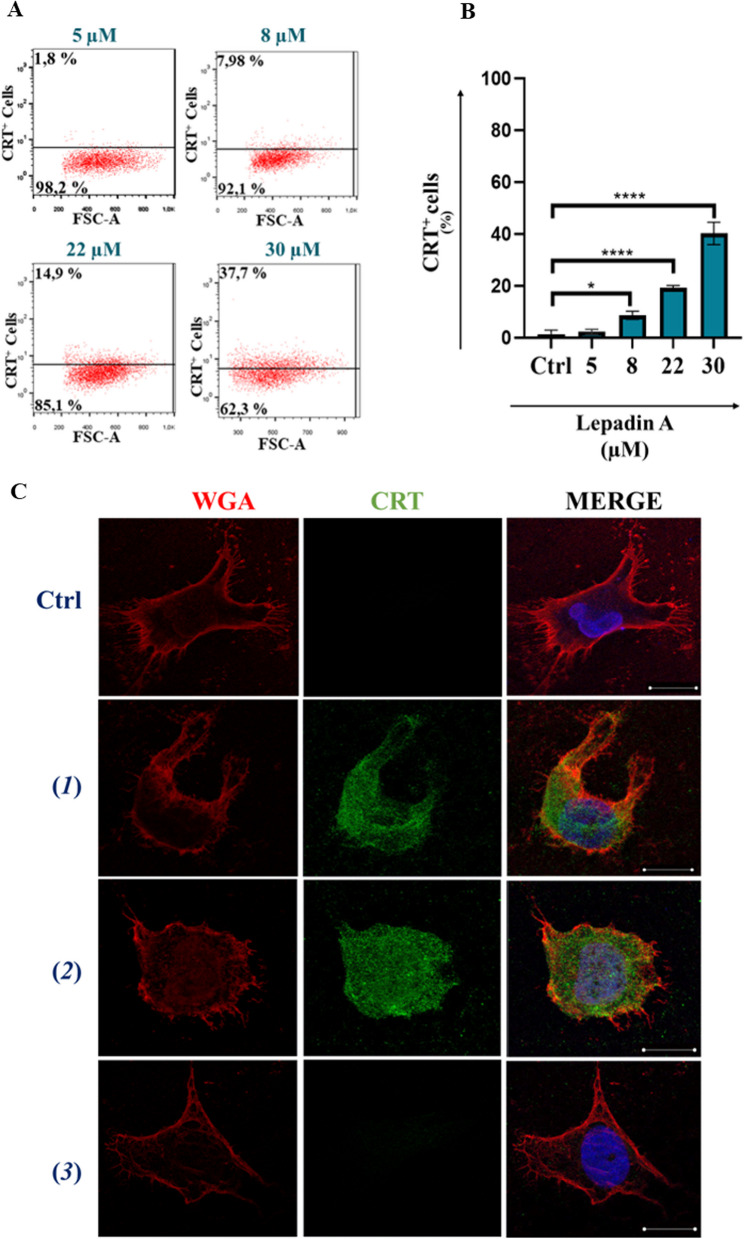
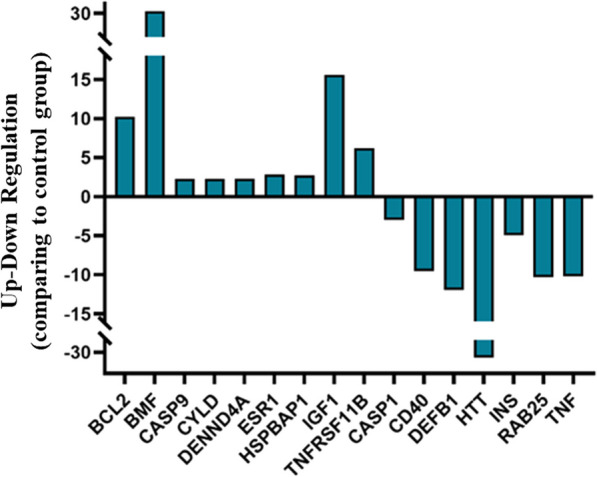
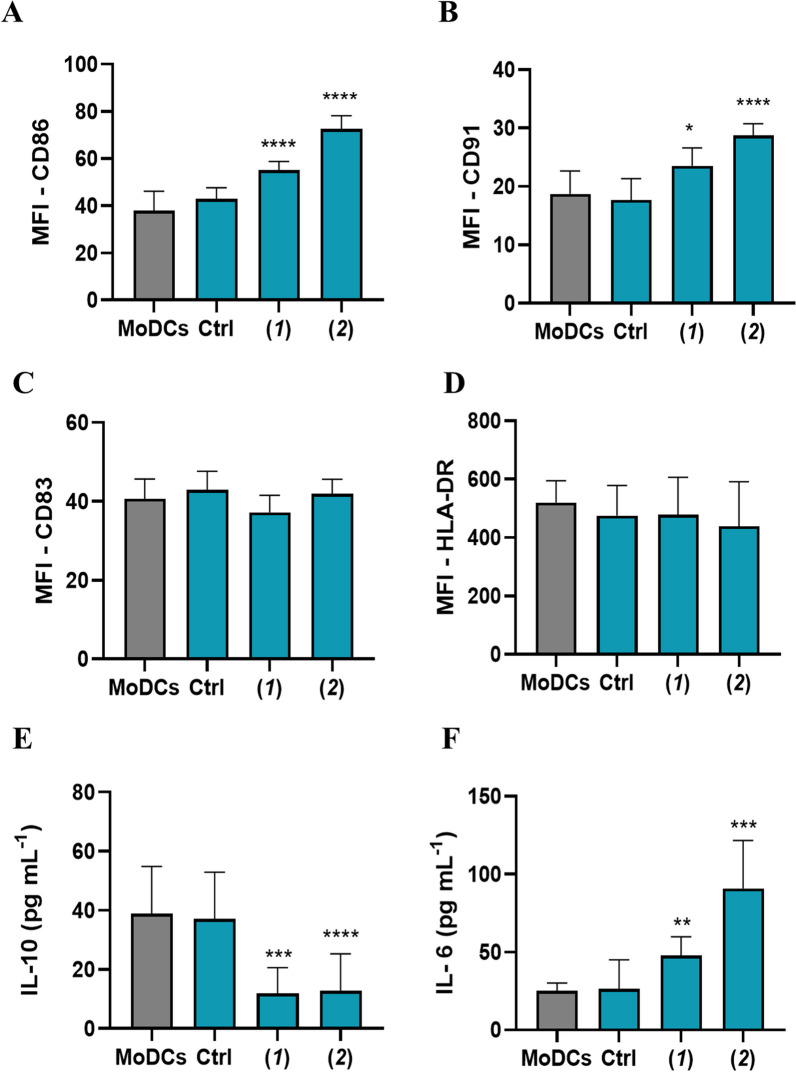
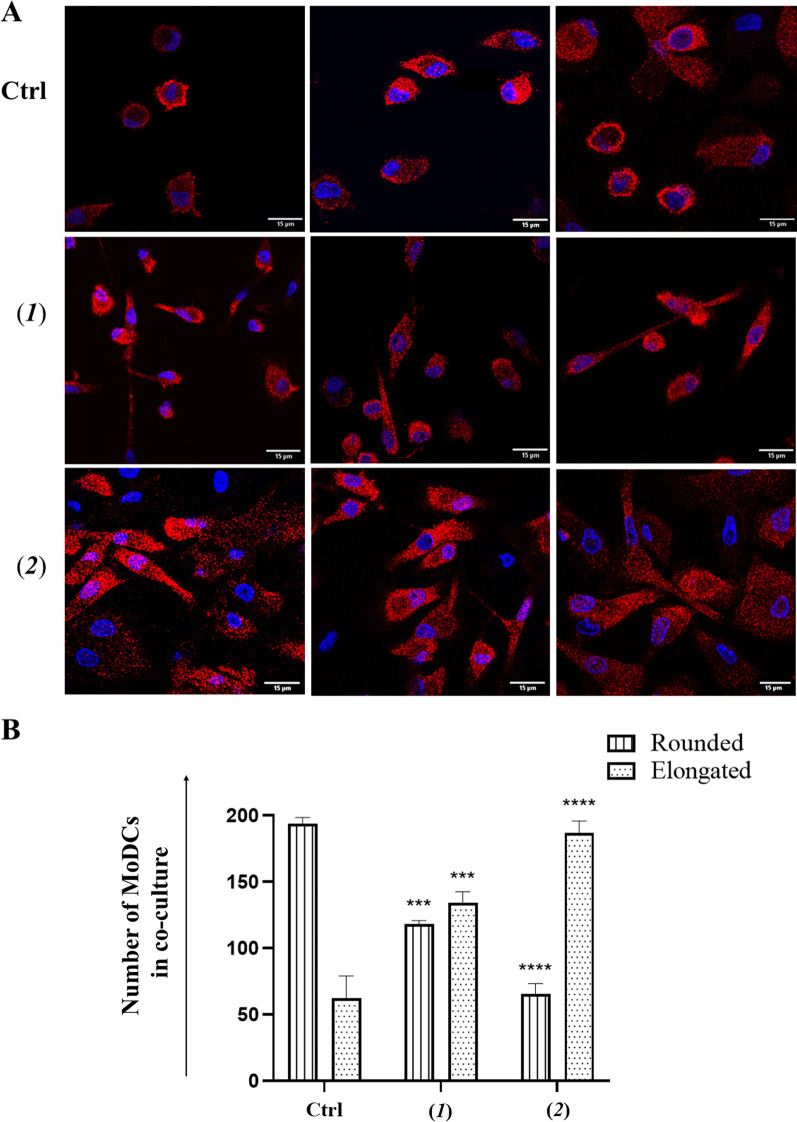
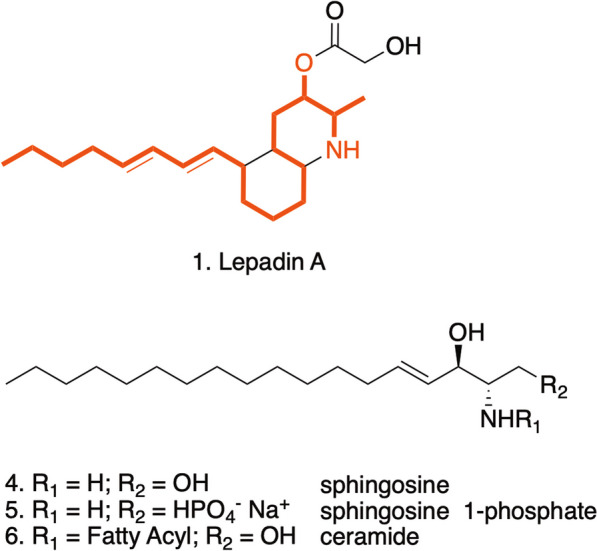
Immunogenic Cell Death (ICD) represents a mechanism of enhancing T cell-driven response against tumor cells. The process is enabled by release of damage-associated molecular patterns (DAMPs) and cytokines by dying cells. Based on molecular studies and clinical marker assessment, ICD can be a new target for cancer chemotherapy hitherto restricted to a few conventional anticancer drugs. In view of the development of small molecules in targeted cancer therapy, we reported the preliminary evidence on the role of the natural product lepadin A (1) as a novel ICD inducer. Here we describe the ICD mechanism of lepadin A (1) by proving the translocation of the protein calreticulin (CRT) to the plasma membrane of human A2058 melanoma cells. CRT exposure is an ICD marker in clinical studies and was associated with the activation of the intrinsic apoptotic pathway in A2058 cells with lepadin A (1). After the treatment, the tumour cells acquired the ability to activate dendritic cells (DCs) with cytokine release and costimulatory molecule expression that is consistent with a phenotypic profile committed to priming T lymphocytes via a CD91-dependent mechanism. The effect of lepadin A (1) was dose-dependent and comparable to the response of the chemotherapy drug doxorubicin (2), a well-established ICD inducer.

Keywords: Anticancer; Drug discovery; Immunogenic cell death; Immunotherapy; Natural products.


Conflict of interest statement

The authors have no competing interests.

Figures

Fig. 1
Fig. 1
A 1H-NMR spectrum of lepadin A (1). The spectrum was recorded in CDCl3 at 600 MHz. B Cytotoxic activity of lepadin A (1), doxorubicin (2) and cisplatin (3) in the concentration range from 2 nM to 100 µM on human A2058 melanoma cells. A nonlinear regression analysis was performed for the estimation of the EC50 (50% of the effective concentration) reported alongside the chemical structures of the tested molecules. C Representative flow cytometry analyses with 8 μM lepadin A (1). Cells were gated according to forward (FSC) and viability (PI) signals. Selected populations were further selected on the fluorescence intensity due to the exposed CRT on the cell surface. Percentage refers to the fraction of CRT+ cells in each population. Blue = dead cells; Red = dying cells; Green = viable cells; D CRT exposure in A2058 cells treated with lepadin A (1), doxorubicin (2) and cisplatin (3). Percentage (n = 3) of CRT exposed on the surface of dead and dying cells after 24 h from the addition of compounds 1–3 at the EC50 concentrations. Ctrl = untreated cells. Statistical significance (****p < 0.0001) was established by One Way Anova
Fig. 2
Fig. 2
Effect of lepadin A (1) on A2058 melanoma cells. A Representative experiment of scatter (FSC-A) versus CRT fluorescence dot plots related to dying cells after treatment with increasing concentration (from 5 to 30 µM) of lepadin A (1). B Percentage (n = 3) of CRT exposed on the surface of dying cells after 24 h by different concentrations of lepadin A (1). Ctrl = untreated cells. Statistical significance (*p < 0.5; ****p < 0.0001) was established by One Way Anova. C Representative confocal microscopy images of A2058 cells treated with lepadin A (1), doxorubicin (2) and cisplatin (2). Ctrl = untreated cells. Cells were stained with DAPI (blue) for nuclei, Calreticulin monoclonal antibody conjugated at Alexa fluor 488 secondary antibody (green) for CRT, and wheat germ agglutinin (WGA) (red) for plasma membranes. Merged confocal images or individual channels are shown. Images were acquired on a Zeiss LSM 700 confocal microscope, with a 63X objective (NA 1.4) and a zoom of 1.5 and 2 respectively. Scale bar 5 μm
Fig. 3
Fig. 3
Differential expression analysis of genes related to cellular death mechanisms after treatment of A2058 cells with lepadin A (1). Bar plot comparing gene expression fold changes identified by microarray analysis. The x axis denotes the differentially expressed genes and the y axis represents the fold difference for mRNA levels in treated and untreated samples
Fig. 4
Fig. 4
Phenotypic analysis of MoDCs in co-culture with A2058 cells (n = 6). AD Flow cytometry analysis represent the Mean Fluorescence Intensity (MFI) of surface expression of CD86, CD91, CD83 and HLA-DR; E, F IL-10 and IL-6 cytokine levels (pg/mL−1) measured by ELISA assay in the supernatant. MoDCs = dendritic cells. Ctrl = MoDCs cocultured with untreated A2058 cells. (1) = MoDCs cocultured with A2058 cells treated with lepadin A (1). (2) = MoDCs cocultured with A2058 cells treated with doxorubicin (2). Statistical significance (*p < 0.5; ***p < 0.001; ****p < 0.0001) was established by One Way Anova
Fig. 5
Fig. 5
Morphological variation of MoDCs in co-culture with A2058 cells. A Representative confocal microscopy images of MoDCs from cocultures with A2058 cells treated with lepadin A (1), doxorubicin (2). MoDCs were selectively stained in red with HLA-DR monoclonal antibody conjugated with Alexa Fluor 647 secondary antibody. DAPI (blue) was used for nuclei. Merged confocal images or individual channels are shown. Images were acquired on a Zeiss LSM 700 confocal microscope, with a 63X objective (NA 1.4) and a zoom of 1.5 and 2 respectively. Scale bar 15 μm. B Cell number of MoDCs with rounded and elongated shape. Cell counting was performed on different fields (n = 2) of five different samples. Labels on the horizontal axis (category) are the same as Fig. 4. Statistical significance (***p < 0.001; ****p < 0.0001) was established by One Way Anova
Fig. 6
Fig. 6
Structural analogies of lepadin A (1) with sphingosine (4) and its derivatives sphingosine 1-phosphate (5) and ceramides (6) reported in the intracellular signaling associated to ICD. The red notation highlights the C18-backbone and the amino-alcohol function of sphingosine that is preserved in lepadin A

Similar articles

Cited by

References

    1. Milone MC, Xu J, Chen S-J, Collins MA, Zhou J, Powell DJ, Melenhorst JJ. Engineering-enhanced CAR T cells for improved cancer therapy. Nat Cancer. 2021;2:780–793. doi: 10.1038/s43018-021-00241-5. - DOI - PMC - PubMed
    1. Franzin R, Netti GS, Spadaccino F, Porta C, Gesualdo L, Stallone G, Castellano G, Ranieri E. The use of immune checkpoint inhibitors in oncology and the occurrence of AKI where do we stand? Front Immunol. 2020 doi: 10.3389/fimmu.2020.574271. - DOI - PMC - PubMed
    1. Yu J, Sun H, Cao W, Song Y, Jiang Z. Research progress on dendritic cell vaccines in cancer immunotherapy. Exp Hematol Oncol. 2022;11:3. doi: 10.1186/s40164-022-00257-2. - DOI - PMC - PubMed
    1. Zitvogel L, Apetoh L, Ghiringhelli F, André F, Tesniere A, Kroemer G. The anticancer immune response: indispensable for therapeutic success? J Clin Invest. 2008;118:1991–2001. doi: 10.1172/JCI35180. - DOI - PMC - PubMed
    1. Kroemer G, Galluzzi L, Kepp O, Zitvogel L. Immunogenic cell death in cancer therapy. Annu Rev Immunol. 2013;31:51–72. doi: 10.1146/annurev-immunol-032712-100008. - DOI - PubMed