

Integration of longitudinal and circumferential strain predicts volumetric change across the cardiac cycle and differentiates patients along the heart failure continuum
- PMID: 37779191
- PMCID: PMC10544545
- DOI: 10.1186/s12968-023-00969-2
Integration of longitudinal and circumferential strain predicts volumetric change across the cardiac cycle and differentiates patients along the heart failure continuum
Abstract
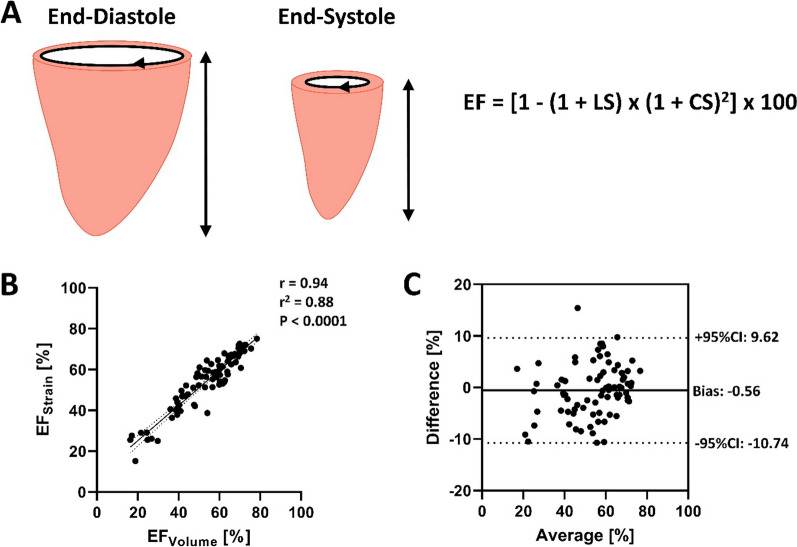
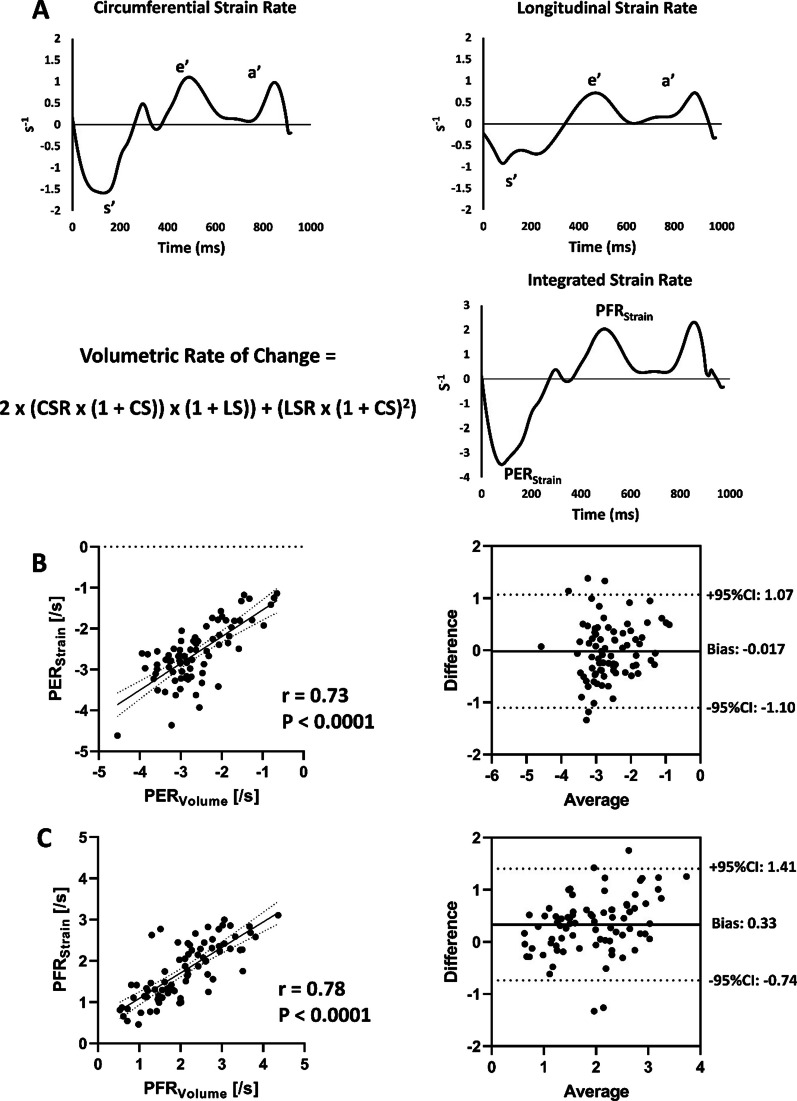
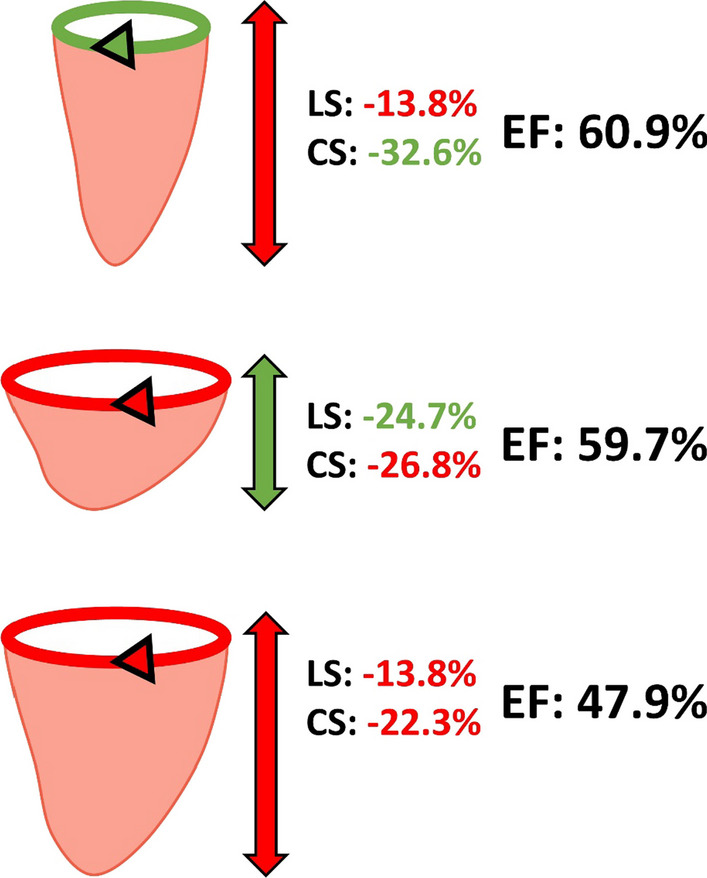
Background: Left ventricular (LV) circumferential and longitudinal strain provide important insight into LV mechanics and function, each contributing to volumetric changes throughout the cardiac cycle. We sought to explore this strain-volume relationship in more detail, by mathematically integrating circumferential and longitudinal strain and strain rate to predict LV volume and volumetric rates of change.
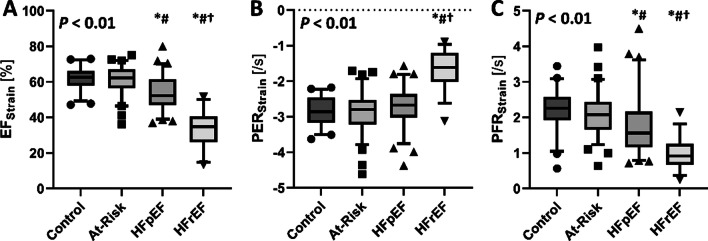
Methods: Cardiac magnetic resonance (CMR) imaging from 229 participants from the Alberta HEART Study (46 healthy controls, 77 individuals at risk for developing heart failure [HF], 70 patients with diagnosed HF with preserved ejection fraction [HFpEF], and 36 patients with diagnosed HF with reduced ejection fraction [HFrEF]) were evaluated. LV volume was assessed by the method of disks and strain/strain rate were assessed by CMR feature tracking.
Results: Integrating endocardial circumferential and longitudinal strain provided a close approximation of LV ejection fraction (EFStrain), when compared to gold-standard volumetric assessment (EFVolume: r = 0.94, P < 0.0001). Likewise, integrating circumferential and longitudinal strain rate provided a close approximation of peak ejection and peak filling rates (PERStrain and PFRStrain, respectively) compared to their gold-standard volume-time equivalents (PERVolume, r = 0.73, P < 0.0001 and PFRVolume, r = 0.78, P < 0.0001, respectively). Moreover, each integrated strain measure differentiated patients across the HF continuum (all P < 0.01), with the HFrEF group having worse EFStrain, PERStrain, and PFRStrain compared to all other groups, and HFpEF having less favorable EFStrain and PFRStrain compared to both at-risk and control groups.
Conclusions: The data herein establish the theoretical framework for integrating discrete strain components into volumetric measurements across the cardiac cycle, and highlight the potential benefit of this approach for differentiating patients along the heart failure continuum.
Keywords: Ejection fraction; Ejection rate; Filling rate; Strain; Volume-time.
© 2023. Society for Cardiovascular Magnetic Resonance.
Conflict of interest statement
The authors declare that they have no competing interests.
Figures
Similar articles
-
Cardiovascular magnetic resonance feature tracking for characterization of patients with heart failure with preserved ejection fraction: correlation of global longitudinal strain with invasive diastolic functional indices.J Cardiovasc Magn Reson. 2020 Jun 4;22(1):42. doi: 10.1186/s12968-020-00636-w. J Cardiovasc Magn Reson. 2020. PMID: 32498688 Free PMC article.
-
Layer-specific strain in patients with heart failure using cardiovascular magnetic resonance: not all layers are the same.J Cardiovasc Magn Reson. 2020 Dec 3;22(1):81. doi: 10.1186/s12968-020-00680-6. J Cardiovasc Magn Reson. 2020. PMID: 33267877 Free PMC article.
-
Myocardial mechanical function measured by cardiovascular magnetic resonance in patients with heart failure.J Cardiovasc Magn Reson. 2024 Winter;26(2):101111. doi: 10.1016/j.jocmr.2024.101111. Epub 2024 Oct 20. J Cardiovasc Magn Reson. 2024. PMID: 39433255 Free PMC article.
-
Usefulness of Left Ventricular Strain by Cardiac Magnetic Resonance Feature-Tracking to Predict Cardiovascular Events in Patients With and Without Heart Failure.Am J Cardiol. 2019 Apr 15;123(8):1301-1308. doi: 10.1016/j.amjcard.2019.01.025. Epub 2019 Jan 25. Am J Cardiol. 2019. PMID: 30717885 Free PMC article.
-
Myocardial deformation assessed among heart failure entities by cardiovascular magnetic resonance imaging.ESC Heart Fail. 2021 Apr;8(2):890-897. doi: 10.1002/ehf2.13193. Epub 2021 Feb 4. ESC Heart Fail. 2021. PMID: 33539681 Free PMC article.
Cited by
-
Contributors to high left ventricular ejection fraction in women with ischemia and no obstructive coronary artery disease: Results from the Women's Ischemia Syndrome Evaluation-Coronary Vascular Dysfunction (WISE-CVD) Study.Am Heart J. 2024 Dec;278:41-47. doi: 10.1016/j.ahj.2024.08.021. Epub 2024 Sep 2. Am Heart J. 2024. PMID: 39233211
-
High on sparsity: Interbin compensation of cardiac motion for improved assessment of left-ventricular function using 5D whole-heart MRI.Magn Reson Med. 2025 Mar;93(3):975-992. doi: 10.1002/mrm.30323. Epub 2024 Oct 9. Magn Reson Med. 2025. PMID: 39385350 Free PMC article.
References
-
- Ersboll M, Valeur N, Mogensen UM, Andersen MJ, Moller JE, Velazquez EJ, Hassager C, Sogaard P, Kober L. Prediction of all-cause mortality and heart failure admissions from global left ventricular longitudinal strain in patients with acute myocardial infarction and preserved left ventricular ejection fraction. J Am Coll Cardiol. 2013;61(23):2365–2373. doi: 10.1016/j.jacc.2013.02.061. - DOI - PubMed
-
- Kuznetsova T, Cauwenberghs N, Knez J, Yang WY, Herbots L, D'Hooge J, Haddad F, Thijs L, Voigt JU, Staessen JA: Additive prognostic value of left ventricular systolic dysfunction in a population-based cohort. Circ Cardiovasc Imaging 2016, 9(7). - PubMed
Publication types
MeSH terms
Grants and funding
LinkOut - more resources
Full Text Sources
Medical
Research Materials
Miscellaneous
