. 2023 Nov;37(11):e23209.
doi: 10.1096/fj.202300960RR.

The roles of DGAT1 and DGAT2 in human myotubes are dependent on donor patho-physiological background

Affiliations

The roles of DGAT1 and DGAT2 in human myotubes are dependent on donor patho-physiological background

Zehra Irshad et al. FASEB J. 2023 Nov.

Abstract

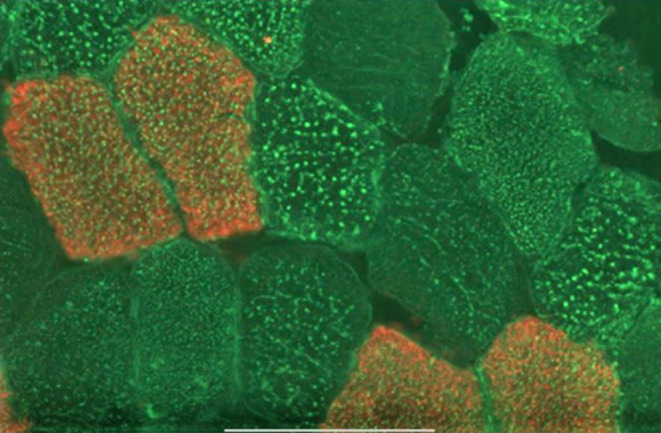
The roles of DGAT1 and DGAT2 in lipid metabolism and insulin responsiveness of human skeletal muscle were studied using cryosections and myotubes prepared from muscle biopsies from control, athlete, and impaired glucose regulation (IGR) cohorts of men. The previously observed increases in intramuscular triacylglycerol (IMTG) in athletes and IGR were shown to be related to an increase in lipid droplet (LD) area in type I fibers in athletes but, conversely, in type II fibers in IGR subjects. Specific inhibition of both diacylglycerol acyltransferase (DGAT) 1 and 2 decreased fatty acid (FA) uptake by myotubes, whereas only DGAT2 inhibition also decreased fatty acid oxidation. Fatty acid uptake in myotubes was negatively correlated with the lactate thresholds of the respective donors. DGAT2 inhibition lowered acetate uptake and oxidation in myotubes from all cohorts whereas DGAT1 inhibition had no effect. A positive correlation between acetate oxidation in myotubes and resting metabolic rate (RMR) from fatty acid oxidation in vivo was observed. Myotubes from athletes and IGR had higher rates of de novo lipogenesis from acetate that were normalized by DGAT2 inhibition. Moreover, DGAT2 inhibition in myotubes also resulted in increased insulin-induced Akt phosphorylation. The differential effects of DGAT1 and DGAT2 inhibition suggest that the specialized role of DGAT2 in esterifying nascent diacylglycerols and de novo synthesized FA is associated with synthesis of a pool of triacylglycerol, which upon hydrolysis results in effectors that promote mitochondrial fatty acid oxidation but decrease insulin signaling in skeletal muscle cells.

Keywords: diacylglycerol acyltransferases; fatty acid oxidation; insulin resistance; lipogenesis; muscle lipid; triacylglycerols.


Figures

FIGURE 1
FIGURE 1
A representative light micrograph of a cryosection from a vastus lateralis muscle biopsy obtained from an IGR individual. After fixation in formalin, sections were washed 3 times in PBS and blocked using 10% goat serum. They were then incubated with anti‐hMYH7, followed by dye‐labeled secondary antibodies (red) to visualize the type I fibers. They were further stained with Bodipy 493/503 (green) in the dark. They were then washed in PBS, dried, covered with Prolong Gold™, and mounted. The bar indicates 100 μm.
FIGURE 2
FIGURE 2
The size distribution of lipid droplets (LD) in sections of vastus lateralis muscle biopsies obtained from (A) athlete, (B) control and (C) impaired glucose regulation (IGR) cohorts in type I (white bars) and type II muscle fibers. Cryosections were obtained and stained for lipid and type I myosin and LD numbers per unit cell area in the different size ranges indicated were performed as described in the Methods section. Athlete (n = 7), control (n = 8) and IGR (n = 7).
FIGURE 3
FIGURE 3
Expression of mRNA in whole vastus lateralis muscle biopsies. mRNA expression was measured in biopsy samples from the vastus lateralis muscle obtained from men in the three cohorts studied. Values were normalized with respect to the expression of hL19 mRNA as housekeeping (HK) gene. Athletes (n = 11), control (n = 10) and IGR (n = 10). (A) mRNA expression of myosin heavy chain 2 and 7 (MYH2 and MYH7); (B) diacylglycerol acyltransferase 1 and 2 (DGAT1 and DGAT2); (C) Interleukin 6 (IL6) and tumor necrosis factor (TNF); (D) acetyl‐CoA carboxylase 1 (ACACA), acetyl‐CoA carboxylase 2 (ACACB), CD36 molecule (CD36), solute carrier family 2 member 4 (GLUT4), insulin receptor (INSR), peroxisome proliferator‐activated receptor gamma coactivator 1 alpha (PPARGC1A), perilipin 5 (PLIN5), peroxisome proliferator‐activated receptor alpha (PPARA), stearoyl‐CoA desaturase (SCD) and sterol regulatory element binding transcription factor 1 (SREBF1). *Statistically significant relative to comparative donor group (p < .05, unpaired Student's t‐test). IGR, impaired glucose regulation.
FIGURE 4
FIGURE 4
Oleic acid metabolism in myotubes derived from vastus lateralis muscle biopsies. Satellite cells isolated from biopsies of muscle from athletes, controls and IGR subjects were cultured and differentiated into myotubes. Cells were preincubated for 6 h in media containing either 5.5 mM or 20 mM glucose (NG and HG, respectively) in the presence or absence of 10 μM D1i or 10 μM D2i. The cells were then further incubated with 100 μM 14C‐oleic acid for 4 h in the presence or absence of 10 μM D1i or 10 μM D2i. Incomplete fatty acid β‐oxidation was measured as 14C‐acid‐soluble metabolites (ASM). Complete 14C‐oleic acid oxidation was measured as 14C‐CO2 and cell‐associated (CA) radioactivity. The total fatty acid uptake was calculated as the sum of ASM, CO2 and CA oleic acid (ASM + CO2 + CA). Values are presented as means ± SEM (n = 6 in each group) in absolute values (nmol/mg cell protein). (A) Oleic acid metabolism in myotubes from the three donor groups. (B) Effects of DGAT inhibitors on oleic acid metabolism when all myotube data is pooled. (C) Effect of DGAT inhibitors on oleic acid metabolism in cells from the three separate donor groups. (D) Pooled data for the effects of normoglycemia (NG, 5.5 mM glucose) and hyperglycemia (HG, 20 mM glucose) ± insulin (ins, 100 nM) on oleic acid metabolism. (E) Effect of NG and HG ± insulin on oleic acid metabolism in myotubes from the separate donor groups. (F–I) Correlations of individual donor anthropometric parameters with oleic acid oxidation and uptake in myotubes; Spearman's test of correlation between oleic acid oxidation and uptake in myotubes and lactate threshold of corresponding donors. The solid lines represent the regression line for all donors (n = 16). (F) Oleic acid oxidation in presence of D1i (r = −.56, p = .03). (G) Oleic acid uptake under NG conditions (r = −.50, p = .05). (H) Oleic acid uptake in presence of D1i (r = −.7, p = .002) and (I) in the presence of D2i inhibitor (r = −.64, p = .008). *Statistically significant relative to cells from comparative donor group (p < .05, linear mixed‐model analysis). #Statistically significant relative to basal (p < .05, linear mixed‐model analysis). D1i, DGAT1 inhibitor (T863); D2i, DGAT2 inhibitor (JNJ‐DGAT2‐A); IGR, impaired glucose regulation.
FIGURE 5
FIGURE 5
Acetate metabolism in myotubes prepared from vastus lateralis muscle. Satellite cells isolated from biopsies from musculus vastus lateralis from athletes, controls and IGR subjects were cultured and differentiated into myotubes. Cells were incubated for 6 h in media containing either 5.5 mM or 20 mM glucose (NG and HG, respectively) in the presence or absence of 10 μM D1i or 10 μM D2i. The cells were then further incubated with 100 μM 14C‐acetate for 4 h in the presence or absence of 10 μM D1i or 10 μM D2i. (A) Combined rates of uptake and oxidation of 14C‐acetate in myotubes from the three donor groups (overall effects). (B) Effects of DGAT inhibitors on acetate metabolism (overall effects on pooled data (n = 16) for myotubes from all three cohorts). (C) Overall effects of DGAT inhibitors on acetate metabolism in cells from all three cohorts. (D) Effect of NG and HG ± insulin (ins) on acetate metabolism (overall effects). (E) Overall effects of NG and HG ± ins on acetate metabolism in myotubes. Values are presented as means ± SEM (n = 6 in control group and n = 5 in the athletic and IGR groups, respectively) in absolute values (nmol/mg cell protein). (F and G) Correlations of donor anthropometric parameters with acetate oxidation in the presence of D1i in myotubes. Spearman's test of correlation between acetate oxidation in the presence of D1i in myotubes and RMR Fat (%) of corresponding donors. The solid lines represent the regression line for all donors (n = 16). (F) Acetate oxidation in the presence of D1i under NG conditions (r = .58, p = .01). (G) Acetate oxidation in the presence of D1i under HG conditions (r = .54, p = .03). *Statistically significant relative to cells from comparative donor group (p < .05, linear mixed‐model analysis). #Statistically significant relative to basal (p < .05, linear mixed‐model analysis). D1i, DGAT1 inhibitor (T863); D2i, DGAT2 inhibitor (JNJ‐DGAT2‐A); HG, hyperglycemia; IGR, impaired glucose regulation; NG, normoglycemia; RMR Fat, resting metabolic rate from fatty acid oxidation in vivo.
FIGURE 6
FIGURE 6
De novo lipogenesis from acetate in myotubes derived from vastus lateralis muscle. Satellite cells isolated from biopsies from vastus lateralis muscle from athletes, controls, and IGR subjects were cultured and differentiated into myotubes. Cells were incubated for 6 h in media containing either 5.5 mM or 20 mM glucose (NG and HG, respectively) in the presence or absence of 10 μM D1i or 10 μM D2i. The cells were then further incubated with 100 μM 14C‐acetate for 4 h under the same conditions as for the preincubation. (A) De novo lipogenesis from 14C‐acetate in myotubes from the three donor groups (overall effects). (B) Effects of DGAT inhibitors on de novo lipogenesis from acetate (overall effects). (C) Effect of DGAT inhibitors on de novo lipogenesis from acetate in cells from the three donor groups. (D) Effect of NG and HG ± insulin (ins) on de novo lipogenesis from acetate (overall effects). (E) Effect of NG and HG ± ins on de novo lipogenesis from acetate in cells from the three donor groups. Values are means ± SEM (n = 6 in control group and n = 5 in the athletic and IGR groups, respectively) in absolute values (nmol/mg cell protein). *Statistically significant relative to myotubes from comparative donor group (p < .05, linear mixed‐model analysis). #Statistically significant relative to basal (p < .05, linear mixed‐model analysis). D1i, DGAT1 inhibitor (T863); D2i, DGAT2 inhibitor (JNJ‐DGAT2‐A); HG, hyperglycemia; IGR, impaired glucose regulation; NG, normoglycemia.
FIGURE 7
FIGURE 7
Expression of mRNA for genes of enzymes involved in lipogenesis in myotubes derived from vastus lateralis muscle. Satellite cells isolated from biopsies from musculus vastus lateralis from athletes (n = 7), controls (n = 8), and IGR (n = 7) subjects were cultured and differentiated into myotubes. Cells were preincubated for 6 h in media containing either 5.5 mM or 20 mM glucose (NG and HG, respectively) in the presence or absence of 10 μM D1i or 10 μM D2i before harvested for mRNA measurement. Values were normalized with respect to the expression of L19 mRNA in each sample (HK = housekeeping). (A) mRNA expression relative to control; (B) response to D1i on mRNA expression; (C) response to D2i on mRNA expression. ACACA and ACACB, acetyl‐CoA carboxylases 1 and 2; DGAT1 and DGAT2, diacylglycerol acyltransferases 1 and 2; FASN, fatty acid synthase; HG, hyperglycemia; IGR, impaired glucose regulation; NG, normoglycemia; SCD1, stearoyl‐CoA desaturase 1. *Statistically significant relative to cells from comparative donor group (p < .05, unpaired Student's t‐test).
FIGURE 8
FIGURE 8
Akt phosphorylation relative to total Akt in myotubes derived from vastus lateralis muscle. Satellite cells isolated from biopsies from vastus lateralis muscle from athletes, controls and IGR individuals were cultured and differentiated into myotubes. Cells were incubated for 6 h in media containing either 5.5 mM or 20 mM glucose (NG and HG, respectively) in the presence or absence of 10 μM D1i or 10 μM D2i, followed by incubation in the presence or absence of 10 nM insulin for 10 min. Lysates were prepared and lysate proteins resolved by SDS‐PAGE prior to immunoblotting with anti‐Akt or anti‐phospho‐Akt(Ser473) antibodies. Representative blots for each cohort obtained using the LICOR method are given in (A). The bands were quantified and the ratio Akt‐P(Ser473)/Akt total for each incubation condition within the same experiment was computed. Values for the fold‐increase in this ratio relative to that for cells incubated under NG in the same preparation are presented. Values are means ± SEM for myotubes derived from (B) Control (n = 8), (C) Athlete (n = 6) and (D) IGR (n = 6) donors. Asterisks denote statistical significance of difference (p < .05) between values for the indicated incubation conditions. NG (5.5 mM glucose); HG (20.0 mM glucose); D1i, DGAT1 inhibitor; D2i, DGAT2 inhibitor.; insulin = 10 nM for 10 min.
FIGURE 9
FIGURE 9
Schematic representation of the proposed role of DGAT1 and DGAT2 in generating different pools of TAG. DGAT2 participates in TAG synthesis from both preformed FA and from de novo synthesized FA, whereas DGAT1 only uses preformed FA. The composition of TAG synthesized by DGAT2 from nascent DAG and de novo FA is distinct and, upon hydrolysis, generates lipid metabolites that affect insulin signaling and mitochondrial function. DGAT1 and 2, diacylglycerol acyltransferases 1 and 2; FA, fatty acid; FAO, fatty acid oxidation; TAG, triacylglycerol.

References

    1. Goodpaster BH, He J, Watkins S, Kelley DE. Skeletal muscle lipid content and insulin resistance: evidence for a paradox in endurance‐trained athletes. J Clin Endocrinol Metab. 2001;86:5755‐5761. - PubMed
    1. Russell AP. Lipotoxicity: the obese and endurance‐trained paradox. Int J Obes Relat Metab Disord. 2004;28(Suppl 4):S66‐S71. - PubMed
    1. Chavez JA, Summers SA. A ceramide‐centric view of insulin resistance. Cell Metab. 2012;15:585‐594. - PubMed
    1. Petersen MC, Shulman GI. Mechanisms of insulin action and insulin resistance. Physiol Rev. 2018;98:2133‐2223. - PMC - PubMed
    1. Bergman BC, Goodpaster BH. Exercise and muscle lipid content, composition, and localization: influence on muscle insulin sensitivity. Diabetes. 2020;69:848‐858. - PubMed