

Determinants and Stratification of Microvascular Complications of Type 2 Diabetes Mellitus
- PMID: 37779807
- PMCID: PMC10539158
- DOI: 10.7759/cureus.44348
Determinants and Stratification of Microvascular Complications of Type 2 Diabetes Mellitus
Abstract
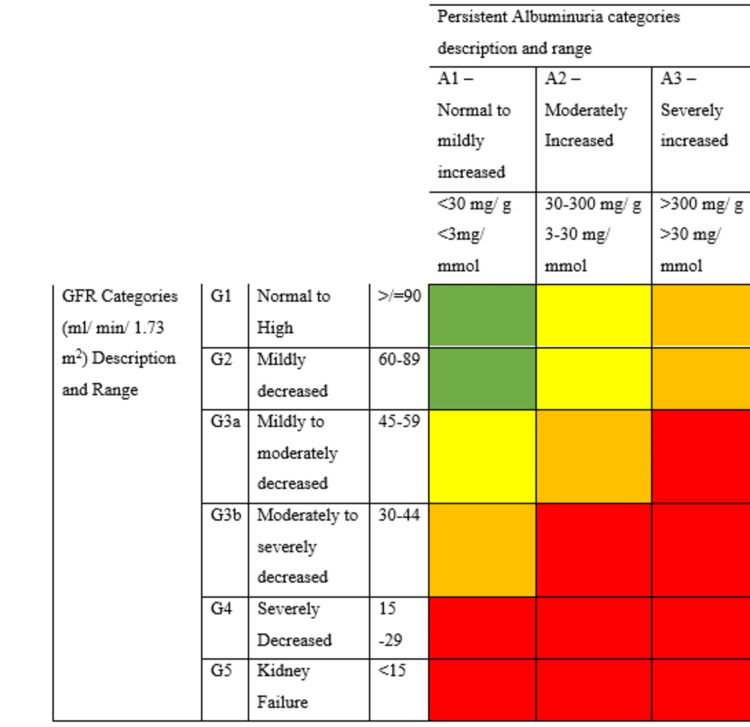
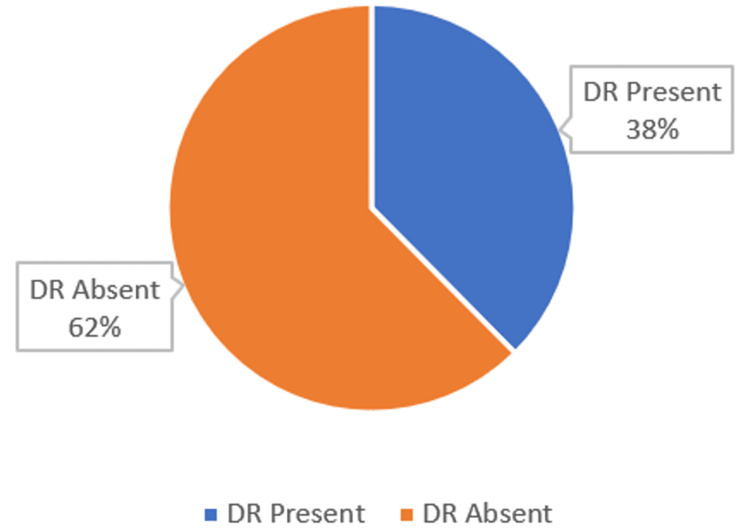
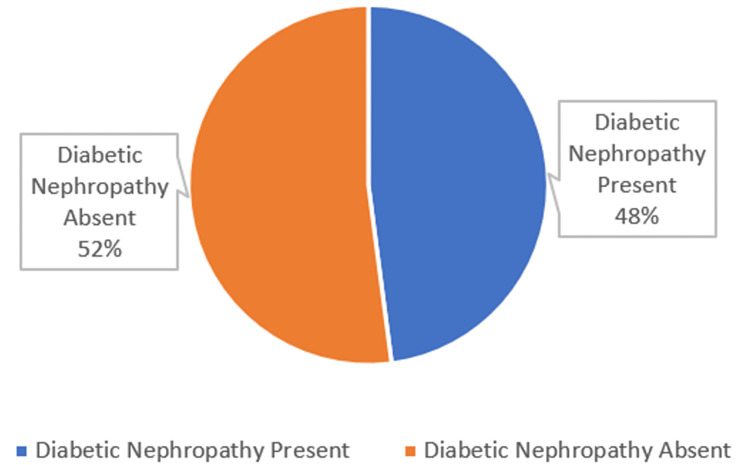
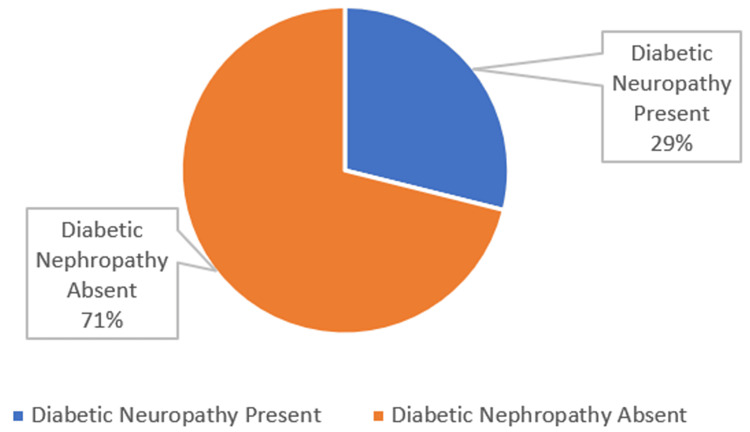
Background Diabetes mellitus (DM) is a prevalent metabolic disorder characterized by high blood sugar levels. It is classified into type 1 (T1DM) and type 2 (T2DM), which have different mechanisms and complications. The global prevalence of diabetes, particularly T2DM, has increased significantly in recent decades, leading to a need for standardized data collection of macrovascular and microvascular complications to track disease progression and guide treatment options. This study aims to assess and correlate the prevalence and severity of microvascular complications in patients with T2DM. Methodology This observational, cross-sectional study was conducted at Poonam Multispeciality Hospital in Ahmedabad, India. A total of 4,123 diabetic patients admitted to the hospital were included. Information on sociodemographics and medical history was collected using standardized forms. Fundus photography and fluorescein angiography were performed to assess diabetic retinopathy, and estimated glomerular filtration rate and albumin-to-creatinine ratio were measured to evaluate renal function. Neurological examinations were conducted to score diabetic neuropathy. Chi-square tests were used to determine associations between medical history with diabetic retinopathy and nephropathy, and t-tests were used to compare diabetic neuropathy scores. Kendall's Tau correlation was used to determine correlations between diabetic retinopathy and nephropathy. P-values <0.05 were considered statistically significant. Results The overall prevalence of diabetic retinopathy, nephropathy, and neuropathy was 37.5%. Of the patients included, 47.9% had diabetic nephropathy and 28.9% had diabetic neuropathy. A significant association was observed between the severity of diabetic retinopathy and age, body mass index, duration of diabetes, and hemoglobin A1c (HbA1C) levels. Similarly, significant associations were found between these factors and the severity of diabetic nephropathy. Unpaired t-tests revealed significant differences in diabetic neuropathy examination scores based on the duration of diabetes and Hba1C levels. Moreover, correlation analysis indicated a low, positive correlation between diabetic retinopathy and diabetic nephropathy. Conclusions This study provides insights into the prevalence, severity, and associations of microvascular complications in patients with T2DM, contributing to the understanding and management of these conditions. Additionally, the research revealed a direct association between diabetic retinopathy and different stages of chronic kidney disease determined by the Kidney Disease Improving Global Outcome guidelines.
Keywords: diabetic nephropathy; diabetic neuropathy; diabetic retinopathy; kdigo; type 2 diabetes mellitus.
Copyright © 2023, Reddy Mallimala et al.
Conflict of interest statement
The authors have declared that no competing interests exist.
Figures
Similar articles
-
A Prospective Cross-Sectional Study on the Correlation of Adenosine Deaminase and HbA1c With Microvascular Complications in Type 2 Diabetes Mellitus at a Tertiary Care Hospital in Central India.Cureus. 2024 Oct 2;16(10):e70732. doi: 10.7759/cureus.70732. eCollection 2024 Oct. Cureus. 2024. PMID: 39493017 Free PMC article.
-
Prevalence of Metabolic Syndrome and Its Risk Factors Influence on Microvascular Complications in Patients With Type 1 and Type 2 Diabetes Mellitus.Cureus. 2024 Mar 4;16(3):e55478. doi: 10.7759/cureus.55478. eCollection 2024 Mar. Cureus. 2024. PMID: 38571859 Free PMC article.
-
Association Between Estimated Glomerular Filtration Rate and Microvascular Complications in Type II Diabetes Mellitus Patients: A 1-Year Cross-Sectional Study.J Natl Med Assoc. 2019 Feb;111(1):83-87. doi: 10.1016/j.jnma.2018.06.003. Epub 2018 Jul 20. J Natl Med Assoc. 2019. PMID: 30032867
-
Diagnosing type 2 diabetes using Hemoglobin A1c: a systematic review and meta-analysis of the diagnostic cutpoint based on microvascular complications.Acta Diabetol. 2021 Mar;58(3):279-300. doi: 10.1007/s00592-020-01606-5. Epub 2020 Nov 3. Acta Diabetol. 2021. PMID: 33141338 Free PMC article.
-
Prevalence and impact of microvascular complications in type 2 diabetes mellitus on cognitive impairment and depression: a systematic review and meta-analysis.Diabetol Metab Syndr. 2025 Jun 3;17(1):187. doi: 10.1186/s13098-025-01759-9. Diabetol Metab Syndr. 2025. PMID: 40457490 Free PMC article. Review.
References
-
- Goyal R, Singhal M, Jialal I. Treasure Island, FL: StatPearls Publishing; 2023. Type 2 Diabetes. - PubMed
-
- Global trends in diabetes complications: a review of current evidence. Harding JL, Pavkov ME, Magliano DJ, Shaw JE, Gregg EW. Diabetologia. 2019;62:3–16. - PubMed
-
- Global prevalence of diabetes: estimates for the year 2000 and projections for 2030. Wild S, Roglic G, Green A, Sicree R, King H. Diabetes Care. 2004;27:1047–1053. - PubMed
-
- IDF Diabetes Atlas: global estimates for the prevalence of diabetes for 2015 and 2040. Ogurtsova K, da Rocha Fernandes JD, Huang Y, et al. Diabetes Res Clin Pract. 2017;128:40–50. - PubMed
-
- Diabetic retinopathy. Antonetti DA, Klein R, Gardner TW. N Engl J Med. 2012;366:1227–1239. - PubMed
LinkOut - more resources
Full Text Sources