

GWAS with principal component analysis identify QTLs associated with main peanut flavor-related traits
- PMID: 37780495
- PMCID: PMC10540862
- DOI: 10.3389/fpls.2023.1204415
GWAS with principal component analysis identify QTLs associated with main peanut flavor-related traits
Abstract
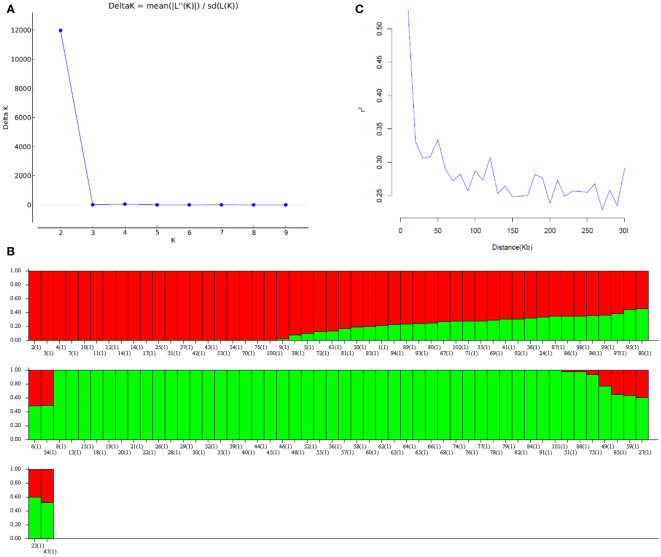
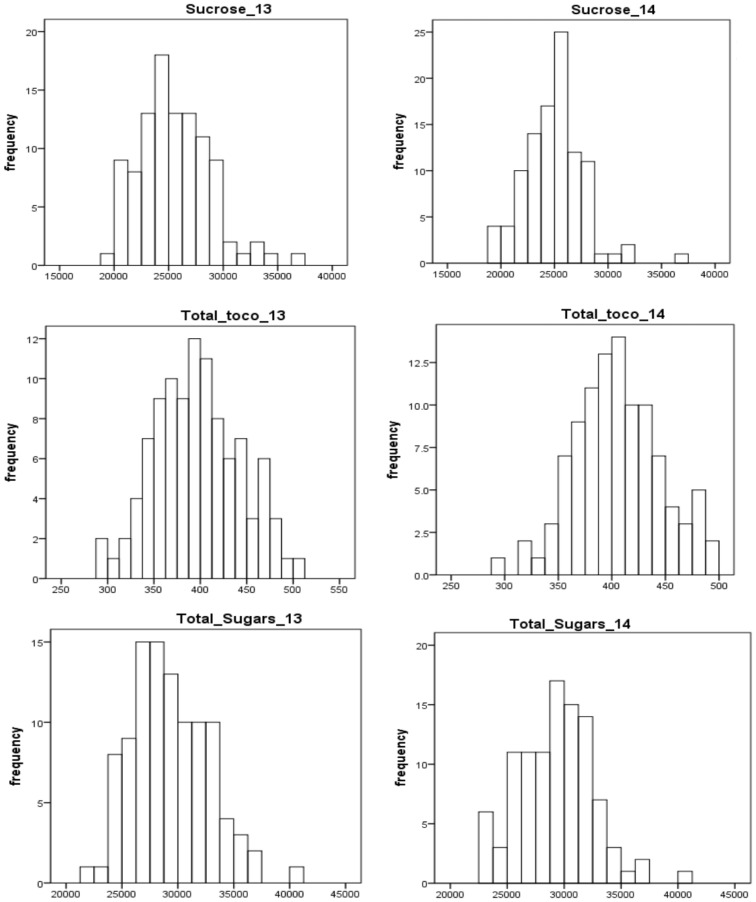
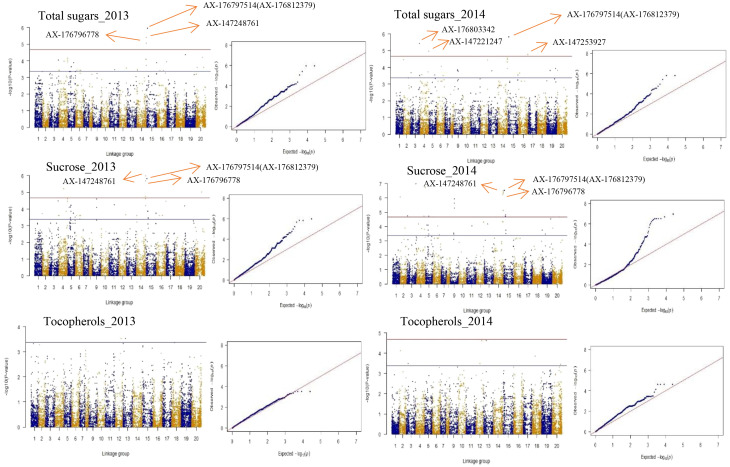
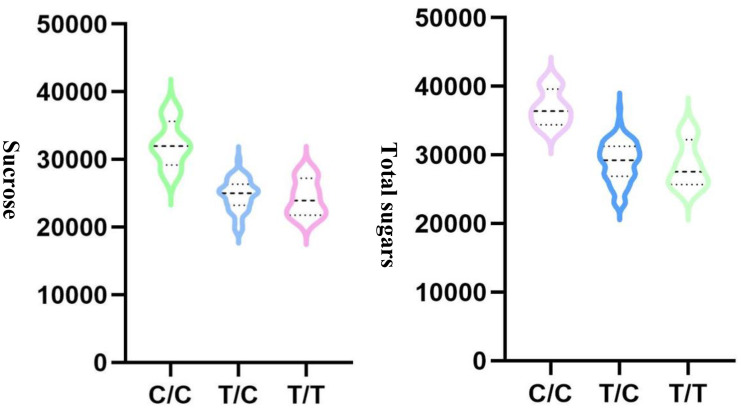
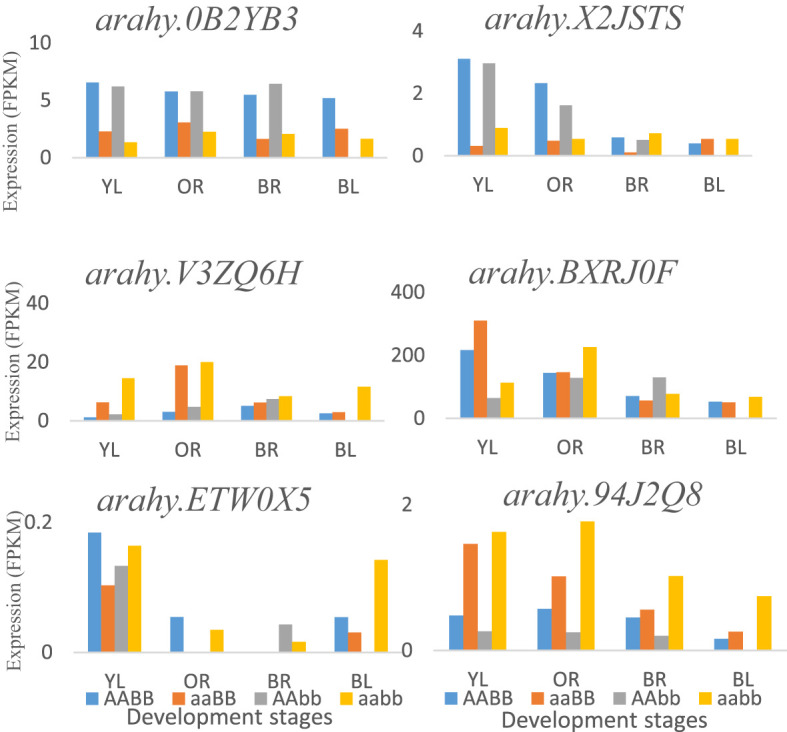
Peanut flavor is a complex and important trait affected by raw material and processing technology owing to its significant impact on consumer preference. In this research, principal component analysis (PCA) on 33 representative traits associated with flavor revealed that total sugars, sucrose, and total tocopherols provided more information related to peanut flavor. Genome-wide association studies (GWAS) using 102 U.S. peanut mini-core accessions were performed to study associations between 12,526 single nucleotide polymorphic (SNP) markers and the three traits. A total of 7 and 22 significant quantitative trait loci (QTLs) were identified to be significantly associated with total sugars and sucrose, respectively. Among these QTLs, four and eight candidate genes for the two traits were mined. In addition, two and five stable QTLs were identified for total sugars and sucrose in both years separately. No significant QTLs were detected for total tocopherols. The results from this research provide useful knowledge about the genetic control of peanut flavor, which will aid in clarifying the molecular mechanisms of flavor research in peanuts.
Keywords: GWAS; PCA; QTL; flavor; peanuts.
Copyright © 2023 Zhang, Dean, Wang, Dang, Lamb and Chen.
Conflict of interest statement
The authors declare that the research was conducted in the absence of any commercial or financial relationships that could be construed as a potential conflict of interest.
Figures
Similar articles
-
GWAS Discovery Of Candidate Genes for Yield-Related Traits in Peanut and Support from Earlier QTL Mapping Studies.Genes (Basel). 2019 Oct 12;10(10):803. doi: 10.3390/genes10100803. Genes (Basel). 2019. PMID: 31614874 Free PMC article.
-
Insights into the Genomic Architecture of Seed and Pod Quality Traits in the U.S. Peanut Mini-Core Diversity Panel.Plants (Basel). 2022 Mar 22;11(7):837. doi: 10.3390/plants11070837. Plants (Basel). 2022. PMID: 35406817 Free PMC article.
-
Identification of QTLs for resistance to leaf spots in cultivated peanut (Arachis hypogaea L.) through GWAS analysis.Theor Appl Genet. 2020 Jul;133(7):2051-2061. doi: 10.1007/s00122-020-03576-2. Epub 2020 Mar 6. Theor Appl Genet. 2020. PMID: 32144466
-
GWAS and bulked segregant analysis reveal the Loci controlling growth habit-related traits in cultivated Peanut (Arachis hypogaea L.).BMC Genomics. 2022 May 27;23(1):403. doi: 10.1186/s12864-022-08640-3. BMC Genomics. 2022. PMID: 35624420 Free PMC article.
-
High-Density Genetic Variation Map Reveals Key Candidate Loci and Genes Associated With Important Agronomic Traits in Peanut.Front Genet. 2022 Mar 25;13:845602. doi: 10.3389/fgene.2022.845602. eCollection 2022. Front Genet. 2022. PMID: 35401655 Free PMC article.
Cited by
-
Identification of a major QTL underlying sugar content in peanut kernels based on the RIL mapping population.Front Plant Sci. 2024 Jul 4;15:1423586. doi: 10.3389/fpls.2024.1423586. eCollection 2024. Front Plant Sci. 2024. PMID: 39027670 Free PMC article.
-
Detection of two homologous major QTLs and development of diagnostic molecular markers for sucrose content in peanut.Theor Appl Genet. 2024 Feb 27;137(3):61. doi: 10.1007/s00122-024-04549-5. Theor Appl Genet. 2024. PMID: 38411751
-
Assessment of Peanut Protein Powder Quality by Near-Infrared Spectroscopy and Generalized Regression Neural Network-Based Approach.Foods. 2024 May 31;13(11):1722. doi: 10.3390/foods13111722. Foods. 2024. PMID: 38890950 Free PMC article.
References
-
- Cairncross S. E., Sjöström L. B. (2004). Flavor profiles: a new approach to flavor problems. In Descriptive Sensory Analysis in Practice, M.C. Gacula (Ed.). doi: 10.1002/9780470385036.ch1b - DOI
LinkOut - more resources
Full Text Sources