. 2023 Sep 14:10:1193133.
doi: 10.3389/fmed.2023.1193133. eCollection 2023.

Development and validation of prognostic index based on purine metabolism genes in patients with bladder cancer

Affiliations

Development and validation of prognostic index based on purine metabolism genes in patients with bladder cancer

Zixuan Wu et al. Front Med (Lausanne). .

Abstract

Background: Bladder cancer (BLCA) is a prevalent malignancy affecting the urinary system and is associated with significant morbidity and mortality worldwide. Dysregulation of tumor metabolic pathways is closely linked to the initiation and proliferation of BLCA. Tumor cells exhibit distinct metabolic activities compared to normal cells, and the purine metabolism pathway, responsible for providing essential components for DNA and RNA synthesis, is believed to play a crucial role. However, the precise involvement of Purine Metabolism Genes (PMGs) in the defense mechanism against BLCA remains elusive.

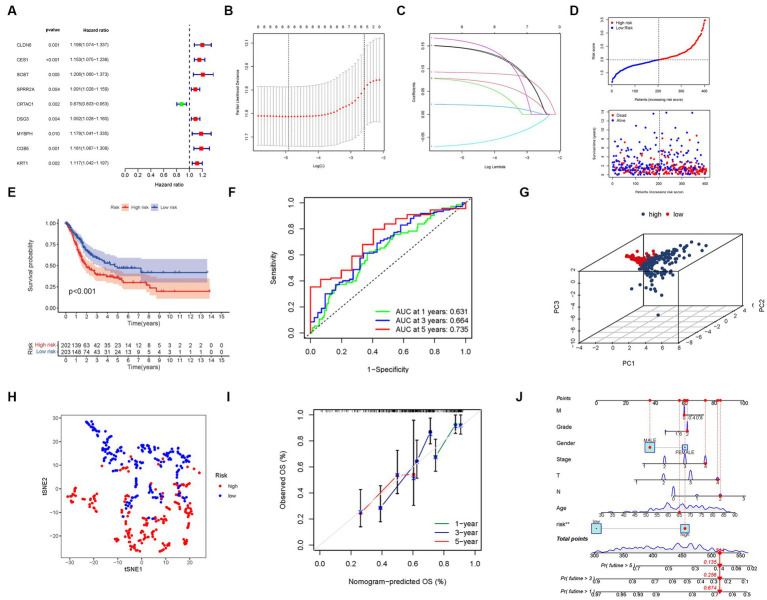
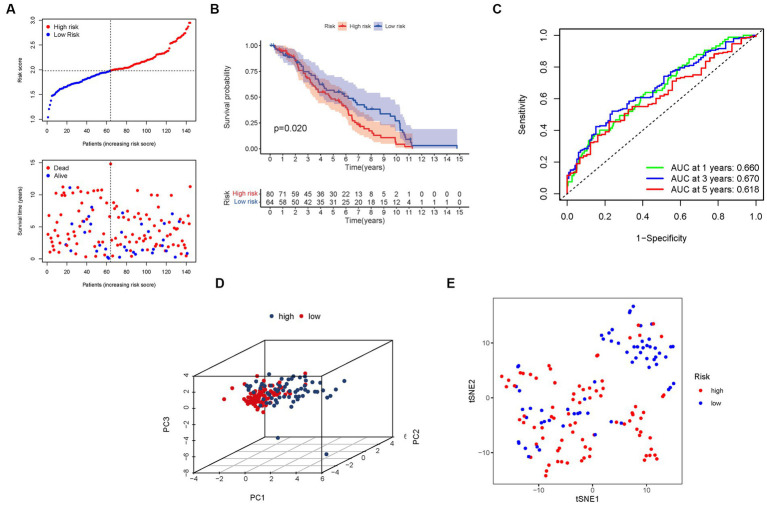
Methods: The integration of BLCA samples from the TCGA and GEO datasets facilitated the quantitative evaluation of PMGs, offering potential insights into their predictive capabilities. Leveraging the wealth of information encompassing mRNAsi, gene mutations, CNV, TMB, and clinical features within these datasets further enriched the analysis, augmenting its robustness and reliability. Through the utilization of Lasso regression, a prediction model was developed, enabling accurate prognostic assessments within the context of BLCA. Additionally, co-expression analysis shed light on the complex relationship between gene expression patterns and PMGs, unraveling their functional relevance and potential implications in BLCA.

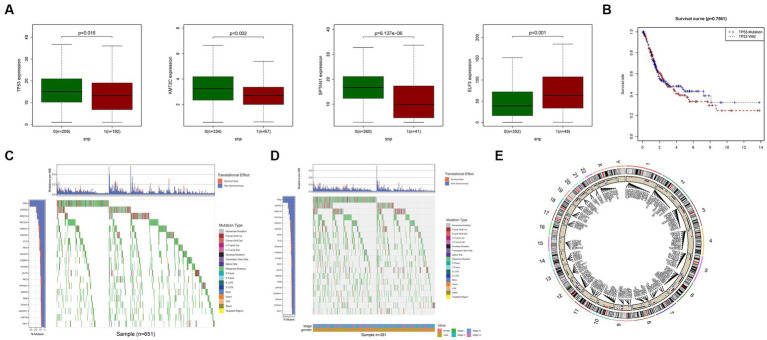
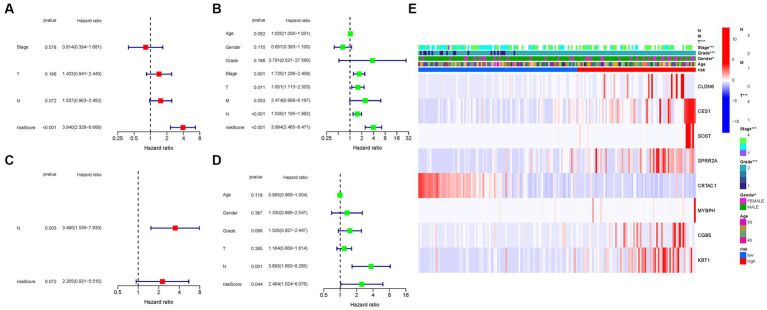
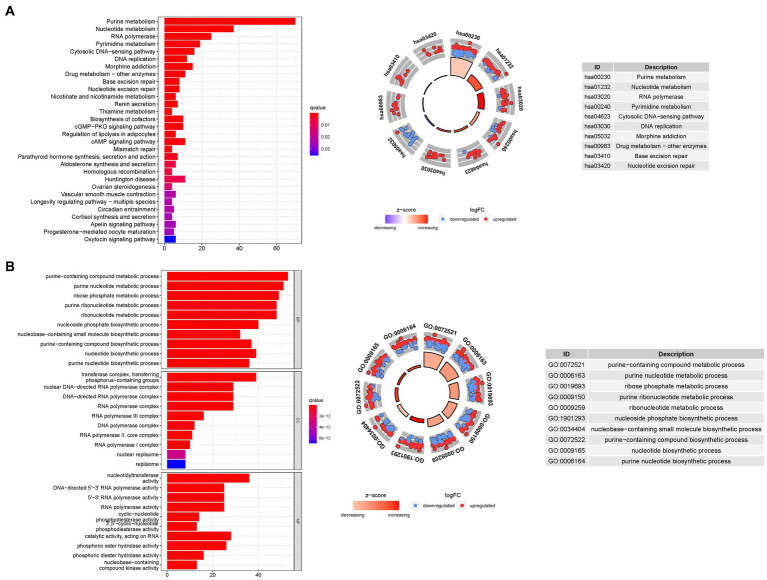
Results: PMGs exhibited increased expression levels in the high-risk cohort of BLCA patients, even in the absence of other clinical indicators, suggesting their potential as prognostic markers. GSEA revealed enrichment of immunological and tumor-related pathways specifically in the high-risk group. Furthermore, notable differences were observed in immune function and m6a gene expression between the low- and high-risk groups. Several genes, including CLDN6, CES1, SOST, SPRR2A, MYBPH, CGB5, and KRT1, were found to potentially participate in the oncogenic processes underlying BLCA. Additionally, CRTAC1 was identified as potential tumor suppressor genes. Significant discrepancies in immunological function and m6a gene expression were observed between the two risk groups, further highlighting the distinct molecular characteristics associated with different prognostic outcomes. Notably, strong correlations were observed among the prognostic model, CNVs, SNPs, and drug sensitivity profiles.

Conclusion: PMGs have been implicated in the etiology and progression of bladder cancer (BLCA). Prognostic models corresponding to this malignancy aid in the accurate prediction of patient outcomes. Notably, exploring the potential therapeutic targets within the tumor microenvironment (TME) such as PMGs and immune cell infiltration holds promise for effective BLCA management, albeit necessitating further research. Moreover, the identification of a gene signature associated with purine Metabolism presents a credible and alternative approach for predicting BLCA, signifying a burgeoning avenue for targeted therapeutic investigations in the field of BLCA.

Keywords: BLCA; CNV; PMGs; SNP; drug prediction; immunity; m6A and immune checkpoint.


Conflict of interest statement

The authors declare that the research was conducted in the absence of any commercial or financial relationships that could be construed as a potential conflict of interest.

Figures

Figure 1
Figure 1
Framework.
Figure 2
Figure 2
Expressions of the 112 PMGs and their interactions. (A) A PPI network illustrating the interactions of PMG. (B) The Purine Metabolism gene correlation network. (C) Mutations in PMGs. 16 genes over a 5% mutation rate, with POLR2K and ADCY2 being the most often modified (15%). (D) The correlation network of the genes participating in autophagy (red line: positive correlation; blue line: negative correlation. The depth of the colors reflects the strength of the relevance).
Figure 3
Figure 3
CNV, SNP and mutation analysis. (A) Correlation analysis in prognostic signatures and SNP. (B) The survival analysis of TP53. (C,D) The mutation distribution of genes in prognostic signatures. (E) CNV analysis.
Figure 4
Figure 4
Tumor categorization based on DEGs associated with purine metabolism. (A) The consensus clustering matrix (k = 2) was used to divide 414 BLCA patients into two groups. Heatmap (B). The heatmap and clinicopathologic features of the two clusters identified by these DEGs (T, Grade, and Stage indicate the degree of tumor differentiation). p values were showed as:*p < 0.05; **p < 0.01; ***p < 0.001. (C) Kaplan–Meier OS curves for the two clusters.
Figure 5
Figure 5
The development of a risk signature in the TCGA cohort. (A) A Univariate Cox regression analysis of OS for each purine metabolism-related gene, with p < 0.05 for 9 genes. (B) Regression of the 9 OS-related genes using LASSO. (C) Cross-validation is used in the LASSO regression to fine-tune parameter selection. (D) The patient’s chance of survival. (E) Kaplan–Meier curves for patients in the high- and low-risk groups’ OS. (F) The AUC for predicting the 1-, 3-, and 5-year survival rates of BLCA. (G) A PCA plot based on the risk score for BLCAs. (H) A t-SNE plot based on the risk score for BLCAs. (I,J) Nomogram.
Figure 6
Figure 6
The risk model was validated in the GEO cohort. (A) Each patient’s chance of survival. (B) Kaplan–Meier curves for patients in the high- and low-risk groups’ overall survival. (C) The AUC for predicting the 1-, 3-, and 5-year survival rates of BLCA. (D) A PCA plot based on the risk score for BLCA. (E) A t-SNE plot based on the risk score for BLCA.
Figure 7
Figure 7
Cox regression analysis, both univariate and multivariate. (A) TCGA cohort multivariate analysis. (B) TCGA cohort univariate analysis. (C) GEO cohort multivariate analysis. (D) GEO cohort univariate analysis. (E) Heatmap (green: low expression; red: high expression) illustrating the relationships between clinicopathologic characteristics and risk groups (*p < 0.05; **p < 0.01; ***p < 0.001).
Figure 8
Figure 8
For PMGs, GO, and KEGG analyses were performed. (A) The GO circle illustrates the scatter map of the selected gene’s logFC. (B) The KEGG circle illustrates the scatter map of the logFC of the indicated gene. The greater the Z-score value, the greater the expression of the enriched pathway.
Figure 9
Figure 9
PMGs gene set enrichment studies. The top six enriched functions or pathways of each cluster were provided to illustrate the distinction between related activities or pathways in various samples. FDR q-value and FWER value of p were both <0.05.
Figure 10
Figure 10
The ssGSEA scores are compared. (A,B) Comparison of the enrichment scores of 16 kinds of immune cells and 13 immune-related pathways in the TCGA cohort between the low-risk (green box) and high-risk (red box) groups. (C,D) In the GEO cohort, tumor immunity was compared between the low-risk (blue box) and high-risk (red box) groups. p values were shown as follows: ns not significant; *p < 0.05; **p < 0.01; ***p < 0.001. (E) Immune checkpoint.
Figure 11
Figure 11
The CIBERSORT scores are validated.
Figure 12
Figure 12
mRNA chemical modifications. (A) m6A. (B) M1A. (C) M7G. (D) M5C.

References

    1. Lenis AT, Lec PM, Chamie K, Mshs MD. Bladder cancer: a review. JAMA. (2020) 324:1980–91. doi: 10.1001/jama.2020.17598 - DOI - PubMed
    1. Antoni S, Ferlay J, Soerjomataram I, Znaor A, Jemal A, Bray F. Bladder cancer incidence and mortality: a global overview and recent trends. Eur Urol. (2017) 71:96–108. doi: 10.1016/j.eururo.2016.06.010 - DOI - PubMed
    1. Buisan O, Orsola A, Oliveira M, Martinez R, Etxaniz O, Areal J, et al. . Role of inflammation in the perioperative management of urothelial bladder cancer with squamous-cell features: impact of neutrophil-to-lymphocyte ratio on outcomes and response to neoadjuvant chemotherapy. Clin Genitourin Cancer. (2017) 15:e697–706. doi: 10.1016/j.clgc.2017.01.024 - DOI - PubMed
    1. DeGeorge KC, Holt HR, Hodges SC. Bladder cancer: diagnosis and treatment. Am Fam Physician. (2017) 96:507–14. PMID: - PubMed
    1. Barani M, Hosseinikhah SM, Rahdar A, Farhoudi L, Arshad R, Cucchiarini M, et al. . Nanotechnology in bladder cancer: diagnosis and treatment. Cancers (Basel). (2021) 13:2214. doi: 10.3390/cancers13092214 - DOI - PMC - PubMed