. 2023 Sep 28:9:120.
doi: 10.1038/s41378-023-00577-1. eCollection 2023.

A deformability-based biochip for precise label-free stratification of metastatic subtypes using deep learning

Affiliations

A deformability-based biochip for precise label-free stratification of metastatic subtypes using deep learning

Haojun Hua et al. Microsyst Nanoeng. .

Abstract

Cellular deformability is a promising biomarker for evaluating the physiological state of cells in medical applications. Microfluidics has emerged as a powerful technique for measuring cellular deformability. However, existing microfluidic-based assays for measuring cellular deformability rely heavily on image analysis, which can limit their scalability for high-throughput applications. Here, we develop a parallel constriction-based microfluidic flow cytometry device and an integrated computational framework (ATMQcD). The ATMQcD framework includes automatic training set generation, multiple object tracking, segmentation, and cellular deformability quantification. The system was validated using cancer cell lines of varying metastatic potential, achieving a classification accuracy of 92.4% for invasiveness assessment and stratifying cancer cells before and after hypoxia treatment. The ATMQcD system also demonstrated excellent performance in distinguishing cancer cells from leukocytes (accuracy = 89.5%). We developed a mechanical model based on power-law rheology to quantify stiffness, which was fitted with measured data directly. The model evaluated metastatic potentials for multiple cancer types and mixed cell populations, even under real-world clinical conditions. Our study presents a highly robust and transferable computational framework for multiobject tracking and deformation measurement tasks in microfluidics. We believe that this platform has the potential to pave the way for high-throughput analysis in clinical applications, providing a powerful tool for evaluating cellular deformability and assessing the physiological state of cells.

Keywords: Bionanoelectronics; Microfluidics.


Conflict of interest statement

Conflict of interestThe authors declare no competing interests.

Figures

Fig. 1
Fig. 1. Design of the constriction-based deformability cytometry (cDC) platform.
a Schematic diagram of the microfluidic device. The device had one inlet, one outlet, and four groups of microconstrictions. Samples were introduced through the device inlet and deformed in the narrow microconstrictions. b Top view of laminar flow velocity simulation of the microfluidic chip under a 50 μL/min flow rate. c The fluid flow velocity across the 36 microconstrictions under a 50 μL/min flow rate. The blue lines in the left subplot demonstrate the measuring lines in the COMSOL simulation. A scaled subplot showing a measuring line crossing a microconstriction (upper right). A line plot (bottom-right) displays velocity across the 36 microconstrictions denoted in the left subplot. d Schematic view of the cDC platform’s experimental setup and the computational framework for automatic training set generation, multiple object tracking, segmentation, and cellular deformability quantification (ATMQcD). e Time-lapse imaging demonstrated the cell deformation and movement process while passing through a microconstriction
Fig. 2
Fig. 2. Quantification of cellular deformability and the framework of the ATMQcD platform.
a Demonstration of passage time for a single cell. Passage time is calculated by T4-T2. b Demonstration of the deformation index and area-in-constriction for a single cell. The deformation index is calculated by (H − W)/(H + W). c The framework of the ATMQcD computational platform
Fig. 3
Fig. 3. Training set generation and Yolov5-based model establishment.
a The graphical principle of the background subtraction method (upper panel) and an overview of training dataset creation for Yolov5 (lower panel). b Representative images in the training set after being processed for mosaic augmentation. c The training loss, precision, recall, and mean average precision (mAP) of Yolov5. d Detection of cells by the established Yolov5 model
Fig. 4
Fig. 4. Cell tracking and quantification of cellular deformability measurements.
a Brief demonstration of cell tracking based on Deep SORT. b Schematic representation of the application of green and blue detection regions for passage time quantification and how cells with different deformability could be differentiated by passage time. c Representative optical images demonstrating the running analysis program. The blue and green circles in these images represent the blue and green detection regions, respectively. Red dots behind each cell represent the tracks, while rectangular boxes mark the cell positions. d Segmentation of a cell from its original picture based on the trained ResUNet++ model
Fig. 5
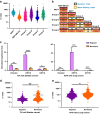
Fig. 5. Sensitive assessment of the metastatic potential of cancer cells in heterogeneous blood samples using motility and morphometric measurements.
a Box plot reflecting the difference in passage time for MCF7 and MDA-MB-231 cells. b Box plot reflecting the difference in the deformation index for MCF7 and MDA-MB-231 cells. c Box plot reflecting the difference in the area-in-constriction for MCF7 and MDA-MB-231 cells. d Three-dimensional plot showing the classifying efficiency of support vector machine (SVM) in classifying MCF7 and MDA-MB-231 using three-dimensional data (passage time, area-in-constriction, and original cell size) as input. The hyperplane dividing the two types of cells determined by SVM is displayed in three-dimensional space. Sample size in (ad): n(MCF7) = 263; n(MDA-MB-231) = 281. e Box plot reflecting the difference in cancer cell diameter and white blood cells (WBCs). f The receiver operator characteristic (ROC) curve demonstrates the performance of classifying cancer and WBCs based on cell diameter. g Box plot reflecting the difference in cell diameter between MCF7 and MDA-MB-231 cells. h ROC curve demonstrating the performance of classifying MCF7 and MDA-MB-231 cells based on cell diameter. Statistical significance was calculated by unpaired two-tailed Student’s t test (P value > 0.05: ns; <0.05: *; <0.01: **; <0.001: ***; <0.0001: ****)
Fig. 6
Fig. 6. Trajectory analysis of breast cancer cells through the cDC+ATMQcD system.
a Deformation of cells after entering the microconstriction. b Trajectory of MCF7 breast cancer cells in the position-time curve when traveling through the microconstriction. A schematic diagram of a microconstriction is shown in the line plot to demonstrate the corresponding relations between the position value on the x-axis and the actual position in the microconstriction. The range of the y-axis is 0–140 microseconds. The average time-position curves of MCF7 cells are displayed in blue. c Trajectory of breast cancer cells MDA-MB-231 in the form of the position-time curve when traveling through the microconstriction. The range of the y-axis is 0–50 microseconds. The average time-position curves of MCF7 cells are displayed in blue. The gray vertical dotted lines in (b, c) represent the entrance and exit of the microconstriction. d Plot of creeping time and cell size of MCF7 and MDA-MB-231 cells. Data points representing MCF7 and MDA-MB-231 cells are displayed in different colors. Colors of data points were also displayed according to the local density. Sample size: n(MCF7) = 263; n(MDA-MB-231) = 281. The theoretical size-tcreep curves calculated by Eq. (6) using the calculated c1 indices were plotted using dashed lines
Fig. 7
Fig. 7. Quantification of cellular deformability for distinguishing cells with different metastatic potentials.
a Comparing c1 indices of MCF7, MDA-MB-231, and four groups of mixed samples. The ratio of Group A was MCF7: MDA-MB-231 = 1:4, Group B was MCF7: MDA-MB-231 = 4:1, Group C was MCF7: MDA-MB-231 = 1:9, and Group D was MCF7: MDA-MB-231 = 9:1. Axes showing data of the c1 index are displayed with a log10 scale. Sample size: n(MCF7) = 316; n(MDA-MB-231) = 310; n(Group A) = 215; n(Group B) = 310; n(Group C) = 248; n(Group D) = 175. b Heatmap demonstrates the groupwise difference’s statistical significance in the c1 index. The statistical significance was calculated by Student’s t-test (marked in black rectangles) and Mann‒Whitney U test (marked in deep-yellow rectangles). c Normalized expression levels of vimentin, KRT16, and KRT18 in hypoxia- and normoxia-treated T24 and A549 cell lines. d Comparing c1 indices of normoxia- and hypoxia-treated bladder cancer cells (T24) based on Student’s t test. Sample size: n(hypoxia-treated T24) = 196; n(normoxia-treated T24) = 392. e Comparing c1 indices of normoxia- and hypoxia-treated lung cancer cells (A549) based on Student’s t-test. Sample size: n(hypoxia-treated A549) = 405; n(normoxia-treated A549) = 605. (P value > 0.05: ns; 0.05: *; <0.01: **; <0.001: ***; <0.0001: ****)

Similar articles

Cited by

References

    1. Zhang JL, Spath SS, Marjani SL, Zhang WG, Pan XH. Characterization of cancer genomic heterogeneity by next-generation sequencing advances precision medicine in cancer treatment. Precis Clin. Med. 2018;1:29–48. doi: 10.1093/pcmedi/pby007. - DOI - PMC - PubMed
    1. Swanton C, et al. Consensus on precision medicine for metastatic cancers: a report from the MAP conference. Ann. Oncol. 2016;27:1443–1448. doi: 10.1093/annonc/mdw192. - DOI - PubMed
    1. Barber BE, et al. Reduced red blood cell deformability in Plasmodium knowlesi malaria. Blood Adv. 2018;2:433–443. doi: 10.1182/bloodadvances.2017013730. - DOI - PMC - PubMed
    1. Dinkla S, et al. Inflammation-associated changes in lipid composition and the organization of the erythrocyte membrane. BBA Clin. 2016;5:186–192. doi: 10.1016/j.bbacli.2016.03.007. - DOI - PMC - PubMed
    1. Liao JC, et al. Label-free biosensor of phagocytosis for diagnosing bacterial infections. Biosens. Bioelectron. 2021;191:113412. doi: 10.1016/j.bios.2021.113412. - DOI - PubMed